1. Introduction
In recent years, the demand for maritime cargo transportation has been increasing, and maritime transportation has become one of the main pillars of the world economy today (Konrad et al., Reference Konrad, Linus, Jan and Klaus2022). Automatic Identification System (AIS), as a communication system for ships, automatically broadcasts static and dynamic information related to ship navigation through VHF, strengthening the interconnection between ships, and between ships and shore (Shelmerdine, Reference Shelmerdine2015). To ensure the safety of maritime traffic, the International Convention for Safety of Life at Sea (SOLAS) Convention, issued by the International Maritime Organization (IMO) in 2002, requires all ships over 300 tons to be equipped with AIS. By 2021, more than 1,644,000 ships have been equipped with AIS allowing for daily maritime communication broadcasts (Sciancalepore et al., Reference Sciancalepore, Tedeschi, Aziz and Pietro2022). The ship trajectory data are mainly obtained through AIS, which generates a relatively rich dataset describing ship traffic. Given that AIS sends information more often, a ship trajectory data message is automatically broadcast every 2 s to 6 min based on the ship's speed and course changes (Martin et al., Reference Martin, Vendela, Axel, Henrik and Christian2019). It is important to use ship AIS trajectory data for marine traffic research purposes such as ship collision avoidance, ship trajectory prediction, ship anomaly identification, ship discharge and optimisation of port service efficiency (Ng et al., Reference Ng, Loh, Lin, Booth, Chan, Yip, Li and Lau2013; Pallotta et al., Reference Pallotta, Vespe and Bryan2013; Meng et al., Reference Meng, Weng and Li2014; Zissis et al., Reference Zissis, Xidias and Lekkas2016; Chen et al., Reference Chen, Bian, Wan, Yang, Zheng and Wang2019; Zhang et al., Reference Zhang, Meng and Fwa2019). As increasingly more ships are installed with AIS equipment, and because of the frequent nature of AIS information release relative to a ship's motion behaviour, large-scale AIS data are generated, especially in waters with high ship traffic which may generate more than 100 million data points per day. This leads to a high level of redundancy in data related to ship navigation, increasing the cost of data storage, transmission and query processing (Zhang et al., Reference Zhang, Liu, Cai, Wu and Shi2016; Zhu and Ma, Reference Zhu and Ma2021; Zhou et al., Reference Zhou, Zhang, Zhang, Yuan and Wang2023). The large amount of accumulated AIS data not only poses challenges to the use of the data, but also makes it difficult to conduct water research based on AIS information. Considering that the ship's trajectory on the water is relatively stable, it is not necessary to represent it by all the collected trajectory points. Trajectory compression technology can eliminate redundant points in the data while ensuring the overall shape of the trajectory. How to choose the appropriate trajectory compression algorithm to extract the valuable information from the massive data, eliminate the redundant points in the AIS data, and retain the key position, time, heading and other information is the main direction of the current trajectory compression research.
Ship AIS trajectory compression aims to identify whether the trajectory points change significantly according to the appropriate compression strategy, so as to reduce redundant trajectory points. Drawing from the cutting-edge research, it mainly focuses on the following aspects.
To reduce the amount of redundant position information, one common method is to find out whether each trajectory point has experienced a non-negligible change in two-dimensional (2D) space based on the spatial state of the original trajectory points. For example, by connecting the initial and final trajectory points, the Douglas–Peucker algorithm, an offline processing technique, determines the vertical Euclidean distance between each trajectory point and a straight line (Douglas and Peucker, Reference Douglas and Peucker1973), and compares the maximum distance obtained with a set threshold. If it is less than the threshold value, the section of trajectory is compressed into this straight line and the trajectory compression ends; if it is greater than the threshold value, the trajectory is divided into two sections by this trajectory point and the previous steps are repeated, so as to carry out the compression of the trajectory. The Sliding Window algorithm is an online trajectory compression algorithm (Keogh et al., Reference Keogh, Chu, Hart and Pazzani2001) which achieves online compression of trajectory points by initialising a fixed-size window and gradually inputting trajectory point data to the window, then calculating the point-to-line vertical Euclidean distance for the trajectory points within the window, and finally comparing the obtained vertical Euclidean distance with the set threshold. The researchers also improved the classical Sliding Window algorithm by adding the leeway and drift angle as the threshold value (Gao et al., Reference Gao, Shi and Li2018). A trajectory point will be removed as redundant if, after the original trajectory is compressed using the improved Sliding Window compression algorithm, its vertical distance, leeway and drift angle are less than both the distance threshold and the angle threshold. Otherwise, it will be kept as a feature point. The grating compression algorithm selects three trajectory points in sequence from the first trajectory point of the trajectory segment (Ji et al., Reference Ji, Qi and Balling2022), connects the initial and mid points to form the main axis of a sector, and judges if the final point is inside the set sector opening angle. If it is within the sector opening angle, the middle point will be deleted and one point will be taken backwards to repeat the previous steps; if it is not inside the sector opening angle, the trajectory will be considered to have an important shift and the mid point will be kept, and then the middle point will be the new first point to repeat the previous steps, and so on until the last point is executed. To solve the limitation that the grating algorithm needs to set the open angle threshold separately when compressing different ship trajectories, Ji et al. (Reference Ji, Qi and Balling2022) proposed a Dynamic Adaptive Grating (DAG) algorithm, which replaces the original open angle threshold with the edge length threshold with an equation. The DAG algorithm will determine the edge length threshold, which is less than the desired compression error value, through multiple iterations and compress the ship trajectory in accordance with it. The user only needs to set the desired compression error value.
The second type of algorithm is based on the spatio-temporal information of AIS trajectory, such as the position information, time information, course information and speed information of ship trajectory points to judge the feature points of the original trajectory points, so as to eliminate the redundant points and get the compressed trajectory. Since the ships’ dynamic information is also critical in practical applications, this information cannot be retained in the first type of trajectory compression algorithm, which may lead to the loss of key information points. The classical Douglas–Peucker compression algorithm was improved by adding the time dimension as the third dimension (Li et al., Reference Li, Hu and Meng2010), and the dynamic Douglas–Peucker compression algorithm was proposed, which realised the compression of dynamic information like the ship's course and speed. First, the approximate ship anchoring points are judged by setting the velocity threshold and distance threshold, then the original trajectory is segmented according to the anchoring point, and finally, the improved Douglas–Peucker compression algorithm is used to compress the sub-trajectories. Some researchers have combined the classical Douglas–Peucker algorithm with the Sliding Window algorithm (Wei et al., Reference Wei, Xie and Zhang2020). First, they compress the original ship trajectory according to the spatial state by the Douglas–Peucker algorithm. Next, using the Sliding Window algorithm, they compress the initial ship trajectory based on the two dynamic ship attributes, speed and course. Lastly, they combine the obtained results into a compressed trajectory considering both spatial and dynamic feature attributes. For the research on trajectory segmentation, the adaptive segmentation compression algorithm of ship trajectory based on information entropy was proposed (Yang and Ma, Reference Yang and Ma2022). Based on the course information or speed information of the original trajectory, the trajectory is segmented by the information entropy algorithm, and the fineness of the segmentation is adjusted by setting the information entropy threshold size. Then, the Top-Down Time-Ratio (TD-TR) algorithm is used to compress the sub-trajectories to get the compressed trajectory. Some researchers performed an algorithmic optimisation of the Directed acyclic graph based Online Trajectory Simplification (DOTS) algorithm and applied it to ship trajectory compression (Zhang et al., Reference Zhang, Shi and Li2020). First, the newly arrived trajectory points are put into the corresponding queue according to the MMSI number, then the noisy points are detected and cleaned by the cleaning algorithm. By using the cumulative squared simultaneous Euclidean distance as a basis, the compressed path tree incorporates the cleaned and retained trajectory points. Finally, the compressed trajectory is output.
A Dynamic Threshold with Global Optimised (DTGO) algorithm was proposed for the online compression of ship trajectory (Song et al., Reference Song, Zhu, Gao and Chang2019). The anchoring points and feature points are detected by the stopping interval value, distance threshold, speed threshold and angle threshold for the upcoming trajectory points. If the trajectory point is an anchoring point, the trajectory is segmented here to keep the anchoring points and feature points, and eliminate the redundant points. Finally, the segmented trajectory is compressed and globally optimised again to get the simplified ship trajectory. By establishing a ship motion model, and setting time, speed and turning thresholds, a motion pattern-based ship trajectory segmentation compression algorithm was proposed (Sheng et al., Reference Sheng, Liu, Zhou and Feng2018). Then, judge the anchoring trajectory, turning trajectory and linear trajectory in the original ship trajectory, according to the ship dynamic information, and calculate the characteristic attributes of the ship trajectory. Finally, the anchoring trajectory, turning trajectory and linear trajectory are compressed into sub-trajectory segments composed of several trajectory points to realise the trajectory compression result.
Ship trajectory includes not only spatial information, but also temporal information. From this perspective, it is essentially vector data in three-dimensional (3D) space consisting of longitude, latitude and time axis. The first type of algorithm above is a data compression of a 2D space consisting of longitude and latitude, whereas the second type of algorithm considers the information of the time axis. It can be seen that increasingly more scholars recognise the importance of temporal information for ship trajectories, so it is necessary to carry out research on the compression of ship 3D trajectories. For the second type of algorithm, to compress both dynamic and AIS position data, the majority of researchers have enhanced the conventional algorithms in the first type. Most of the improved algorithms and newly proposed algorithms have to set more thresholds, and whether the thresholds are set reasonably or not directly affects the final compression results, which leads to some limitations of these algorithms. Therefore, to reasonably mine the AIS big data and make full use of the multidimensional features of ship navigation behaviour, we propose to use the Dynamic Programming algorithm to realise the 3D compression of AIS trajectories. In practical applications, for it to achieve close to or optimal compression results for vector data, dynamic programming algorithms are frequently used to solve optimisation problems (Perez and Vidal, Reference Perez and Vidal1994). Additionally, great achievements have been made in vector data compression, such as communication data compression, GPS track data compression, computer chat message compression and DNA sequence compression (Luo et al., Reference Luo, Gu and Lin2018; Punitha and Murugan, Reference Punitha and Murugan2019; Zheng et al., Reference Zheng, Zhao, Lian, Zheng, Liu and Zhou2020; Cadavid and Madrigal, Reference Cadavid and Madrigal2021). Compared with other AIS spatio-temporal trajectory compression algorithms, the Dynamic Programming algorithm does not require setting a threshold and minimises the trajectory compression error at the same compression ratio.
In view of the advantages and characteristics of the Dynamic Programming algorithm, we apply the Dynamic Programming algorithm to AIS ship spatio-temporal trajectory compression to find the optimal compression scheme by the given ship trajectory points, compression ratio and compression error index. In the first part of this paper, the principle of the algorithm is elaborated, and the second part shows the experiments and results from applications of the algorithm. Finally, the contributions of this paper are summarised and future work is proposed.
2. Methodology
2.1 Compression preparation and definitions
Given that the spatial compression algorithm of ship trajectory cannot compress the dynamic information of AIS, we propose a spatiotemporal compression of ship AIS trajectory by the Dynamic Programming algorithm to retain the ship trajectory points containing important dynamic information. First, we define a spatiotemporal dimensionality with space and time axes, and feed the ship trajectory points into this dimensionality. Suppose the ship trajectory points are denoted by $k$ , and contain the information of longitude, latitude and time. So, $k=(x_l,\,y_l,\,t)$
 .
Chart projection can convert ellipsoidal earth into planar earth. Usually, the ship position information in AIS data cannot be used to calculate the distance directly, so to calculate the distance between ship trajectory points, it is necessary to convert the geodetic coordinate system in AIS data into a coordinate system that can calculate the distance between trajectory points directly. Mercator projection uses a positive axis equirectangular cylindrical projection, which is not easily deformed after projection and can maintain angular and directional accuracy (Usery et al., Reference Usery, Finn and Mugnier2009). Additionally, Mercator's coordinates are not Cartesian, so the linear measure on each axis is not the same. However, the simplification in Mercator coordinates does not result in large values of deviations. Therefore, we project the geographic coordinates to Mercator coordinates for screening compressed trajectory points purpose in our research. The following equation are used to convert the latitude and longitude coordinates to Mercator coordinates to observe the compression's accuracy intuitively:


where $x_l$ and $y_l$
 represent the trajectory point's longitude and latitude; $x$
 and $y$
 are the Mercator coordinates; $r$
 is the radius of the baseline latitudinal circle; $a$
 is the radius of the long axis of the Earth's ellipsoid; $e$
 is the first eccentricity of the Earth's ellipsoid; $q$
 is the equivalent dimension. The ship trajectory points after Mercator transformation can be expressed as $k=(x,\,y,\,t)$
 .
Suppose the original trajectory segment $T$ consists of a set of $I$
 trajectory points $k_1$
 ,$k_2$
 ,…,$k_I$
 . The original trajectory $T$
 can be expressed as

where $t_1 \le t_n \le t_I$ .
Compressed trajectory refers to the new trajectory which is formed after the original trajectory is processed by the compression algorithm. Suppose the compressed trajectory segment $T_{sim}$ consists of a set of $L$
 trajectory points $k'_1,\,k'_2,\,\ldots,\,k'_L,$
 and $J$
 denotes the number of sub-trajectory segments of the compressed trajectory $T_{sim}$
 , $J=L-1$
 . Similarly, the compressed trajectory $T_{sim}$
 can be expressed as

where $t_1 \le t_m \le t_L$ .
Compression ratio is a metric that evaluates how effectively a compression method performs, and the compression ratio refers to the ratio of the number of compressed trajectory points to the number of original trajectory points, then the compression ratio $r$ can be expressed as

Another metric to evaluate the performance of the compression algorithm is the compression error (Tang et al., Reference Tang, Wang, Zhao, Tang, Yan and Xiao2021). The current evaluation criteria for the compression error of vector data are the maximum displacement distance, the sum of displacement distances and the deviation area. The sum of displacement distances is the sum of the distances from the trajectory points on each sub-trajectory segment to the sub-trajectory segment compressed into a line segment. The sum of displacement distances can be expressed as

where $e(k'_m,\,k'_{m+1})$ is the sum of the distances from the trajectory points on the sub-trajectory segments of the original trajectory $T$
 to the sub-trajectory segments $\{k'_m,\,k'_{m+1}\}$
 of the compressed trajectory $T_{sim}$
 ; $\varepsilon$
 is the compression error of the original trajectory $T$
 .
The vertical synchronisation distance can be used to evaluate the retention of temporal information of the compressed trajectory (Zhong et al., Reference Zhong, Kong, Zhang, Jiang, Fan and Wang2022). As shown in Figure 1, the compressed trajectory point $k_c (x_c,\,y_c,\,t_c)$ is projected to the compressed trajectory by Mercator to get point $k'''_c (x'''_c,\,y'''_c,\,t_c)$
 , point $k''_c (x''_c,\,y''_c,\,t_c)$
 is the time synchronisation point of point $k_c (x_c,\,y_c,\,t_c)$
 and the distance from point $k''_c (x''_c,\,y''_c,\,t_c)$
 to point $k'''_c (x'''_c,\,y'''_c,\,t_c)$
 is the vertical synchronisation distance. The equations are as follows:


where $K$ and $B$
 are the slope and constant of the spatial segment formed by point $k_b$
 and point $k_d$
 , respectively.


The time synchronisation point $k''_c$ can be obtained according to the spatial linear equation,


According to Equations (11)–(14), the vertical synchronisation distance $S_t$ is obtained,

The vertical synchronisation distance of the whole compressed trajectory is obtained by accumulating the vertical synchronisation distance of each sub-trajectory segment after compression. The smaller the vertical synchronisation distance is, the better the compression algorithm retains the temporal information of the trajectory.
Vertical synchronisation distance

2.2 Optimised compression process analysis
As an optimisation algorithm in vector data compression algorithm (Chen and Ren, Reference Chen and Ren2010), the Dynamic Programming algorithm is essentially in the process of finding the optimisation in the application of AIS trajectory compression. For a given original trajectory segment $T$ and compression ratio $r$
 , the number of trajectory points $L=r*I$
 of the compressed trajectory $T_{sim}$
 can be obtained, and $L$
 needs to be an integer. That is, the $T$
 containing $I$
 trajectory points is compressed to $T_{sim}$
 containing $L$
 trajectories, and the compression error $\varepsilon$
 is minimised. Obviously, the compressed trajectory $T_{sim}$
 is a subset of the original trajectory $T$
 . Therefore, for any trajectory point $k'_{u} (1 \le u \le L)$
 in $T_{sim}$
 , there is always a trajectory point $k_v (1 \le v \le I)$
 in $T$
 corresponding to it. That is, there always exists $k_b$
 and $k_d (1 \le b< d \le L)$
 to make

where $e(k_b,\,k_d)$ denotes the sum of distances from all trajectory points on the original trajectory $T$
 between $k_b$
 and $k_d$
 to the sub-trajectory segments $\{k_b,\,k_d\}$
 .
In the research of vector data compression based on the Dynamic Programming algorithm, the vertical Euclidean distance is usually used as the distance metric, so the compression results obtained only consider the geometrical characteristics of the data. The synchronous Euclidean distance is a distance metric that can consider both temporal and positional information. In this paper, the synchronous Euclidean distance will be used instead of the vertical Euclidean distance to calculate the displacement distance, which realises the Dynamic Programming algorithm to compress the original trajectory for the spatio-temporal information of the trajectory data. As shown in Figure 1, the synchronous Euclidean distance $S$ can be obtained in Equation (17) by referencing Equations (13) and (14) as follows:

According to Equations (16) and (17), it is obtained that

The compression error $\varepsilon$ of the original trajectory $T$
 is the sum of the distances from the trajectory points on each sub-trajectory segment to the straight-line segment into which the sub-trajectory segment is compressed:

The final of optimal compression is to minimise the value of compression error $\varepsilon$ for the compressed trajectory $T_{sim}=\{k'_1,\,\ldots,\,k'_m,\,\ldots,\,k'_L\}$
 consisting of the remaining $L$
 trajectory points after compression,

2.3 Dynamic Programming algorithm to solve
The basic idea of the Dynamic Programming algorithm is to divide the original problem to be solved into several sub-problems, and to obtain the solution of the original problem by solving these sub-problems. To solve the optimal compression problem, it is first necessary to define a discrete 2D state space $\omega$ by which the relationship between the number of trajectory points $I$
 of the original trajectory $T$
 and the number of sub-trajectory segments $J$
 of the compressed trajectory $T_{sim}$
 is established, $\omega =\{(i,\,j):i=1,\,\ldots,\,I;j=0,\,\ldots,\,J\}$
 . Any point $(i,\,j)$
 in the 2D state space represents a subproblem of compressing $i$
 trajectory points into a compressed trajectory with $j$
 sub-trajectory segments, so the target state of the original problem is $(I,\,J)$
 .
Additionally, the target compression trajectory $T_{sim}$ with compression error $\varepsilon _m$
 can be expressed as an optimal path from the starting state $(1,\,0)$
 to the target state $(I,\,J)$
 in a discrete 2D state space. Therefore, we need to define the cost function $D(i,\,j)$
 for state $(i,\,j)$
 , and $D(i,\,j)$
 denotes the optimal cost value of compressing the $i$
 trajectory points into $j$
 sub-trajectory segments of the compressed trajectory, that is, the minimum compression error value.
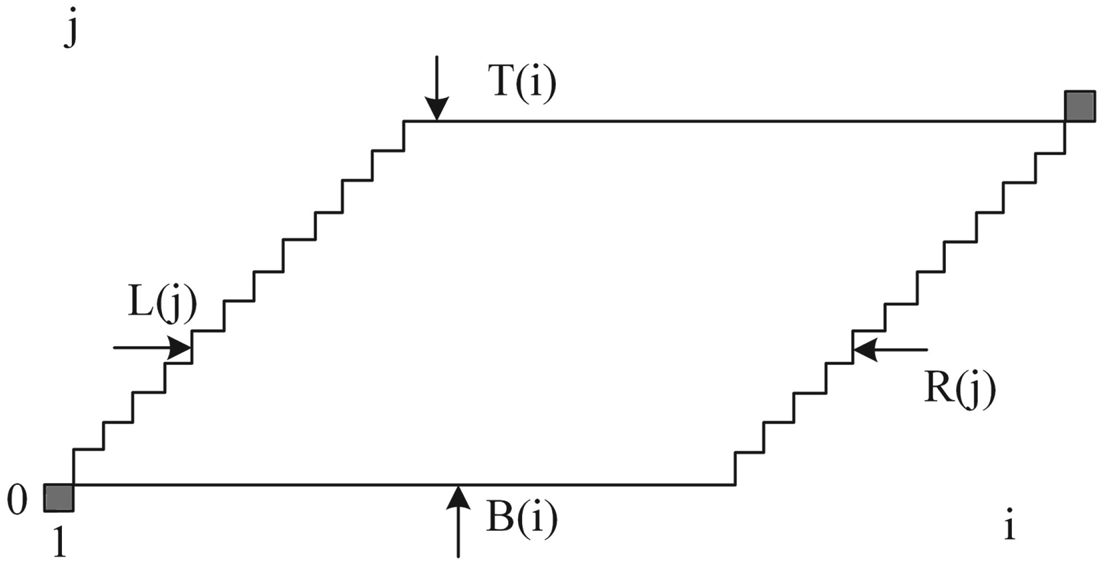
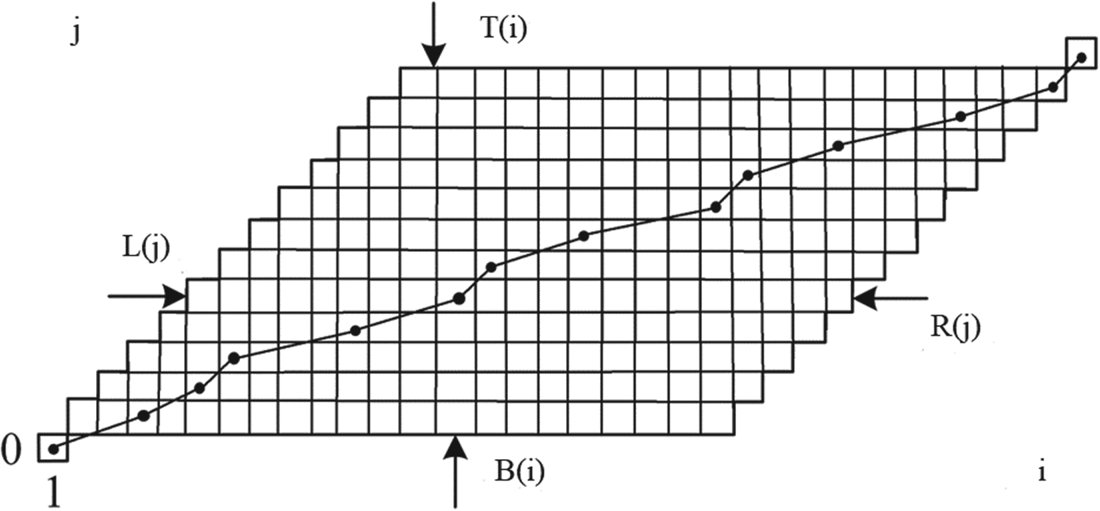
To find the optimal path to reach the target state $(I,\,J)$ , we can introduce boundary functions $L(j)$
 , $R(j)$
 , $B(i)$
 and $T(i)$
 to the state space $\omega$
 to turn the state space $\omega$
 into a bounded space, as shown in Figure 2. The boundary functions are as follows:


State space $\omega$ with the introduction of boundary conditions

Finally, based on the basic idea of dynamic programming, this optimal compression problem can be solved by the following recursive equation:

where $A(i,\,j)$ provides the minimum value of the cost function $D(i,\,j)$
 under state $(i,\,j)$
 , and is the parent state of the cost function $D(i,\,j)$
 .
Using the dynamic programming model described above, the recursion starts from the cost function $D(1,\,0)$ to $D(I,\,J)$
 step by step. The final value of $D(I,\,J)$
 obtained is the minimum compression error value sought, and the compression trajectory $T_{sim}$
 is obtained. The trajectory compression based on the Dynamic Programming algorithm is performed by combining the given original trajectory and the user's desired compression ratio with the specified compression error metric for ship trajectory compression. The results obtained are shown in Figure 3. Based on the literature and the steps of Algorithm ?? and the literature, the time complexity of the trajectory compression based on the Dynamic Programming algorithm is $O(I^2 J)$
 and the space complexity is $O(IJ)$
 .
Optimal path to reach the goal state in the state space $\omega$

Trajectory compression based on Dynamic Programming algorithm.

3. Experiments and results
3.1 Experimental data of ship trajectory
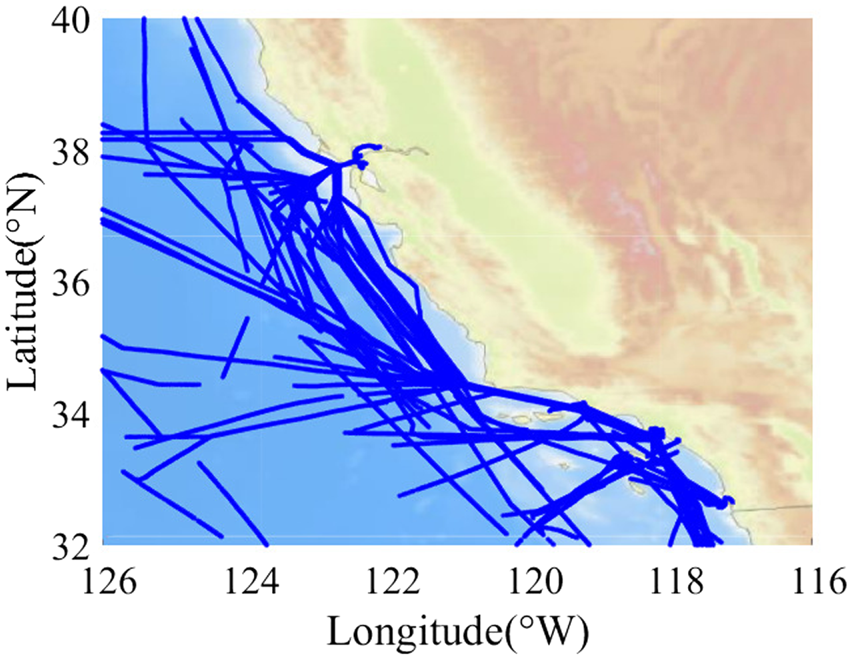
To evaluate whether the Dynamic Programming algorithm presented in this paper is effective, the experiments are compressed using actual AIS data near the ports of Long Beach and San Francisco in the United States. We compare results with the classical Douglas–Peucker algorithm, Sliding Window algorithm and TD-TR algorithm. Among them, the classical Douglas–Peucker algorithm and Sliding Window algorithm can be used as the reference of the algorithm in this paper. Moreover, the TD-TR algorithm, which is a data compression of a 3D space consisting of longitude, latitude and time, is used as a comparison for the algorithm in this paper. The AIS data used in this experiment contain all encounter postures and motion states of different types of ships. After filtering and eliminating the error information and incomplete information in the AIS data, the experimental data total 330,897 ship trajectory points. Figure 4 shows the distribution of ship trajectory points.
Original trajectories points graph of ships in the ports of Long Beach and San Francisco

The ship AIS data include not only dynamic information, but also static information such as ship Marine Mobile Service Identification (MMSI), ship name and ship type. The MMSI number is used as the unique identification number of a ship and the corresponding ship information can be quickly found by the MMSI number. Therefore, the 330,897 ship trajectory points are classified according to MMSI number and connected by time order to divide them into 249 ship trajectories and in Figure 5, the results are shown.
Original trajectories lines graph of ships in the ports of Long Beach and San Francisco

3.2 Comparison analysis of experimental results
The following is a statistical and comparative analysis of the algorithm proposed in this paper in terms of trajectory compression result graph, compression ratio, compression error and vertical synchronisation distance in four directions based on the experimental results. The algorithms for comparative analysis are the TD-TR algorithm, the Douglas Peucker algorithm and the Sliding Window algorithm.
3.2.1 Comparison analysis of experimental results
By setting the compression ratio of the Dynamic Programming algorithm and the distance threshold of the other three algorithms, the ship compression trajectory lines graphs of the four algorithms with an overall compression ratio of 1% were obtained. As shown in Figure 6, the light blue colour represents the original ship trajectory, and the compressed ship trajectory points are shown in dark blue. Figure 6(a) shows the compression result graph of the dynamic programming algorithm at the set compression ratio of 1%; Figure 6(b) shows the compression result graph for the TD-TR algorithm with a distance threshold of 48$\,\cdot\,$ 5994 n miles and an overall compression ratio of 1%; Figure 6(c) shows the compression result graph for the Douglas–Peucker algorithm with a distance threshold of 0$\,\cdot\,$
 6150 n miles and an overall compression ratio of 1%; Figure 6(d) shows the compression result graph for the Sliding Window algorithm with a distance threshold of 0$\,\cdot\,$
 0907 n miles and an overall compression ratio of 1%.
Compression results: (a) Dynamic Programming compression; (b) TD-TR compression; (c) Douglas–Peucker compression; (d) Sliding Window compression

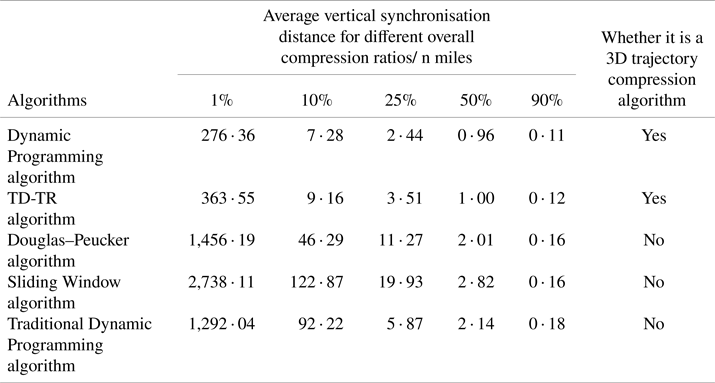
According to Figure 6, it is difficult to see the difference between the four compression algorithms in the overall compression results because of the dense ship trajectory points. However, the Dynamic Programming algorithm and TD-TR algorithm compress 3D data in longitude, latitude and time, while the Douglas–Peucker algorithm and Sliding Window algorithm compress 2D data in longitude and latitude, so there is a big difference in compression error among the four algorithms, especially, the Douglas Peucker algorithm and Sliding Window algorithm have much larger compression error. With an overall compression ratio of 1%, the average compression error and the average vertical synchronisation distance of ship trajectory based on the Dynamic Programming algorithm are the smallest among the four algorithms, with an average compression error of 7331$\,\cdot\,$ 8152 n miles and the average vertical synchronisation distance of 276$\,\cdot\,$
 3551 n miles; the average compression error based on the TD-TR algorithm is 13260$\,\cdot\,$
 1192 n miles and the average vertical synchronisation distance is 363$\,\cdot\,$
 5486 n miles; while the average compression error and average vertical synchronisation distance based on the Douglas–Peucker algorithm and Sliding Window algorithm are larger, the average compression error is 82108$\,\cdot\,$
 4115 n miles and 184321$\,\cdot\,$
 9115 n miles, and the average vertical synchronisation distance is 1456$\,\cdot\,$
 1870 n miles and 2738$\,\cdot\,$
 1090 n miles, respectively. This difference can be well reflected in the single-ship trajectory compression graph, and the single-ship trajectory compression results of different compression algorithms are shown in Figure 7.
Results of single-ship trajectory compression: (a) 3D graph of the original trajectory; (b) single-ship trajectory graph after compression by Dynamic Programming algorithm; (c) single-ship trajectory graph after compression by TD-TR algorithm; (d) single-ship trajectory graph after compression by Douglas–Peucker algorithm; (e) single-ship trajectory graph after compression by Sliding Window algorithm

3.2.2 Analysis of single ship trajectory compression results
The trajectory of ships arriving and departing from the Port of Long Beach contains a variety of encounter postures and motion states, and such a trajectory is highly representative of the experiment. Figure 7(a) shows the complete original 3D trajectory graph of a single ship arriving and departing from the Port of Long Beach, with a total of 1456 original ship trajectory points; Figure 7(b–e) shows the single ship trajectory graphs compressed by each algorithm, and the time dimension is added as the third dimension based on the 2D space of longitude and latitude. To make the experimental results more obvious after compression by each algorithm, 31 ship trajectory points are retained. That is, the compression ratio is 2$\,\cdot\,$ 13%. By comparing Figure 7(b–e), it is obvious that the single-ship trajectory graph compressed by the Dynamic Programming algorithm is more similar to that compressed by the TD-TR algorithm, and the single-ship trajectory graph compressed by the Douglas–Peucker algorithm is more similar to that compressed by the Sliding Window algorithm. In the part of ship berthing operation trajectory, the Dynamic Programming algorithm completely compresses the whole berthing operation process of the ship, keeping only the berthing and departure points. Additionally, the TD-TR algorithm still has four stopping points without compression, except for the berthing and departure points, while the compressed ship trajectory by the Douglas–Peucker algorithm and Sliding Window algorithm both produce significant distortion due to the compression of important feature trajectory points. In the approximate linear trajectory part when arriving and departing from the port, the ship still has a slight change in course, and the compressed ship trajectory by both the Dynamic Programming algorithm and TD-TR algorithm have more retention of this course change and more trajectory points. The ship trajectory compressed by both the Douglas–Peucker algorithm and Sliding Window algorithm retain less of this course change and fewer trajectory points. In the curve trajectory part, both the Dynamic Programming algorithm and TD-TR algorithm have more targeted retention of the ship's turning locations, achieving more obvious behavioural feature retention. In contrast, both the Douglas–Peucker algorithm and Sliding Window algorithm retain too many trajectory points at the ship's turning locations, and do not extract the behavioural feature points well. In terms of compression error, the compression error of ship trajectory based on the Dynamic Programming algorithm is 217$\,\cdot\,$
 4750 n miles; the compression error based on the TD-TR algorithm is 598$\,\cdot\,$
 8627 n miles; while the compression error based on the Douglas–Peucker algorithm and Sliding Window algorithm are both larger, which are 1,440$\,\cdot\,$
 9830 n miles and 4,488$\,\cdot\,$
 1683 n miles, respectively. In terms of retention of temporal information, the vertical synchronisation distance based on the Dynamic Programming algorithm is 8$\,\cdot\,$
 0186 n miles; the vertical synchronisation distance based on the TD-TR algorithm is 10$\,\cdot\,$
 9771 n miles; while the vertical synchronisation distance based on the Douglas–Peucker algorithm and Sliding Window algorithm are both larger, 22$\,\cdot\,$
 3567 n miles and 121$\,\cdot\,$
 1394 n miles, respectively.
3.2.3 Performance evaluation of different compression ratios
To compare the compression results between different algorithms more directly, 100 compressed trajectories were taken from 249 compressed trajectories and numbered 1 to 100, respectively, and the compression error graphs and vertical synchronisation distance comparison graphs of the compressed trajectories at different compression ratios were obtained.
By comparing Figure 8(a–c), it can be seen that when the overall compression ratio is 40%, 20% and 10%, the trajectory compression errors based on the Dynamic Programming algorithm and TD-TR algorithm are both mostly below 100 n miles, 500 n miles and 1000 n miles, respectively, and the difference between the trajectory compression errors based on the Dynamic Programming algorithm and TD-TR algorithm is relatively small. However, the trajectory compression errors based on the Douglas–Peucker algorithm and Sliding Window algorithm are both generally larger than those based on the Dynamic Programming algorithm or TD-TR algorithm, and the difference between the trajectory compression errors based on the Douglas–Peucker algorithm and Sliding Window algorithm is larger. By comparing Figure 9(a–c), it can be seen that when the overall compression ratio is 40%, 20% and 10%, the vertical synchronisation distances based on the Dynamic Programming algorithm and TD-TR algorithm are both generally smaller than those based on the Douglas–Peucker algorithm or Sliding Window algorithm, and this difference becomes more obvious as the compression ratio increases. This is mainly because, compared with the Dynamic Programming algorithm and TD-TR algorithm, the traditional Douglas–Peucker algorithm and Sliding Window algorithm both compress the 2D data of longitude and latitude, and cannot compress the temporal information of ship trajectory, so the trajectory compression error and vertical synchronisation distance based on the Douglas–Peucker algorithm or Sliding Window algorithm are often larger. For both Dynamic Programming and TD-TR algorithms that can compress 3D data in longitude, latitude and time, the trajectory compression error and vertical synchronisation distance based on the Dynamic Programming algorithm are generally smaller. Because the ship trajectory compression is based on the TD-TR algorithm, some of the trajectories will have a compression ratio greater than or less than the overall compression ratio, so it will lead to some of the trajectory compression errors and the vertical synchronisation distances based on the TD-TR algorithm being less than the trajectory compression errors based on the Dynamic Programming algorithm. However, the Dynamic Programming algorithm compresses the original trajectory of the ship at a specified compression ratio and the compression error is usually minimised as an optimisation algorithm.
Compression error graphs: (a) 40% overall compression; (b) 20% overall compression; (c) 10% overall compression

Vertical synchronisation distance comparison graphs: (a) 40% overall compression; (b) 20% overall compression; (c) 10% overall compression

Table 1 shows the average compression error evaluation table for the four algorithms with different overall compression ratios. Table 2 shows the evaluation table of temporal information retention for the four algorithms with different overall compression ratios. It can be seen from Tables 1 and 2 that the average compression error and the average vertical synchronisation distance of the Dynamic Programming algorithm proposed in this paper are smaller than those of other algorithms under different compression ratios, and the smaller the compression ratio, the more obvious the advantage of the Dynamic Programming algorithm. However, the average compression error and the average vertical synchronisation distance of the Douglas Peucker algorithm and Sliding Window algorithm both increase geometrically as the overall compression ratio decreases. This indicates that the Douglas–Peucker algorithm and the Sliding Window algorithm cannot preserve the temporal information of the trajectory. Additionally, compared with the TD-TR algorithm, which is also a 3D trajectory compression algorithm, the Dynamic Programming algorithm is overall better at preserving spatial and temporal information of trajectories, especially at lower compression ratios.
Evaluation of the average error for different compression ratios

Evaluation of temporal information retention for different compression ratios

3.2.4 Comparative analysis with TD-TR algorithm
To test the performance of the dynamic programming algorithm over a larger range of compression ratios and to compare it with the TD-TR algorithm, more test experiments were conducted in this paper, and the results are shown in Figures 10 and 11.
Average compression error graph

Average vertical synchronisation distance graph

Figures 10 and 11 show the average error graphs and the average vertical synchronisation distance graphs of the Dynamic Programming algorithm and the TD-TR algorithm at different compression ratios, respectively. According to the compression results, the average compression error of the Dynamic Programming algorithm proposed in this paper is always smaller than that of the TD-TR algorithm, and both of these algorithms perform similarly when the overall compression ratio is more than 40%, and the difference in error is not significant; when the overall compression ratio is less than 40%, the average compression error of both algorithms grows rapidly as the compression ratio decreases, but the average compression error of the TD-TR algorithm grows more rapidly than that of the Dynamic Programming algorithm. In terms of temporal information retention, there is no significant difference between the Dynamic Programming algorithm and the TD-TR algorithm when the overall compression ratio is greater than 30%. When the overall compression ratio is less than 30%, the Dynamic Programming algorithm has a more obvious advantage, and the lower the compression ratio, the more obvious the advantage. Therefore, it can be concluded that the Dynamic Programming algorithm proposed in this paper can always retain the spatial and temporal information of the original trajectory well, irrespective of the compression ratio, and it can also retain the temporal information better from the overall point of view.
4. Conclusion and prospect
4.1 Conclusion
In this paper, the Dynamic Programming algorithm is applied to AIS trajectory compression and better compression results are achieved, which provides a certain foundation for future research aimed at ship AIS trajectory compression. AIS data contain abundant ship behaviour characteristics data, and a large number of maritime traffic studies are centred on AIS data. However, with the explosive growth of AIS data, how to compress ship AIS data suitably has an increasing demand. At present, the research on two-dimensional spatial data compression for AIS trajectory location information is relatively mature, but rarely involves the research on more dimensions of data compression for AIS trajectory. In our research, the compression of spatio-temporal information is considered by leveraging a time-synchronised distance, meaning that it is capable of compressing data in three dimensions consisting of longitude, latitude and time. The dynamic programming algorithm can also decompose the trajectory compression problem into several subproblems according to the given compression rate and compression error index. The original trajectory compression problem is solved by obtaining the optimal solution of the subproblems so that the global error is minimised.
In this paper, we present trajectory compression experiments using AIS data near the ports of Long Beach and San Francisco in the United States. To verify the necessity of the research for the 3D ship trajectory, the Dynamic Programming algorithm is compared with the TD-TR algorithm, DP algorithm and Sliding Window algorithm. The effectiveness of the Dynamic Programming algorithm is also proved in terms of the trajectory compression result graph, compression rate and compression error. According to the experimental results, the Dynamic Programming algorithm can compress the ship AIS trajectory appropriately, and the obtained compressed trajectory can better retain the position information and temporal information of the original trajectory. Compared with the TD-TR algorithm, the compression error value of ship trajectory obtained by the Dynamic Programming algorithm is much smaller, and the performance of the dynamic programming algorithm is better as the number of retained ship trajectory points increases. Furthermore, the algorithm has good generality for ship trajectory compression. Compared with the Dynamic Programming algorithm, the Douglas–Peucker algorithm, Sliding Window algorithm and TD-TR algorithm all need to set different distance thresholds for different cases, which leads to more time and effort to test and select the appropriate thresholds. The Dynamic Programming algorithm only needs to set the compression ratio to compress the trajectory, which simplifies the operation process.
4.2 Prospect
However, there is a shortcoming in the research presented in this paper: the Dynamic Programming algorithm has a high time complexity. This means that compared with the other three algorithms used in the experiment, the Dynamic Programming algorithm's compression processing efficiency is lower. In future research, the complexity of the algorithm can be reduced by improving the Dynamic Programming algorithm, thus reducing the processing time of trajectory compression and further advancing the application of the algorithm in practice.
Acknowledgement
The authors greatly appreciate the work of data processing and language help done by researchers from Wuhan University of Technology, Arizona State University and Environmental Systems Research Institute.
Funding
This work was financially supported by National Key R&D Program of China (grant number 2023YFB4302300) and Construction and Cultivation Project of State Research (grant number 104972024KFYd0030).