INTRODUCTION
Lipids are an important component of food due to their high energy value and due to the presence of fat-soluble vitamins and fatty acids. The essential elements of each group of lipids responsible for creating biological membranes as the structural material of complex lipids, such as phospholipids and glycolipids, are fatty acids (Kersten, Reference Kersten2001). Polyunsaturated fatty acids, also called essential unsaturated fatty acids (EFA), are necessary for an organism's metabolism. However, they cannot be synthesized by most organisms but only collected from food (Holub, Reference Holub2002). They have an important role in organisms such as insects (Gołębiowski et al., Reference Gołębiowski, Boguś, Paszkiewicz, Wieloch, Włóka and Stepnowski2012) and marine organisms (Mika et al., Reference Mika, Gołębiowski, Skorkowski and Stepnowski2012) as well as in mammals (Green et al., Reference Green, Martinez-Coria, Khashwji, Hall, Yurko-Mauro, Ellis and LaFerla2007) and in human tissue (Holub, Reference Holub2002).
Fatty acid biosynthesis occurs mainly in the liver and adipose tissue (Jansen et al., Reference Jansen, Hutchison and Zanetti1968). It is stimulated by a high carbohydrate diet. It is interesting to note that lipogenesis is inhibited by an excess of polyunsaturated fatty acids and by fasting (Hellerstein, Reference Hellerstein1999; Kersten, Reference Kersten2001). Lipogenesis enzymes are located in the cytosol, and the chain elongation system itself is located in the endoplasmic reticulum of hepatocytes. Receipt of fatty acids longer than C16:0 (palmitic acid) is possible due to the extramitochondrial system of elongases of fatty acids (Torkko, Reference Torkko2003). Subsequent steps in elongation and desaturation lead to the formation of unsaturated fatty acids, including arachidonic acid 20:4(Ω-6) (ARA), which belongs to the (Ω-6) family and is the precursor of eicosanoids and the fatty acids eicosapentaenoic acid (EPA, 20:5(Ω-3)) and docosahexaenoic acid (DHA, 22:6(Ω-3)). These acids belong to the (Ω-3) family and compete for the same enzymes in the metabolic pathway as (Ω-6) (Holub, Reference Holub2002). They are called essential fatty acids (EFA) and must be supplied in the diet if it is not possible for the organism to synthesize them, because of their importance as the basic compounds of metabolism. The ratio of (Ω-3) and (Ω-6) in the diet depends on the ratio of α-linolenic acid (ALA, 18:3(Ω-3)) to linoleic acid (LNA, 18:2(Ω-6)) inside the cells (Dall et al., 1992).
Shrimp oils are rich in polyunsaturated fatty acids. However, the fatty acid composition (FA) as well as quantity and content of unsaturated fatty acids are dependent on many factors (Styrishave & Anserson, Reference Styrishave and Anderson2000; Dutra et al., Reference Dutra, Zank, da Silva, Conter and Oliveira2008). The main reason for changes in the composition of FA, as reported by many authors, is the availability of food (Maazouzi et al., Reference Maazouzi, Masson, Izquierdo and Pihan2007).
The research organism, the brown shrimp, Crangon crangon, is the major predator in shallow marine ecosystems—mostly of juvenile fish—and is food for larger fish. This benthic organism, together with Carcinus maenas, constitutes 90% of macro-crustaceans in shallow marine ecosystems (Selleslagh & Amara, Reference Selleslagh and Amara2008). Furthermore, the muscles, heads and shells of C. crangon are rich in protein, calcium, vitamins, flavonoids, natural antioxidants and saturated and unsaturated fatty acids (Heu et al., Reference Heu, Kim and Shahidi2003). Crangon crangon have been the subject of several studies. Their energy value has been determined (Szaniawska, Reference Szaniawska1983), and their growth phenology and the population dynamics of their life cycle (Viegas et al., Reference Viegas, Marques, Bessa, Primo, Martinho, Azeiteiro and amd Pardal2012) has been studied. The distribution range of C. crangon is connected with the phylogeography of this benthic taxon (Luttikhuizen et al., Reference Luttikhuizen, Campos, van Bleijswijk, Peijnenburg and van der Veer2008). However, there is no information about the chemical composition—specifically about the lipid composition and fatty acids profile in abdominal muscle.
The aim of this study was to determine the seasonal variations of lipids in the muscle tissue of adult C. crangon; specifically the content and composition of fatty acids during the year.
Abbreviations
- ARA,
arachidonic fatty acid (20:4(Ω-6))
- ALA,
α-linolenic acid
- EFA,
essential fatty acid
- EPA,
eicosapentaenoic fatty acid (20:5(Ω-3))
- DHA,
docosahexaenoic fatty acid (22:6(Ω-3))
- FFA,
free fatty acid
- HPLC-LLSD,
high performance liquid chromatography with a laser light-scattering detector
- GC-MS,
gas chromatography-mass spectrometry
- LN,
neutral lipids
- LNA,
linoleic acid
- MUFA,
monounsaturated fatty acid
- PL,
phospholipids
- PUFA,
polyunsaturated fatty acid
- PUFA(Ω-6),
polyunsaturated fatty acid omega-6
- PUFA(Ω-3),
polyunsaturated fatty acid omega-3
- TAG,
triacylglycerols
- TIC,
total ion current
- tFAs,
fatty acids of triacylglycerols
- pFAs,
fatty acids of polar lipids
- fFAs,
fatty acids of free fatty acids
- PL,
polar lipids
- SAFA,
saturated fatty acid
- ST,
sterols
- FAs,
total fatty acids, including TAG, FFA and PL.
MATERIALS AND METHODS
Biological material
Brown shrimps were caught off the coastal area of the Gulf of Gdansk near Sobieszewo Island (54°35′88′′N 18°83'16″E) between October 2011 and August 2012 using bottom trawl. Samples were collected four times in each season (autumn: 10 October–1 November, winter: 22 December–15 January, spring: 6 April–3 May, summer: 9 July–2 August). A total of 50 adults of C. crangon (N = 50) were caught each season, and used to determine the change in the lipid composition of muscle. The C. crangon were transported after collection to the laboratory for analyses, the adults were separated from other stages and were identified, sexed, measured, recorded and decapitated shortly after collection. Only non-ovigerous adult organisms were used for the analysis. Their abdominal muscles were dissected, separated from the cuticles and frozen at –80°C in glass tubes. The average body length of the C. crangon was 50 ±0.5 mm. The shrimps were collected from a depth of between 80 and 100 m. The average seawater temperature during fishing for the shrimps was 6 ±1.2°C, 4 ±0.5°C, 8 ±0.9°C and 13 ±1.1°C in autumn, winter, spring and summer, respectively. The average salinity of the fishing area was 7.15 ± 0.16 psu, 7.21 ± 0.14 psu, 6.93 ± 0.25 psu and 7.24 ± 0.19 psu, respectively.
Chemicals and reagents
Methanol, chloroform, dichloromethane, n-hexane (all HPLC grade) were obtained from Chempur (Piekary Śląskie, Poland) and NaCl (0.9%) from Fresenius Kabi (Kutno, Poland). KOH was purchased from POCH S.A. The saturated branched-chain fatty acid 19-methyl-eicosanoate was the internal standard, with 10% BF3 in methanol, and both were obtained from Sigma-Aldrich (Poznań, Poland).
Statistical analysis
To determine the variability of results, they were compared with the Student's t-test and were significant at P < 0.05. The number of individual measurements was 5 (N = 5). The data are expressed as means ±standard error (SE). The internal standard was 19-methyl-eicosanoate. Two-way ANOVA was used to determine if one season was different from another season in particular fractions, and Tukey's post hoc test used for further determination of the significance of differences. All statistical analyses were generated using Open Office 3.3.0 with OOoStat (Statistics Macros for OpenOffice) - V.0.5. Differences were considered statistically significant when P < 0.05.
Sample preparation
The abdominal muscles were weighed and before homogenization of the lipids, water was removed from the examined tissues by lyophilization. The abdominal muscles of brown shrimp were extracted in a mixture of chloroform–methanol by the Folch method (Folch et al., Reference Folch, Lees and Sloane Stanley1957) and the extracts were dried by evaporation under a stream of nitrogen. The lipid extracts were frozen at –20°C in glass tubes until the time of separation into lipid classes. Depending on the season, the weight of the lipids from one shrimp varied from 1.8 to 5.6 mg.
Lipid class analysis
The lipid extract was separated into classes of compounds using high performance liquid chromatography with a laser light scattering detector (HPLC-LLSD) and a normal-phase 250 × 4.6 mm analytical column packed with Econosil Silica (Alltech, particle size 5 µm). The mobile phase consisted of n-hexane (Solvent A) and dichloromethane containing 15% acetone (Solvent B). The gradient was programmed linearly from A to B within 35 min.
Triacylglycerols (TAGs), free fatty acids (FFAs) and phospholipids (PLs) were separated using HPLC-LLSD and were transformed in fatty acid methyl esters (modification of the Ichihara & Fukubayashi (Reference Ichihara and Fukubayashi2010) method). TAGs and PLs were initially subjected to hydrolysis. 1 ml of 0.5 M KOH in methanol was added and the samples were incubated at 90°C for 3 h. 1 ml of deionized water was added and after that 1 ml of n-hexane was added. The samples were washed three times with water-n-hexane, and the n-hexane phase was evaporated to dryness under a stream of nitrogen. Finally, 1 ml of 10% BF3 in methanol was added and the samples were incubated at 55°C for 1.5 h. Next, 1 ml of deionized water was added and the samples were washed three times with n-hexane. The n-hexane extracts were evaporated to dryness under a stream of nitrogen. The prepared samples were frozen at –20°C until analysis by GC-MS. The free fatty acid sample was methylated with only 1 ml of 10% BF3 in methanol, and the rest of the procedure was repeated.
Fatty acid methyl esters from triacylglycerols, free fatty acids and phospholipids were analysed by using GC-MS on a QP-2010 SE (SIMADZU) equipment, with the fused silica capillary column HP-5, 30 m × 0.25 mm i.d., and with a film 0.25 µm thick. The GC was programmed from 60°C to 300°C at a rate of 4°C min−1, with helium carrier gas at a column head pressure of 60 kPa.
The fatty acid composition among all of the fractions that could have in their structure acidic components (such as triacylglycerols, free fatty acids and polar lipids—phospholipids) was included in one named group—fatty acids (FAs).
RESULTS
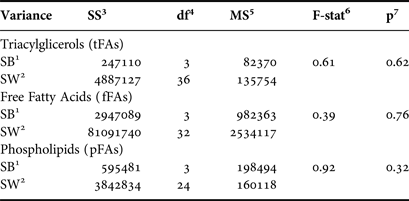
Table 1 presents two types of variances: between and within samples. Null hypothesis (H0) is true, when the within-sample variance and the between-sample variance are about the same. If P > 0.05 and Fstat < F-table, we assume that the null hypothesis is true. The results of variances were different in particular fractions of fatty acids. The p-value was 0.62 for tFAs, 0.76 for fFAs and 0.32 for pFAs (Table 1). FAs group were different between and within samples only in respect of domination of particular components (Tables 2–4). Differences were independent of season and the Tukey's post hoc test was used for determination of significant differences among means within each FAs group in seasons. The lack of significant differences among TAG, FFA and PL fractions in FA means in different seasons was observed. Only free fatty acids fraction in spring time had higher value of q-value from the Tukey's post hoc test than Q (critical values for Tukey's HSD).
Results of two-way ANOVA comparing concentrations of fatty acids in the muscle of Crangon crangon, from four different seasons. Differences were considered statistically significant when P < 0.05.

1SB, variance between samples; 2SW, variance within samples; 3SS, sum of squares of the effect; 4df, degrees of freedom; 5MS, mean square (SS df−1); 6F-stat, F-statistics; 7p, P-value.
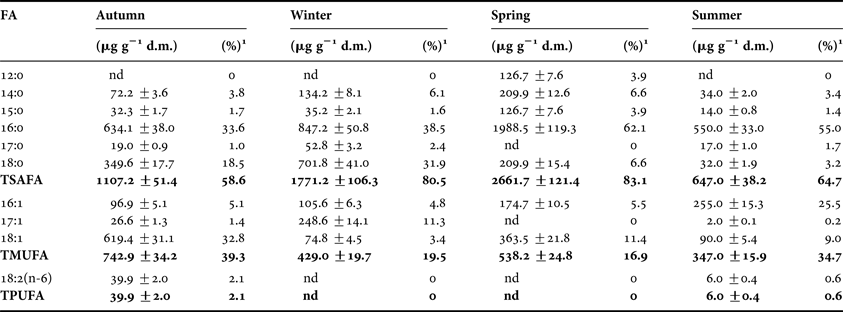
Concentrations of individual fatty acids mean ± SE, identified in the triacylglicerols fraction in the muscle of Crangon crangon during four seasons (µg g−1 d.m.) and the percentage value. The number of GC-MS measurements was 5 (N = 5) and the number of C. crangon muscles were 50 (N = 50). nd, not detected.
1, percentage of fatty acids in the total content of FAs.
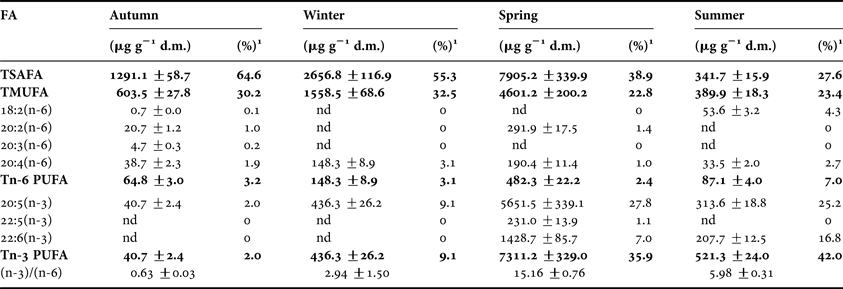
Concentrations of polyunsaturated (Ω-3) and (Ω-6) fatty acids mean ± SE, identified in the free fatty acids fraction in the muscle of Crangon crangon during four seasons (µg g−1 d.m.) and the percentage value. The number of GC-MS measurements was 5 (N = 5) and the number of C. crangon muscles were 50 (N = 50). nd, not detected.
1, percentage of fatty acids in the total content of FAs.
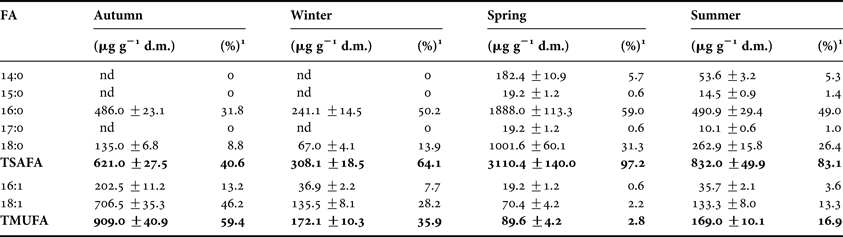
Concentrations of individual fatty acids mean ± SE, identified in the polar lipids fraction in the muscle of Crangon crangon during four seasons (µg g−1 d.m.) and the percentage value. The number of GC-MS measurements was 5 (N = 5) and the number of C. crangon muscles were 50 (N = 50). nd, not detected.
1, percentage of fatty acids in the total content of FAs.
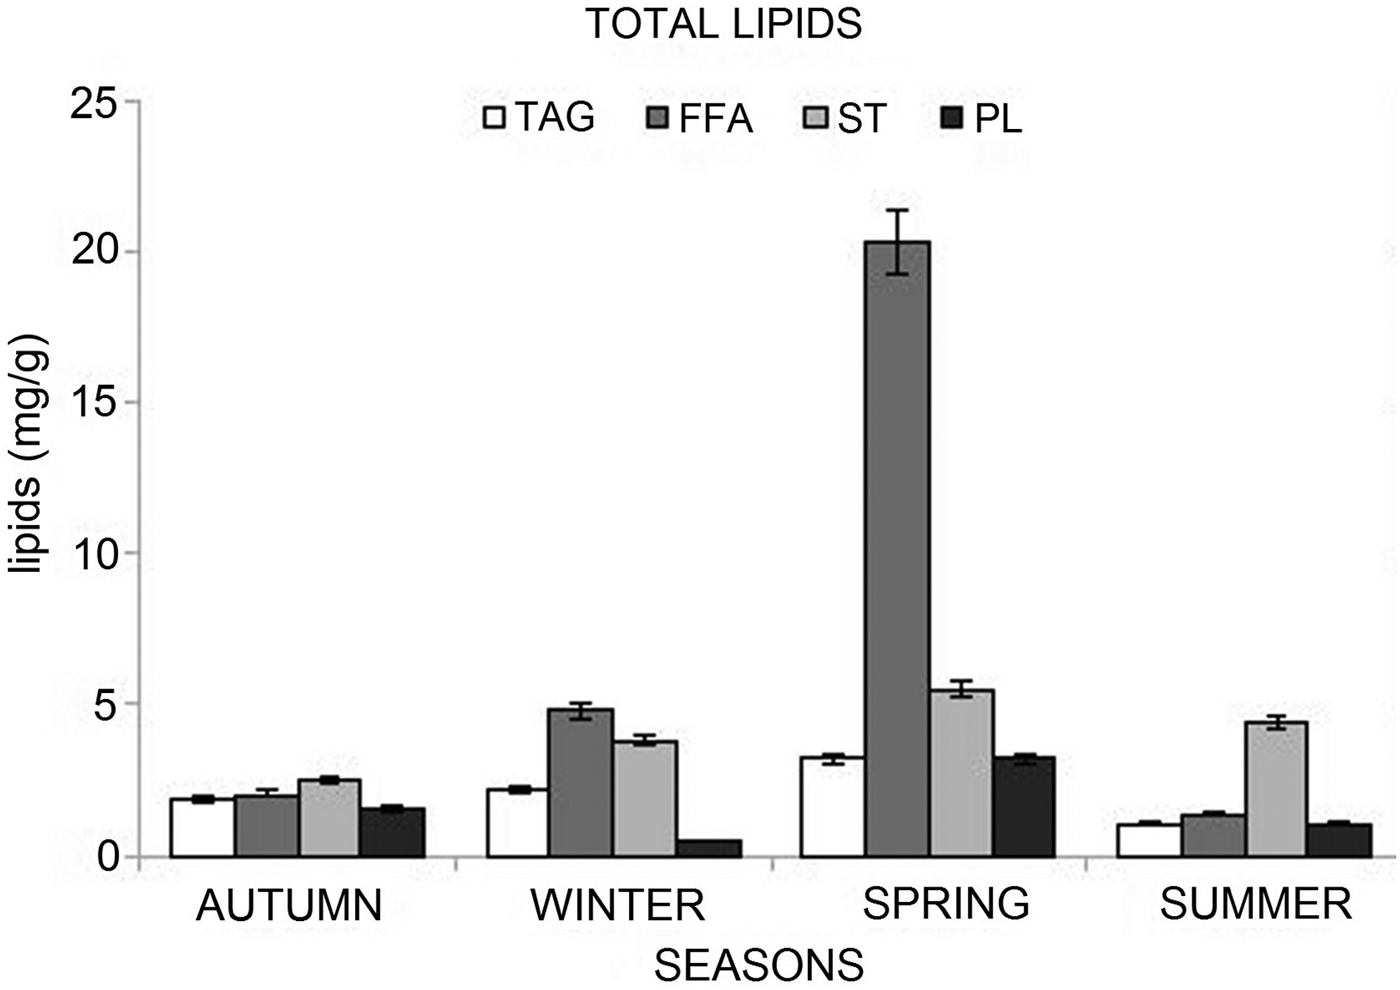
Figure 1 shows the seasonal changes in the lipid groups which were detected by HPLC-LLSD. Major muscle mass was noted in spring (489.3 ±29.2 mg), the mass then decreased in the next season (summer: 320.0 ±32.5 mg) until autumn (293.1 ±30.5 mg), when growth was recorded, and in winter the muscle mass was 396.1 ±42.4 mg. The muscle lipid content was 7.9 ±0.4 mg g−1 in autumn, 11.3 ±0.6 mg g−1 in winter, 32.2 ±1.8 mg g−1 in spring and 7.7 ±0.4 mg g−1 (dry mass) in the summer season (Figure 1).
Seasonal levels of lipids in muscle of Crangon crangon, separated by HPLC-LLSD. TAG, triacylglycerols, FFA, free fatty acids, ST, sterols, PL, polar lipids (phospholipids).
Twenty-five fatty acids were identified. The muscle contents of saturated fatty acids (SAFAs), monounsaturated FAs (MUFAs) and polyunsaturated (Ω-6) and (Ω-3) fatty acids (PUFAs) in relation to the season are presented in Tables 2–4. The results are expressed as mg g−1 of dry mass and as a percentage.
Among the saturated fatty acids in the TAG fractions with respect to the season, the highest value was detected for myristic (14:0), palmitic (16:0) and stearic acid (18:0). It was 209.9 ±12.6 µg g−1 and 1988.5 ±119.3 µg g−1 for 14:0 and 16:0 (in spring), respectively, and 701.8 ± 41.0 µg g−1 for 18:0 (during the winter, Table 2). The total SAFAs showed a mean of about 60% in autumn and summer and 80% in winter and spring (Table 2). MUFAs were noted in a smaller amount, and tFA class acids dominated: oleic 18:1 (619.4 ±31.1 µg g−1 in autumn), palmitoleic acid 16:1 (255.0 ±15.3 µg g−1 in summer) and 17:1 (248.6 ±14.1 µg g−1 in the winter time – the value was mostly comparable to acid 16:1 in the summer time). Polyunsaturated (Ω-3) fatty acids were not detected and the only representative of the PUFA (Ω-6) family was linoleic acid. A value of 18:2(Ω-6) was in the summer season 6.0 ±0.4 µg g−1 (0.6% of total content of FAs) and 39.9 ±2.0 µg g−1 in autumn (2.1%) (Table 2).
The other saturated fatty acids 20:0, 22:0 and 24:0 were identified below 10 µg g−1. Similarly, polyunsaturated (Ω3 = the lack of) fatty acids, (Ω-6) acids, and amongst them arachidonic 20:4(Ω-6) were identified in winter and spring.
Table 3 shows the free fatty acid fractions in different seasons. Among these fractions many PUFAs were identified, and other acid classes, such as SAFAs and MUFAs, are shown as the total content in the fFA profile. The content of SAFAs was only aabout 40% in spring and 30% in summer, significant differences to the TAG fraction (Tables 2, 3). In spring, the dominant saturated fatty acids were: 16:0 (5651.1 ±339.1 µg g−1) and 18:0 (1043.0 ±62.6 µg g−1). A difference was the presence of acids 20:0 (88.9 ±5.3 µg g−1), 22:0 (68.6 ±4.1 µg g−1) and 24:0 (68.6 ±4.1 µg g−1). These acids were also present in the other seasons. Monounsaturated acids: 16:1 (1205.4 ±72.3 µg g−1) and 18:1 (2646.7 ±158.8 µg g−1) also predominated in the spring season. During the same season and in autumn, 20:1, 22:1 and 24:1 acids were identified. Their contents increased from autumn to spring. MUFAs percentage ranged from 22.8% in spring to 32.5% in winter. PUFAs (Ω-3) and (Ω-6) were noted in the FFA fraction (Table 3). (Ω-6) contents predominated in spring, but only acids 20:2(Ω-6) and 20:4(Ω-6) were detected. On the other hand, the autumn, despite the small values for the acids, was characterized by the highest diversity, but only in (Ω-6) fFAs. From the second family of PUFAs (Ω-3), only acid 20:5 occurred. The other seasons were characterized mainly by the presence of EPA, DHA and ARA. Acid 20:5(Ω-3) dominated in spring (27.8%), 22:6(Ω-3) in summer (16.8%) and the highest value of acid 20:4(Ω-6) was noted in winter (3.1%) (Table 3).
The polar lipid fraction was the poorest, both in quantity and diversity of fatty acids (Table 4). However, the value of SAFAs in the spring and summer was higher than in the TAG fraction, and it was 97.2% in spring and 83.1% in summer. The contents were 3110.4 ±140.0 µg g−1 and 832.0 ±49.9 µg g−1 in the PL fraction in spring and summer, respectively, and 2661.7 ±121.4 µg g−1 and 647.0 ±38.2 µg g−1 in the TAG fraction (Tables 2, 4). MAFAs dominated in autumn (59.4%) and this value was the highest in all analysed FAs fractions. Polyunsaturated fatty acids in the polar lipid fraction were detected in very small amounts, thus they are not included in Table 4.
The number and distribution of FAs in successive seasons (Tables 2–4) is consistent with Figure 1, which presents the amount of FAs in each group. The greatest amount of FAs was recorded in spring, and after a decline in summer an increase in the value of FAs was observed in the winter. Overall conclusions can already be drawn from Figure 1, but because the lipids were split into factions, it was decided that each case should be discussed individually.
DISCUSSION
Changes in the FA profile are largely caused by growth and maturation (Campos et al., Reference Campos, Freitas, Pedrosa, Guillot and van der Veer2009a). The diversity of lipids also depends on food availability, temperature, salinity, the photoperiod and the level of oxygen in the water (Dutra et al., Reference Dutra, Zank, da Silva, Conter and Oliveira2008). Crangon crangon is an euryhaline taxon which lives in a salinity close to 0–35 psu (Holthuis, Reference Holthuis1980). Brown shrimp occur not only in the Baltic Sea, but also in the eastern Atlantic, on the Atlantic coast of Morocco, in the Mediterranean and the Black Seas (Holthuis, Reference Holthuis1980). The temperature distribution determines the development of C. crangon. This organism tolerates temperatures from 5°C to 25°C. While adult shrimp can be found in temperatures above 30°C, a temperature of 6°C favours egg development (Campos & van der Veer, Reference Campos and van der Veer2008). Temperature and salinity have an influence on the length and weight of brown shrimp (Campos et al., Reference Campos, Van der Veer, Freitas and Kooijman2009b), on which the amount of lipids depend. In the Gulf of Gdansk the water temperature does not exceed 23°C in late summer and salinity is only 7.5 psu. Therefore, in these conditions brown shrimp are only 50 mm in length, although they can reach 95 mm in length in other regions (Campos et al., Reference Campos, Freitas, Pedrosa, Guillot and van der Veer2009a). Despite this fact, according to Campos et al. (Reference Campos, Bio, Cardoso, Dapper, Witte and van der Veer2010) in the spring season the highest total mass of lipids and diversity and richness of the FA profile was recorded (Table 2). These results are consistent with the cycle of reproduction (Campos et al., Reference Campos, Bio, Cardoso, Dapper, Witte and van der Veer2010) and the storage of nutrition (Cuzon et al., Reference Cuzon, Lawrence, Gaxiola, Rosas and Guillaume2004). In our study, after the summer season, the content of lipids increased. According to Styrishave & Andersen (Reference Styrishave and Anderson2000), the accumulation of FAs from the autumn season is caused by a replenishment of energy which will be used during the migration of the organisms and the lack of food in the winter. In turn, the lower level of FAs observed in the summer season is a result of the use of FAs during the reproductive period (Styrishave & Andersen, Reference Styrishave and Anderson2000).
The analysis of fatty acid fractions showed that the richest group of FAs were free fatty acids, and that the content of the TAGs and PLs was very similar, except in winter (Figure 1). The dominance of FFAs over TAGs was also observed by Valverde et al. (Reference Valverde, Hernández, García-Garrido, Rodríguez, Estefanell, Gairín, Rodríguez, Tomás and García2012) and Perez-Velazquez et al. (Reference Perez-Velazquez, Gonzalez-Felix, Lawrence and Gatlin III2003) in the muscle of Penaeus sp. and shrimp Litopenaeus vannamei, respectively. In their studies, increased levels of free fatty acids were noted in non-fed shrimp. These authors suggested that this situation could be the result of catabolism of triacylglycerols and polar lipids (Perez-Velazquez et al., Reference Perez-Velazquez, Gonzalez-Felix, Lawrence and Gatlin III2003) because the PLs in our study were at significantly lower levels than in other research studies (Perez-Velazquez et al., Reference Perez-Velazquez, Gonzalez-Felix, Lawrence and Gatlin III2003; Valverde et al., Reference Valverde, Hernández, García-Garrido, Rodríguez, Estefanell, Gairín, Rodríguez, Tomás and García2012). The fluctuations of levels of lipid fractions, mainly PLs, are a result of the food deficiency during maturation (Cavalli et al., Reference Cavalli, Tamtin, Lavens and Sorgeloos2001) and the PLs low value in dietary lipid (Valverde et al., Reference Valverde, Hernández, García-Garrido, Rodríguez, Estefanell, Gairín, Rodríguez, Tomás and García2012). What is important is that the content of phospholipids is the individual feature of a particular taxon. Crustaceans which live in a much more saline environment have high levels of polar lipids which, in turn, affect positively survival rates and tolerance to changes in salinity (Maazouzi et al., Reference Maazouzi, Masson, Izquierdo and Pihan2007). Polar lipids are more easily emulsified, thus they are a better source of energy than neutral lipids, such as FFAs or TAGs, in these environmental conditions (Limbourn & Nichols, Reference Limbourn and Nichols2009). They are also used for ovary development (Cuzon et al., Reference Cuzon, Lawrence, Gaxiola, Rosas and Guillaume2004). These conditions can explain low PL contents during the annual cycle. The next reason for FFA dominance in shrimp muscle is the moulting period, when the free fatty acid fraction dominates over the TAGs fraction (Chandumpai et al., Reference Chandumpai, Dall and Smith1991). The increase in temperature after the winter period stimulates the moulting of C. crangon (Campos et al., Reference Campos, Van der Veer, Freitas and Kooijman2009b).
Access and utilization of nutrients affect the quantity and composition of FAs, thus there is a small fluctuation of FAs and the lack of certain PUFAs in particular fractions (Perez-Velazquez et al., Reference Perez-Velazquez, Gonzalez-Felix, Lawrence and Gatlin III2003). Moreover, there is an inverse correlation between levels of polyunsaturated and saturated fatty acids (Rasoarahona et al., Reference Rasoarahona, Barnathan, Bianchini and Gaydou2005). A higher level of PUFAs is correlated with a lower level of SAFAs (Table 3). Among the PUFAs (Ω-3), the lack of α-linolenic 18:3(Ω-3) acid was detected. This acid is derived from the food source. Lack of 18:3(Ω-3) can be due to competition with 18:2(Ω-6) for the same digestive enzymes, and ALA can also be a dietary source of some metabolically derived EPA and DHA (Holub, Reference Holub2002). Moreover, this may be caused by salinity—the Baltic Sea is not very salty, thus very low amounts of this acid occur there. Larger values of ALA than LNA are listed just in marine organisms (Mura et al., Reference Mura, Vananzi, Avalle and Quaglia1994). According to Castell (Reference Castell, Pruder, Langdon and Conklin1983) and Chanmugam et al. (Reference Chanmugam, Donovan, Wheeler and Hwang1983) freshwater crustaceans accumulate in their tissues the larger amounts of acid 18:2(Ω-6). High concentration of PUFA (Ω-3) in the organisms influences the survival and the tolerance on changes of salinity. The presence of these acids modifies the permeability of the cell membrane and shapes activity of the Na–K pump as an essential osmoregulatory mechanism (Maazouzi et al., Reference Maazouzi, Masson, Izquierdo and Pihan2007). The very low values of 18:3(Ω-3) were also noted by D'Abramo (Reference D'Abramo1989) and Mura et al. (Reference Mura, Vananzi, Avalle and Quaglia1994) in freshwater and brackish shrimps. The increase of acid 18:2(Ω-6), which is a typical plant acid, is often attributed to the collection of large amounts of marine algae and phytoplankton (Ahlgren et al., Reference Ahlgren, Goedkoop, Markensten, Sonesten and Boberg1997; Rossi et al., Reference Rossi, Youngbluth, Jacoby, Pagès and Garrofè2008; Bono et al., Reference Bono, Gai, Peiretti, Badalucco, Brugiapaglia, Siragusa and Palmegiano2012). Another reason for the absence of 18:3(Ω-3) may be the presence of high values of linoleic acid 18:2(Ω-6). These acids belong to two competing families of (Ω-3) and (Ω-6) for the same enzymes in the metabolic cycle (Holub, Reference Holub2002). What is more, the ratio of 18:2(Ω-6) to 18:3(Ω-3) can reach about 20:1 (Simopoulos, Reference Simopoulos2008). Therefore, the amount of fatty acids 20:4(Ω-6) and 20:5(Ω-3) is essential. Each season is dominated by acids 18:0, 18:1, 16:0, 16:1, 20:4, 20:5 and 22:6, which, if identified, are there in large quantities (Tables 2–4). This predominant fatty acid profile is described by Perez-Velazquez et al. (Reference Perez-Velazquez, Gonzalez-Felix, Lawrence and Gatlin III2003) in the muscles of Litopenaeus vannamei, by Kasai & Sakai (Reference Kasai and Sakai2004) in Pandalus kessleri, by Mura et al. (Reference Mura, Vananzi, Avalle and Quaglia1994) in Chirocephalus diaphanus and C. kerkyrensis, by Bragagnolo & Ridriguez-Amaya (Reference Bragagnolo and Rodriguez-Amaya2001) in Macrobrachium rosenbergii, Penaeus brasiliensis, Penaeus schmitti and Xiphopenaeus kroyeri, by Nisa & Asadullah (Reference Nisa and Asadullah2006) in Fenneropenaeus merguiensis and Fenneropenaeus penicillatus, by Bono et al. (Reference Bono, Gai, Peiretti, Badalucco, Brugiapaglia, Siragusa and Palmegiano2012) in Aristaeomorpha foliacea and by Jeffs et al. (Reference Jeffs, Nichols and Bruce2001), Limbourn and Nichols (Reference Limbourn and Nichols2009), Phleger et al. (Reference Phleger, Nelson, Mooney and Nichols2002), Styrishave & Andersen (2002), Maazouzi et al. (Reference Maazouzi, Masson, Izquierdo and Pihan2007), Dutra et al. (Reference Dutra, Zank, da Silva, Conter and Oliveira2008) and Çelik et al. (Reference Çelik, Türeli, Çelik, Yanar, Erdem and Küçükgülmez2004) in other crustaceans, including other krill, amphipods, crayfish and lobster species. The highest value of 20:5(Ω-3) and 22:6(Ω-3) occurs during the spring because they are needed for the moulting cycle, growth, survival and sexual maturation at the larval stage (Cordier et al., Reference Cordier, Brichon, Weber and Zwingelstein2002; Kasai & Sakai, Reference Kasai and Sakai2004). 20:5(Ω-3) is a precursor of 22:6(Ω-3), which keeps the fluidity of the membrane and its plasticity (Rasoarahona et al., Reference Rasoarahona, Barnathan, Bianchini and Gaydou2005). In fish, 22:6(Ω-3) functions in the neural tissue (Tocher, Reference Tocher2003). Acid 20:4(Ω-6) is responsible for the production of signaling molecules (Copeman et al., Reference Copeman, Parrish, Brown and Harel2002). Many crustaceans have lower levels of 20:4(Ω-6) in relation to 20:5(Ω-3) (Limbourn & Nichols, Reference Limbourn and Nichols2009), which is shown in this study. Moreover, the higher value of 20:4 (Ω-6) in winter and spring is caused by the increase in this acid in the cold season and its decrease in the warm (Bottino et al., Reference Bottino, Gennity, Lilly, Simmons and Finne1980). The (Ω-3):(Ω-6) ratio is the lowest in autumn (0.63 ±0.03) and increases in the winter season (2.94 ±1.50). The highest value of the ratio is in spring (15.16 ±0.76) and the next decrease was noted during the summer (5.98 ±0.31) (Table 3). Rasoarahona et al. (Reference Rasoarahona, Barnathan, Bianchini and Gaydou2005) who studied the seasonal variability of the lipid and fatty acid profile of three tilapia species, also observed this phenomenon. The (Ω-3):(Ω-6) ratio is lowest in autumn and increases in the winter (Limbourn & Nichols, Reference Limbourn and Nichols2009). Similarly, Çelik et al. (Reference Çelik, Türeli, Çelik, Yanar, Erdem and Küçükgülmez2004) observed low values of the (Ω-3):(Ω-6) ratio during winter; the value of (Ω-3):(Ω-6) was 3.18 (Çelik et al., Reference Çelik, Türeli, Çelik, Yanar, Erdem and Küçükgülmez2004). According to Ouraji et al. (Reference Ouraji, Shabanpour, Kenari, Shabani, Nezami, Sudagar and Faghani2009) and Bragagnolo & Rodriguez-Amaya, (Reference Bragagnolo and Rodriguez-Amaya2001) low levels of this ratio depend on type of diet, and the authors also noted low values in the muscle of Fenneropenaeus indicus and freshwater and wild marine shrimps (Bragagnolo & Rodriguez-Amaya, Reference Bragagnolo and Rodriguez-Amaya2001; Ouraji et al., Reference Ouraji, Shabanpour, Kenari, Shabani, Nezami, Sudagar and Faghani2009). On the other hand Bono et al. (Reference Bono, Gai, Peiretti, Badalucco, Brugiapaglia, Siragusa and Palmegiano2012) noted also the highest (Ω-3):(Ω-6) ratio in PUFA from muscle of Aristaeomorpha foliacea during the spring. The high value of (Ω-3) fatty acids contributes to the high nutritional value of shrimps. They are also the good source of protein, and very low in calories (Bono et al., Reference Bono, Gai, Peiretti, Badalucco, Brugiapaglia, Siragusa and Palmegiano2012). Depending on the latitude, temperature and salinity, the authors reported other seasons of reproduction and development, characteristic of the development of brown shrimp (Luttikhuizen et al., Reference Luttikhuizen, Campos, van Bleijswijk, Peijnenburg and van der Veer2008; Campos et al., Reference Campos, Van der Veer, Freitas and Kooijman2009b; Viegas et al., Reference Viegas, Marques, Bessa, Primo, Martinho, Azeiteiro and amd Pardal2012). Campos et al. (Reference Campos, Van der Veer, Freitas and Kooijman2009b) reported that, for northern areas, the process of reproduction occurs in spring and at the turn of summer and autumn, thus denying any information about reproduction during autumn (Campos et al., Reference Campos, Van der Veer, Freitas and Kooijman2009b). In our observations on the brown shrimp caught during the autumn and winter seasons, only adults and shrimp in stages of the late juvenile period were found (Mika, personal observation). The presence of C. crangon adults is explained by a lower temperature in the cold periods and the adaptation of C. crangon to rapid growth at this time (Kooijman, Reference Kooijman2000; Campos et al., Reference Campos, Van der Veer, Freitas and Kooijman2009b), because smaller shrimp have fewer energy reserves (Kooijman, Reference Kooijman2000). As reported by Selleslagh & Amara, (Reference Selleslagh and Amara2008) C. crangon is one of the main prey for juvenile flounder (Platichtys flesus) and plaice (Pleuronectes platessa). Spawning and development of flounder and plaice overlap with an increase in the lipid values of C. crangon (Rijnsdorp, Reference Rijnsdorp1989; Florin & Höglund, Reference Florin and Höglund2008). This is probably an additionally reason for the increased quantity and diversity of the FAs during spring.
On the basis of the analysed seasonal changes, the different composition and fatty acid profile, decrease in FAs in different seasons and the physiological factors that occur in the organisms, the greatest amount of FAs was found to be reported in spring. This was caused by the food collection that had taken place during the winter and its accumulation in the process of reproduction and larval development. Also, temperature and salinity were of great importance in the composition of each fraction and profile of the FAs. Various conditions have high influence on the concentration and content of lipid fractions and fatty acids in the annual cycle and individual seasons. However, statistical analysis indicates that variable seasons are not statistically different, and all analysed samples descended from one general population. Different values of Fstat for particular fatty acid fractions is the result of various identified components. The higher number of FA induces the smaller value of Fstat (Table 1). The Tukey's post hoc test showed the lack of significant differences between means of FA groups in any season. Significant differences between means of FA groups and FFA fractions appeared only during spring. In winter triacylglycerols and phospholipids are quickly catabolized, and free forms of FAs from TAG and PL fraction are included in the FFA fraction (Perez-Velazquez et al., Reference Perez-Velazquez, Gonzalez-Felix, Lawrence and Gatlin III2003; Senphan & Benjakul, Reference Senphan and Benjakul2012).
CONCLUSIONS
For the first time the lipid content of the abdominal muscle of adult C. crangon over an annual cycle has been determined. The lipids in the abdominal muscle of Crangon crangon are mainly composed of neutral lipids. The main constituent fatty acids in TAGs and FFAs were 16:0, 16:1, 18:0, 18:1, 20:4(Ω-6), 20:5(Ω-3) and 22:6(Ω-3). The largest amounts of fatty acids in the muscle of C. crangon were observed in the spring, as the result of the collection of food after winter. The decrease in the FA composition was associated with reproduction, which lasts from May to October. Many seasonal factors can impact of FAs composition in marine organisms; a smaller organism such as brown shrimp is more susceptible to the fluctuations of climatic conditions and the physical–chemical environment.
FINANCIAL SUPPORT
Financial support was provided by the Ministry of Science and Higher Education for DS/530-8110-D-195-13.