



Introduction
The significance of water as a fundamental resource extends beyond mere survival, playing a pivotal role in societal and economic development and acting as a linchpin for human well-being and prosperity (Horton & Horton Reference Horton and Horton2019, Rusu et al. Reference Rusu, Mihăiescu, Odagiu and Paulette2023). Nevertheless, an alarming sixfold increase in water consumption has occurred in the last century; this trajectory is continuing (Fito et al. Reference Fito, Ahmed, Nkambule and Kefeni2023), and global concerns regarding water scarcity are intensifying (Kahramanoğlu et al. Reference Kahramanoğlu, Usanmaz and Alas2020, Rusu et al. Reference Rusu, Mihăiescu, Odagiu and Paulette2023).
Water scarcity is profoundly affecting all human practices across various communities and nations (Hoekstra et al. Reference Hoekstra, Chapagain, Aldaya and Mekonnen2011). Urban areas are the primary contributors to this escalating demand due to the direct correlation between human population growth and water consumption (Corcoran Reference Corcoran2010). It is predicted that the urban population will double by 2050, further exacerbating the strain on water resources (Jensen & Nair Reference Jensen and Nair2019, du Plessis Reference du Plessis2023). Compounding this challenge, agriculture – a sector pivotal for human sustenance and economic development – accounts for 70–90% of water consumption (Morera et al. Reference Morera, Corominas, Poch, Aldaya and Comas2016). The intersecting dynamics of human population growth, urbanization and water scarcity pose a substantial threat to sustainable urban development and environmental integrity (Akubia et al. Reference Akubia, Ahmed and Bruns2020, Jery et al. Reference Jery, Aldrdery, Ghoudi, Moradi, Ali, Tizkam and Sammen2023, Mehdizadeh et al. Reference Mehdizadeh, Nikoo, Talebbeydokhti, Vanda and Nematollahi2023).
The crisis of water scarcity emanates from two primary issues: limited supply and burgeoning demand. Fresh water suitable for human consumption accounts for a mere 2.5% of the world’s total water volume (Dong et al. Reference Dong, Geng, Sarkis, Fujita, Okadera and Xue2013). Demand is propelled by economic growth as well as an expanding global human population (Lambin & Meyfroidt Reference Lambin and Meyfroidt2011).
To address water consumption at an individual level, the concept of ‘virtual water’ signifies the total water indirectly consumed through various products and services (Lee et al. Reference Lee, Tung, Lee and Lin2016), and the ‘water footprint’ (WF) is an invaluable indicator of fresh water utilized in the production of goods and provision of services by individuals, communities and businesses, encompassing both virtual and direct water consumption (Hoekstra & Hung Reference Hoekstra and Hung2002, Hoekstra et al. Reference Hoekstra, Chapagain, Aldaya and Mekonnen2011, Lee et al. Reference Lee, Tung, Lee and Lin2016, Gómez-Llanos et al. Reference Gómez-Llanos, Durán-Barroso and Robina-Ramírez2020). The WF highlights the significance of consumption patterns and emphasizes the role of indirect water use in overall water consumption (Souza et al. Reference Souza, Bhattacharya-Mis, Restrepo-Estrada, Gober, Taffarello, Tundisi and Mendiondo2021).
The major contributors to the global WF at the product category level are cereals, meat and milk products (Hoekstra & Mekonnen Reference Hoekstra and Mekonnen2012). The surge in animal product consumption in particular has exacerbated freshwater usage due to the higher WF of livestock in comparison with crop products (Mekonnen & Hoekstra Reference Mekonnen and Hoekstra2012). Detailed WF data assist governments in understanding the inefficiencies in water use related to production and consumption patterns (Hoekstra & Mekonnen Reference Hoekstra and Mekonnen2012). Such insights guide policymakers in formulating strategies that promote water-use efficiency and encourage a shift towards less water-intensive commodities, ultimately contributing to a more sustainable water-use pattern (Arabi Yazdi et al. Reference Arabi Yazdi, Alizadeh and Nairizi2009).
The WF concept serves as a multifaceted indicator of human water resource consumption, offering a platform for informed decision-making to ensure sustainable and equitable water use (Deepa et al. Reference Deepa, Anandhi and Alhashim2021). The applications of the WF include assessing freshwater use at corporation, product, city, regional and global levels (Gallo et al. Reference Gallo, Landro, La Grassa and Turconi2022), with research primarily focusing on measuring and evaluating the WF across these various scales (Zhang et al. Reference Zhang, Tian, Hu and Yu2019) and that now encompasses diverse geographical and societal contexts, shedding light on WF components, consumption patterns and related determinants (Lee et al. Reference Lee, Tung, Lee and Lin2016, Chini et al. Reference Chini, Konar and Stillwell2017, Cai et al. Reference Cai, Liu and Zhang2019, Lee Reference Lee2019, Souissi et al. Reference Souissi, Mtimet, Thabet, Stambouli and Chebil2019, Zhao et al. Reference Zhao, Gao, Xie, Lai and Yang2019, Alqahtani et al. Reference Alqahtani, Alropy, Kotb and Alaagib2021, Karaçil Ermumcu et al. Reference Karaçil Ermumcu, Çıtar Dazıroğlu, Erdoğan Gövez and Acar Tek2024).
Iran, the second largest country in the Middle East, faces significant water scarcity (Karandish & Hoekstra Reference Karandish and Hoekstra2017) from issues including declining water resources, insufficient water distribution infrastructure, population growth, migration and urbanization, degradation of natural landscapes, global warming, uneven rainfall distribution, frequent droughts and traditional agricultural practices (Arabi Yazdi et al. Reference Arabi Yazdi, Alizadeh and Nairizi2009, Kolahi et al. Reference Kolahi, Sakai, Moriya and Makhdoum2012, Kolahi Reference Kolahi2013, Reference Kolahi2014, Madani et al. Reference Madani, AghaKouchak and Mirchi2016). Additionally, water leakage from urban water distribution networks in Iran is as high as 27% (Moslehi et al. Reference Moslehi, Jalili-Ghazizadeh and Yousefi-Khoshqalb2021). Poor management, unregulated water use and more than half a century of drought have significantly impacted water-dependent practices (Alavijeh et al. Reference Alavijeh, Falahi, Shadmehri, Salehnia, Larsen and Drews2021). Water supply rationing and disruptions have become common in major metropolitan areas in Iran during the hot summer months. The combination of limited water resources and increasing demand has heightened tensions and conflicts over trans-boundary water systems, both regionally (e.g., conflicts between provinces over Urmia and Zayandeh-Rud in Iran) and internationally (e.g., conflicts over the Hirmand River with Afghanistan; Madani Reference Madani2014).
Mashhad, the second most populous and expansive city of Iran, faces prolonged water scarcity and associated challenges (Dadmand et al. Reference Dadmand, Naji-Azimi, Farimani and Davary2020, Mohamadi et al. Reference Mohamadi, Ahmadi, Ahmadi and Hakimi Khoram2023). Given the constraints on increasing water supply due to climatic conditions, an alternative approach to conserving water resources in the current scenario is through water demand management (Radmehr & Shayanmehr Reference Radmehr and Shayanmehr2018, Kolahi et al. Reference Kolahi, Davary and Omranian Khorasani2024), with a particular focus on reducing the WF. Fresh water is essential for life, and its availability is finite, necessitating careful management (Hossain & Khan Reference Hossain and Khan2020).
Previous WF studies in Iran have predominantly focused on agricultural crops (Esmaeilzadeh et al. Reference Esmaeilzadeh, Asgharipour and Khoshnevisan2020). For instance, wheat and barley production are now recognized as significant consumers of green water resources, which refers to the rainwater stored in soil and used by plants. The grey WF is the volume of freshwater required to assimilate pollutants to meet specific water quality standards, while the blue WF pertains to the consumption of surface water and groundwater resources for irrigation. Average WFs, as well as the share of green, blue and grey WFs for citrus and saffron production, have been calculated (Bazrafshan et al. Reference Bazrafshan, Ramezani Etedali, Moshizi and Shamili2019, Bazrafshan & Dehghanpir Reference Bazrafshan and Dehghanpir2020).
The WFs of urban areas in Iran have been neglected, yet 3.6% of the global human population resides there. The present study assesses the WFs of citizens in the city of Mashhad. Our hypotheses are that there are relationships between respondents’ characteristics and the different components of the WF, specifically the direct water footprint (DWF), the virtual water footprint (VWF) and the total water footprint (TWF), particularly with respect to education level, monthly income, gender, marital status, housing status and income class.
Study area
Mashhad, the capital of the province of Razavi Khorasan, covers an area of 328 km2 on the southern bank of the Kashfroud River (52°2´–60°36´E, 35°43´–37°7´N). It is surrounded by the Hazar Masjid Mountains to the north and the Binaloud Mountains to the south and west. The city features three main water channels – Chehel Bazeah Channel, Eghbal-e Gharbi Channel and Eghbal-e Shargi Channel – flowing from south-west to north-east, ultimately leading to the Kashfroud River (Fig. 1). Mashhad is divided into 13 urban districts, including 12 regular districts and the Saman district (the area around the Razavi shrine; Najafi & Eskandari Torbaghan Reference Najafi and Eskandari Torbaghan2021) and 41 urban planning zones, 38 services zones and 158 quarters. In 2015, Mashhad covered an area of 35 147 ha and was home to 3 001 184 individuals and 914 146 families (Statistical Center of Iran 2015). Additionally, it attracts c. 22 million pilgrims annually from across the country and beyond.
Diagrammatic maps showing the location and municipal areas of Mashhad, Iran.

Methods
To identify the nine main quarters for the study, we conducted a pre-test questionnaire to categorize the 158 quarters of Mashhad into three family income levels: high, middle and low. Based on this categorization, we selected three quarters for each income level, resulting in nine main quarters for our analysis: Khaje Rabi, Panj Tan, Gaz, Sanabad, Azad Shar, Seyed Razi, Ahmad Abad, Sajad and Honarestan (Table S1).
To acquire data, a questionnaire was designed based on the Water Footprint Personal Extended Calculator (www.waterfootprint.org); the first part captured demographic characteristics, while the second part focused on respondents’ food consumption habits (Tables 1 & 2).
Respondents’ characteristics.

Respondents’ food consumption and water footprint data.

DWF = direct water footprint; TWF = total water footprint; VWF = virtual water footprint.
The sample size of 382 households was determined using Cochran’s formula (Cochran Reference Cochran1977). A systematic random sampling technique was employed with the assistance of Geographical Information System (GIS) software, distributing points across the selected quarters. Houses adjacent to these points were then selected, and individuals over 18 years old were personally interviewed. Additionally, monthly water usage data for families during 2012–2016 were obtained from the Mashhad Water & Waste Water Company.
The WF was estimated by combining both the direct water use by individuals and their indirect water use. DWF specifically refers to the water consumption by individuals at home (Van Oel et al. Reference Van Oel, Mekonnen and Hoekstra2009), representing the amount of water directly consumed in daily routines (Gómez-Llanos et al. Reference Gómez-Llanos, Durán-Barroso and Robina-Ramírez2020). The DWF data were acquired from respondents’ bills provided by the Mashhad Water & Waste Water Company.
The VWF (indirect WF) refers to the water utilized by others to produce goods and services that are subsequently consumed by the individual (Van Oel et al. Reference Van Oel, Mekonnen and Hoekstra2009); it was calculated using the Water Footprint Network (WFN; www.waterfootprint.org). The website provides geographically explicit data on blue (crop irrigation water), grey (water required to dilute pollutants) and green (rainwater evaporated from the soil) WFs of crop growing in different countries (Souissi et al. Reference Souissi, Mtimet, Thabet, Stambouli and Chebil2019).
By obtaining the DWF and VWF, the TWF was calculated according to Equation 1:
 $$TWF = DWF + VWF $$
The data were analysed using SPSS, employing descriptive statistics, analysis of variance (ANOVA) tests to compare means among different income groups and correlation analyses to identify relationships between variables.
Results
The majority of respondents were middle-aged, came from small families, predominantly including married females functioning as housewives, and had education levels primarily below diploma level (Table 1). A significant proportion of respondents were homeowners (Table S2). The data across nine urban quarters based on three assumed family income levels resulted in high standard deviations (SDs) of monthly family expenditure and home area.
Rice and bread were the dominant foods consumed, while vegetables were the least consumed (Table 2 & Fig. S1a). In high-income areas, meat, dairy, vegetables, fruit and coffee were consumed more frequently than in other areas (Fig. S1b). The respondents’ monthly water usage over 5 years revealed a decline, suggesting a positive trend (Fig. S2).
Pearson correlations revealed significant relationships between the DWF, VWF and TWF and certain variables (Table 3). Family size and annual cost exhibited notable correlations with VWF and TWF. Larger families tended to economize their food intake, resulting in reduced VWF and TWF. Conversely, higher annual costs were associated with elevated VWFs and TWFs; however, there were no significant correlations between age, area of residence and the WFs.
Results of Pearson correlations between water footprints and some variables.

** Significant at the 0.01 probability level.
DWF = direct water footprint; TWF = total water footprint; VWF = virtual water footprint.
While higher education levels showed an inclination towards higher WFs, particularly among those with doctoral qualifications (Fig. 2a), ANOVA tests (Table S3) demonstrated no significant differences in the WFs across education levels. The WFs tended to be greater at higher levels of income (Fig. 2b & Table S4).
Bar charts of the virtual water footprint (VWF), direct water footprint (DWF) and total water footprint (TWF) in relation to (a) education level and (b) monthly income.

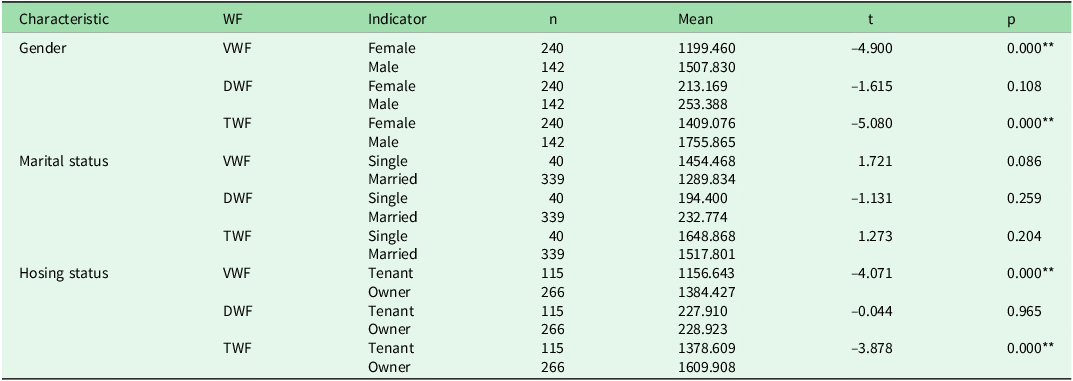
Males exhibited significantly higher VWFs and TWFs than females (Table 4 & Fig. S3a), and homeowner VWFs and TWFs were higher than those of non-homeowners. Single and married respondents did not differ in their WFs (Table 4).
Results of Student’s t-tests of gender, marital status, housing status and the water footprints (WFs).
** Significant at the 0.01 probability level.
DWF = direct water footprint; TWF = total water footprint; VWF = virtual water footprint.
DWFs, VWFs and TWFs were greater in high-income than in low-income areas. Middle-income areas exhibited the lowest DWF (Table 5 & Fig. S3b).
Results of the analysis of variance on three income class levels and the water footprints (WFs).
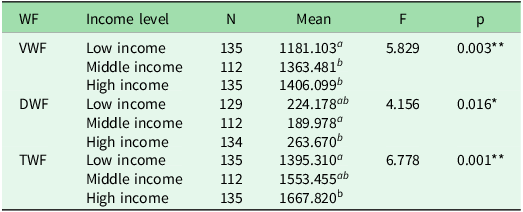
a,bSuperscript letters indicate the results of post-hoc Tukey’s honestly significant difference (HSD) tests. Different letters denote statistically significant differences between income groups at the 0.05 probability level.
*Significant at the 0.05 probability level; **significant at the 0.01 probability level.
DWF = direct water footprint; TWF = total water footprint; VWF = virtual water footprint.
Discussion
The VWF being approximately six times larger than the DWF is consistent with findings from the USA (Chini et al. Reference Chini, Konar and Stillwell2017), emphasizing the significance of accounting for indirect water usage.
High-income areas in Iran exhibited higher intakes of meat, dairy, vegetables, fruit and coffee. The influence of socioeconomic factors on dietary habits has been recognized elsewhere (Creutzig et al. Reference Creutzig, Roy, Lamb, Azevedo, Bruine de Bruin and Dalkmann2018), while differences between low- and high-income countries in nutrition patterns have been acknowledged (Gerbens-Leenes et al. Reference Gerbens-Leenes, Nonhebel and Krol2010).
A decline in monthly water usage bills over 5 years might suggest increased citizen awareness and efforts to curb water consumption. Public awareness measures through media and educational initiatives probably contributed to this positive trend, emphasizing the potential impact of proactive measures for alleviating water scarcity.
Contrary to certain existing studies, age did not exhibit a significant correlation with the WFs in Mashhad, although the absence of a significant impact of education levels on the WFs is in agreement with previous research (Lee Reference Lee2019), and an influence of income levels is also consistent with prior studies (Cai et al. Reference Cai, Liu and Zhang2019, Alqahtani et al. Reference Alqahtani, Alropy, Kotb and Alaagib2021). The present study suggests that economic development may influence water consumption levels (Majeed & Mazhar Reference Majeed and Mazhar2020). This is consistent with the Environmental Kuznets Curve, indicating that economic growth initially leads to increased environmental degradation, including higher water consumption, before driving more sustainable practices due to growing environmental concerns (Sarkodie & Strezov Reference Sarkodie and Strezov2019).
The observed lack of significant impact of education level on the WFs raises concerns about the alignment of current educational practices with environmental sustainability objectives. It suggests that existing educational frameworks neither adequately prioritize environmental awareness nor incorporate the Sustainable Development Goals (SDGs; Kolahi Reference Kolahi2023, Kolahi & AzimiSeginSara Reference Kolahi and AzimiSeginSara2023). This finding underscores a broader issue of a deficiency in holistic and systems-orientated thinking in environmental education.
Gender disparities were evident, with males displaying higher WFs, perhaps being attributable to their increased food consumption, particularly meat intake. However, the differences in DWFs were not significant, warranting further exploration of gender-based variations. Karaçil Ermumcu et al. (Reference Karaçil Ermumcu, Çıtar Dazıroğlu, Erdoğan Gövez and Acar Tek2024) recently emphasized the significantly higher total WFs among males, but differences in DWFs require deeper investigation of gender-based variations.
Housing status significantly influenced the WFs, notably impacting homeowners who had higher VWFs and TWFs, possibly due to income and lifestyle differences. Income-based disparities indicated higher water consumption, both direct and indirect, in high-income areas, supporting the research hypothesis and reinforcing previous research on the influence of regional income disparities on the WFs. This is consistent with findings from studies by Lee et al. (Reference Lee, Tung, Lee and Lin2016) and Zhao et al. (Reference Zhao, Gao, Xie, Lai and Yang2019), underlining the impacts of income disparities on the WFs at a regional level.
Our finding that middle-income areas exhibited the lowest DWFs compared to high- and low-income areas may seem counterintuitive but could be attributed to variations in household water use behaviours. For instance, middle-income households may have different lifestyle patterns, such as spending more time outside the home due to work or other commitments, resulting in reduced domestic water consumption. Additionally, factors such as travel frequency or temporary absence from home may contribute to the observed differences in DWFs. Further investigations into the specific behaviours and habits of households in middle-income areas could provide valuable insights into the nuanced relationship between income levels and water consumption patterns.
Several challenges to successful completion of the present work help to indicate ways in which future research could be facilitated and strengthened. The data collection process for the DWF was very time-consuming and geographically dispersed, and the Mashhad Water & Waste Water Company was reluctant to provide the necessary data, requiring persistence to obtain this information. Information on monthly water usage was not consistent among families, months and years. These constraints did not undermine the overall findings, but they highlight areas for improvement in future research. Addressing these limitations should lead to more robust and comprehensive data for informed decision-making in water resource management. This study underscores the importance of fostering the free exchange of data for research and decision-making, and this necessitates strong collaboration between executive offices and universities.
Conclusion
We highlight educational reforms, gender disparities and policy development as three major issues that policymakers need to address. Firstly, significant reforms in educational curricula are needed to prioritize environmental awareness and integrate sustainability principles. Aligning educational content with environmental objectives, particularly SDG4 (quality education), is crucial. Emphasizing ecocentric ethics and sustainability in education can drive attitudinal and behavioural shifts.
Secondly, the gender disparities in water consumption highlight the need to encourage sustainable dietary practices among males. Implementing incentive-based policies can promote responsible water usage by encouraging males to adopt diets with lower WFs, such as those involving the increased consumption of plant-based food.
Thirdly, our findings offer a foundation for policymakers, urban planners and water authorities to craft targeted policies for water security. Understanding the relationships between citizens’ characteristics and water footprints enables stakeholders to design strategies that effectively reduce water consumption and foster sustainable practices.
By redesigning holistic engagement systems and educational materials to reflect ecocentric ethics and addressing socioeconomic factors in water consumption, we can cultivate a more environmentally responsible society and pave the way for a sustainable future. Further research exploring WF patterns across different regions in Iran will provide deeper insights into the country’s WF landscape.
Supplementary material
For supplementary material accompanying this paper, visit https://doi.org/10.1017/S0376892924000195.
Data availability
The datasets used and/or analysed during the current study are available from the corresponding author upon request.
Acknowledgements
We extend our heartfelt appreciation to the citizens who gave their valuable time to participate in our survey, and we thank the editors and reviewers for their improvements to the paper.
Financial support
We thank Ferdowsi University of Mashhad (FUM) for support and funding (reference number 42765), which played a crucial role in the successful execution of this study.
Competing interests
The authors declare none.
Ethical standards
All procedures in this work complied with the ethical standards of the Institutional Review Board of Ferdowsi University of Mashhad and the national ethical guidelines of Iran, and the research adheres to the principles outlined in the Helsinki Declaration of 1975, as revised in 2008 (World Medical Association 2008).
Author contributions
The authors’ individual contributions were as follows: Supervisor: MK; Data collection and coding: ZS, SH and MA; Data analysis: MK and ZS; Writing – original draft preparation, reviewing and editing: MK and ZS. All authors have read and agreed to the published version of the manuscript.
Code availability
Available upon request.



