I. INTRODUCTION
Advanced material development requires its properties being characterized at the micro-/nanoscale. These material systems include thin-films, coatings, nanostructured materials, surface, interface/interphase, microelectromechanical systems (MEMSs), and functionally graded materials, with which the conventional mechanical tests become ineffective or inaccessible based on the size of specimen and testing equipment. Micro- and nano-indentation techniques have recently attracted much attention for finding materials' mechanical properties at the micro-/nanoscale.Reference Fischer-Cripps1–3 In the early time, indentation techniques were used to measure materials' surface hardness, one of the most characteristic properties of materials. Hardness testing was the first material testing practice from 1600s in geology and engineering through the scratching hardness testing methods.Reference Szilágyi, Borosnyói and Zsigovics4 The theoretical hardness research was initialized by the pioneering work of Hertz in 1881.Reference Hertz5 However, the quantitative scales of hardness and related measurement methods were proposed only in recent one century or so. Based on Hertz's proposal, the first modern technique for measuring the hardness of metals is due to Brinell in 1900, who measured the hardness using a hard steel ball as the indenter.Reference Brinell6 Then, several other hardness tests have been developed, including the Rockwell, Vickers, Knoop, and Berkovich tests, and different shapes of indenters have been adopted.Reference Fischer-Cripps7–Reference Bauccio11 ASTM standards have been developed for testing hardness and materials parameters of different materials.3,12
Hardness and strength are the important properties of materials. Indentation hardness tests measure the resistance to permanent deformation of a material when subjected to a particular combination of triaxial compressive stress and steep stress gradient, which provide a convenient and nondestructive means of estimating the strength properties (yield strength and ultimate tensile strength) of metals.Reference Zhang, Li and Zhang8,Reference Datsko13–Reference Ramaekers and Veenstra15 However, the hardness values could only give reasonable estimates of the strength properties for stress-relieved metals.
With theory and technology advancement, a veritable revolution has occurred in indentation testing.Reference Pharr, Oliver and Brotzen16–Reference Oliver and Pharr18 The resulting technique, termed micro- or nano-indentation, has now become ubiquitous for mechanical property measurement at surfaces. Indenter tips are able to be made with reduced size, different shapes, and improved accuracy, and depth and load measurements have been also improved. Since the Berkovich, conical, Vickers, or spherical tip constantly changes its contact area as it is undergoing an indentation, the true projected contact area of the indenter on the specimen is unknown. With the advancement of technology, different indentation tips have been made. A cylindrical flat-tip indenter has a constant contact area allowing for the indenter to press on the specimen.
An experimental and theoretical investigation on elastic–plastic indentation using a cylindrical indenter has been studied by Wright et al.Reference Wright, Huang and Fleck19 to determine the deep penetration response of polycarbonate. It was found that the average pressure on the indenting end of the penetrator is equal to 4–5 times the tensile yield stress and is independent of nose shape and penetrator diameter. A model of deep penetration was developed, in which assumed the existence of an outer elastic zone, a plastic zone, and a hackle zone surrounding the penetrator. The indentation of standard viscoelastic solids by an axisymmetric, flat-ended indenter was investigated theoretically by Cheng et al.,Reference Cheng, Xia, Yu, Scriven and Gerberich20 and the solutions of the equations of viscoelastic deformation in indentation were derived. The analysis provided a fundamental basis for probing elastic and viscous properties of coatings with micro-/nano-indentation tests. Eldridge et al.Reference Eldridge, Zhu and Miller21 performed cylindrical punch indentations to determine the effective modulus of plasma-sprayed thermal barrier coating as a function of coating depth. Cylindrical punch indentation offers significant advantages over pointed (Vickers, Berkovich, or Knoop) indentations for materials that do not exhibit linear elastic behavior. Using finite element analysis (FEA), Xu et al.Reference Xu, Zhao and Yue22 have simulated indentation stress characteristics of thin film/substrate systems by the flat cylindrical indenters. The result showed that friction between the indenter and the specimen had little influence on the test, and the thickness of the thin film would greatly influence the test, thus thinner films need to have smaller indentation depths. Gisario et al.Reference Gisario, Barletta and Boschetto23 assessed the possibility of predicting the thickness of the hardened layers produced by high power diode laser heat treatment. Indentation testing by cylindrical flat punch was carried out to evaluate the effectiveness of the surface-hardening heat treatments on milled AISI 1040 steel substrates by varying laser operational parameters as well as the morphology of steel substrates. Lu and ShinozakiReference Lu and Shinozaki24 and Lu et al.Reference Lu, Kurapati and Yang25 performed large displacement microindentation. FEA was used for determining the plastic properties of elastic–plastic materials and the effect of strain hardening. Results showed that under a flat-tipped indenter, the material can quickly reach a fully plastic state. The size (diameter) of the plastic zone remains constant during further indentation. They found the test to be insensitive to the modulus but it was very sensitive to the strain-hardening exponent. By changing indentation tip shapes, it was found to have a significant effect with the stress–displacement curves, but when reaching a large deformation the material would reach a gross yielding effect no matter the shape. The analysis suggests that it does not need parameters such as impression radius and contact stiffness for determining the plastic behavior of materials. Thus, the cylindrical indentation can suppress the uncertainties in measuring material properties. With these indentation tests, a correction factor was used to find the 0.2% offset yield point of the material. Compared with other shaped indenters, the flat-ended indenter requires the least penetration depth to probe the plastic properties of a material. Slaboch and OvaertReference Slaboch and Ovaert26 used a cylindrical flat-tip 40 µm radius indenter to determine the effects of mechanical properties on thrombi dissociation and aortic rupture, coupled with modeling. Elastic modulus and viscosity of the material were analyzed and compared with experimental data and observations from other literature. The model used the loading curve to find the elasticity, which has not been used by other researchers, because during the loading process the material is undergoing plasticity. Hu et al.Reference Hu, Lynne, Markondapatnaikuni and Delfanian27 proposed an approach through a micro/nanoindentation testing using a cylindrical flat-tip indenter coupled with computer modeling as a means of characterizing the elastic–plastic properties of materials. Based on the fact (verified by modeling) that the subsurface displacements produced by any blunt indenter are approximately radial from the point of first contact, which roughly hemi-spherical contours of equal strain, a mechanical model of stress–strain distribution in the indentation was proposed for directly extracting the yield strength of the testing material from the corresponding load points of the indentation testing. A formula for directly calculating the yield strength from the indention load was derived and validated by experiments, considering a modifier k.
A great deal of experiments and modeling efforts on indentation testing using Berkovich, Vickers, or other shapes of indenters have been done for understanding the indentation process.Reference Hu, Lynne, Markondapatnaikuni and Delfanian27–Reference Jiang, Zhou and Huang56 With the advancement of computers and software, computer modeling is becoming more common and practical in research.
In this paper, an innovative approach through micro-/nano-indentation testing with a cylindrical flat-tip indenter and coupled with computer modeling will be proposed to characterize material's elastic–plastic properties. Based on the hemi-spherical stress–strain distribution assumption of an elastic–plastic indentation, the mechanical model and formula for directly extracting yield strength from the micro-/nano-indentation loading curve will be analytically derived, numerically identified, and experimentally validated. The materials with different types of elasto-plastic models to be tested and modeled are aluminum alloy 6061T6, low carbon steel AISI1018, and alloy steel AISI 4340. For providing comparison and modeling inputs, the tensile tests for the same materials will be undergone. A micro-/nano-indentation solid model will be constructed and computer modeling based on FEA will be conducted. The effects of indentation depth and friction coefficient on indentation testing will be investigated. The results by computer modeling will be compared and validated by experimental results. The indentation testing errors induced by residual stresses in preparing specimens will be investigated by a nondestructive residual stress measurement system.
II. MECHANICS OF MICRO-/NANO-INDENTATION
The cylindrical flat-tip indenter offers a unique advantage because the contact area remains constant. To understand indentation with the flat-tip indenter, it is necessary to understand the pressure distribution over the contact area of the indenter. For a perfect elastic indentation, the stress field with a cylindrical flat-tip indenter has been theoretically determined by Sneddon, and more recently further developed by Barquins and Maugis.Reference Sneddon57–Reference Barquins and Maugis59 However, through computer modeling, Hu et al.Reference Hu, Lynne, Markondapatnaikuni and Delfanian27 found that the pressure on the contact surface of the indenter, p, is a function of Young's modulus E and Poisson's ratio ν of the specimen, the ratio of the indentation depth to the indenter radius h/a, the ratio of the radial position to the indenter radius r/a, and the friction coefficient µ between the indenter tip and the specimen testing surface, in which the pressure is proportional to E and h/a, and can be represented by
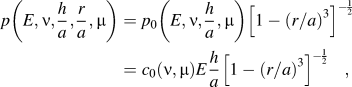 $$p\left( {E,\nu ,{h \over a},{r \over a},\mu } \right) = {p_0}\left( {E,\nu ,{h \over a},\mu } \right){\left[ {1 - {{\left( {r/a} \right)}^3}} \right]^{ - {1 \over 2}}} = {c_0}(\nu ,\mu )E{h \over a}{\left[ {1 - {{\left( {r/a} \right)}^3}} \right]^{ - {1 \over 2}}}\quad {\rm{,}}$$
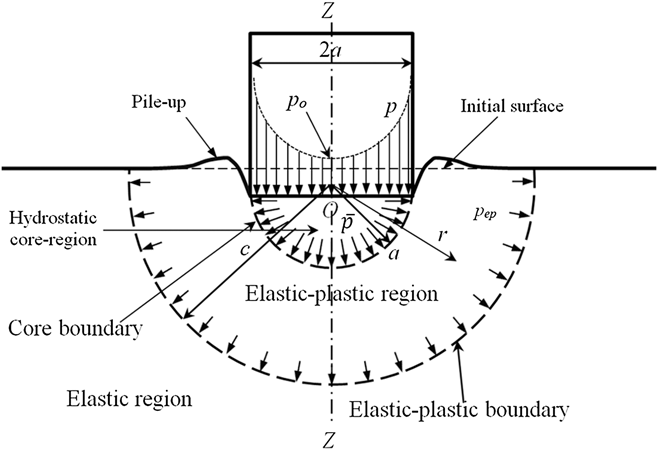
where p 0 is the pressure at the center point of the contact area, c 0 is a coefficient depending on the Poisson's ratio of the specimen ν and friction coefficient µ, as shown in Fig. 1. Here, Eq. (1) indicates that the indenting pressure, p, at the indenter edge, r = a, is infinitive. For dimensional analysis, a review paper applied to indentation problems can be found in Ref. Reference Cheng and Cheng60. Therefore, the total indentation load can be obtained by integrating the pressure over the contact surface as
 $$P \approx 1.72A{p_0}\left( {E,\nu ,{h \over a},\mu } \right) = 1.72A{h \over a}{c_0}\left( {\nu ,\mu } \right)E\quad {\rm{,}}$$
where A is the contact area.
Schematic of the mechanical model of an elastic–plastic indentation by a cylindrical flat-tip indenter.
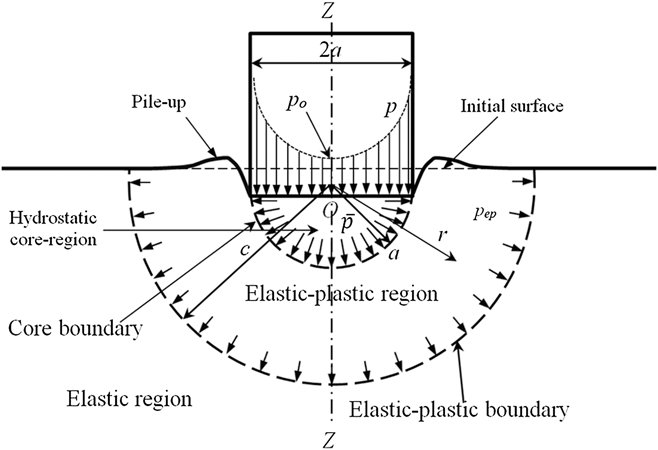
For an elasto-plastic material, since the indenter tip features a sharp edge, when indenting the pressure at the edge is infinitive and plasticity, a spontaneous response immediately develops in the specimen around this edge which lowers the pressure around this edge. Therefore, the total indenting load for an elasto-plastic material is less than that of a perfect elastic material. Following an early suggestion of Bishop, Hill, and Mott which was developed by Marsh and Johnson based on the observations of Samuels and Mulhearn and validated by computer modeling of Hu et al.,Reference Hu, Lynne, Markondapatnaikuni and Delfanian27 Lu and Shinozaki,Reference Lu and Shinozaki24 and Lu et al.,Reference Lu, Kurapati and Yang25 a mechanical model to the analysis of an elastic–plastic indentation can be stated that the subsurface displacements produced by any blunt indenter are approximately radial from the point of first contact, with roughly hemi-spherical contours of equal strain. Furthermore, the contact surface of the indenter is encased in a hemi-spherical “core” of radius a. Within the core is a hydrostatic component of stress,  $\bar p$. Outside the core, the stresses and displacements have radial symmetry in the elastic–plastic body, which contains a spherical cavity under pressure
 $\bar p$. This situation is similar to a homogeneous sphere (internal radius a and external radius b, and b is considered to be infinitely large) is made of an elastic perfectly plastic material. Starting from an initial stress-free state, the internal pressure on radius a rises from 0 to
 $\bar p$ inducing an elastic deformation field, and no restriction is placed on the expansion of the sphere. Since the body's geometry and the loading present a spherical symmetry, and the material's behavior is isotropic, the stress solution can be built in a spherical coordinate system (r, θ, ϕ). So that the elastic solution isReference Hill61,Reference Timoshenko62
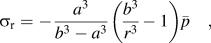 $${\sigma _{\rm{r}}} = - {{{a^3}} \over {{b^3} - {a^3}}}\left( {{{{b^3}} \over {{r^3}}} - 1} \right)\bar p\quad {\rm{,}}$$
 $${\sigma _\theta } = {\sigma _\phi } = {{{a^3}} \over {{b^3} - {a^3}}}\left( {{{{b^3}} \over {2{r^3}}} + 1} \right)\bar p\quad {\rm{,}}$$
 $${u_{\rm{r}}} = {{{a^3}} \over {{b^3} - {a^3}}}\left( {\left( {1 - 2\nu } \right)r + \left( {1 + \nu } \right){{{b^3}} \over {2{r^2}}}} \right){{\bar p} \over E}\quad {\rm{.}}$$
As the hydrostatic pressure  $\bar p$ increases to the elastic limit,
 ${\bar p_{\rm{e}}}$, the onset of plastic flow starts. Both von Mises and Tresca criteria give the same yield statement as
 $${\sigma _\theta } - {\sigma _{\rm{r}}} = {3 \over 2}{{{a^3}} \over {{b^3} - {a^3}}}{{{b^3}} \over {{r^3}}}{\bar p_{\rm{e}}} = {\sigma _{\rm{y}}}\quad {\rm{.}}$$
The initial plastic zone is then located in r = a, and the value of the pressure  ${\bar p_{\rm{e}}}$ is
 $${\bar p_{\rm{e}}} = {2 \over 3}\left( {1 - {{{a^3}} \over {{b^3}}}} \right){\sigma _{\rm{y}}}\quad {\rm{.}}$$
Computer modelingReference Hu, Lynne, Markondapatnaikuni and Delfanian27 shows that in the indentation when the plastic strain reaches 0.1 or 0.2%, the hemi-spherical contour of equal-strain and hemi-spherical hydrostatic “core” can be well formed. On the other hand, in the practice, 0.1 or 0.2% offset yield strength is commonly measured. Therefore, when the internal pressure  $\bar p$ becomes larger than
 ${\bar p_{\rm{e}}}$, a natural assumption is that the plastic zone takes a region of a < r < c, where c > a. While the region c < r < b remains in the elastic region. The component σr is continuous at the boundary between the elastic and the plastic zone, r = c, and at this point, the radial stress, σr, that corresponds to the onset of plastic flow for a hollow sphere of external radius b and internal radius c, is
 $${\sigma _{\rm{r}}}\left( {r = c} \right) = - {2 \over 3}\left( {1 - {{{c^3}} \over {{b^3}}}} \right){\sigma _{\rm{y}}}\quad {\rm{.}}$$
The stress components in the elastic zone are then given by Eqs. (3)–(5), where a is replaced by c and  $\bar p$ by
 $- {\sigma _{\rm{r}}}\left( {r = c} \right)$, i.e.,
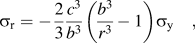 $${\sigma _{\rm{r}}} = - {2 \over 3}{{{c^3}} \over {{b^3}}}\left( {{{{b^3}} \over {{r^3}}} - 1} \right){\sigma _{\rm{y}}}\quad {\rm{,}}$$
 $${\sigma _\theta } = {\sigma _\phi } = {2 \over 3}{{{c^3}} \over {{b^3}}}\left( {{{{b^3}} \over {2{r^3}}} + 1} \right){\sigma _{\rm{y}}}\quad {\rm{,}}$$
 $${u_{\rm{r}}} = {2 \over 3}{{{c^3}} \over {{b^3}}}\left( {\left( {1 - 2\nu } \right)r + \left( {1 + \nu } \right){{{b^3}} \over {2{r^2}}}} \right){{{\sigma _{\rm{y}}}} \over E}\quad {\rm{.}}$$
In the plastic zone, a < r < c, the equilibrium equation is
 $${{d{\sigma _{\rm{r}}}} \over {dr}} + {2 \over r}\left( {{\sigma _\theta } - {\sigma _{\rm{r}}}} \right) = 0\quad {\rm{.}}$$
And the yield criterion is
 $${\sigma _\theta } - {\sigma _{\rm{r}}} = {\sigma _{\rm{y}}}\quad {\rm{.}}$$
Therefore
 $${\sigma _{\rm{r}}} = 2{\sigma _{\rm{y}}}\ln \left( r \right) + d\quad {\rm{,}}$$
where the integration constant d can be determined by the continuity condition of the stress σr at r = c in Eq. (8). Then in the plastic zone, the stress components are
 $${\sigma _{\rm{r}}} = - {2 \over 3}{\sigma _{\rm{y}}}\left( {1 + 3\ln \left( {{c \over r}} \right) - {{{c^3}} \over {{b^3}}}} \right)\quad {\rm{,}}$$
 $${\sigma _\theta } = {\sigma _\phi } = {2 \over 3}{\sigma _{\rm{y}}}\left( {{1 \over 2} - 3\ln \left( {{c \over r}} \right) + {{{c^3}} \over {{b^3}}}} \right)\quad {\rm{.}}$$
Furthermore, in the plastic zone, for r = a,  ${\sigma _{\rm{r}}}\left( {r = a} \right) = - \bar p$, then
 $$\bar p = {2 \over 3}{\sigma _{\rm{y}}}\left( {1 + 3\ln \left( {{c \over a}} \right) - {{{c^3}} \over {{b^3}}}} \right)\quad {\rm{.}}$$
As aforementioned, it is assumed that the internally pressurized homogeneous sphere is infinitely large, i.e.,  $b \gg c$, therefore, c/b term can be ignored. Thus, Eq. (17) becomes
 $$\bar p \approx {2 \over 3}{\sigma _{\rm{y}}}\left( {1 + 3\ln \left( {{c \over a}} \right)} \right)\quad {\rm{.}}$$
Therefore, the total indentation load, P, at the given hydrostatic pressure  $\bar p$ by Eq. (18), isReference Hu, Lynne, Markondapatnaikuni and Delfanian27
 $$P = \pi {a^2}\left[ {{2 \over 3} + 2\ln \left( {{c \over a}} \right)} \right]{\sigma _{\rm{y}}} = kA{\sigma _{\rm{y}}}\quad {\rm{.}}$$
Or
 $${\sigma _{\rm{y}}} = {P \over {kA}}\quad {\rm{,}}$$
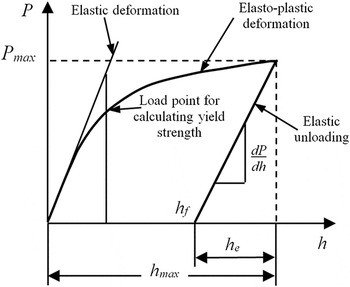
where 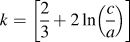 $k = \left[ {{2 \over 3} + 2\ln \left( {{c \over a}} \right)} \right]$ is a modifier determined from the calibration test or modeling. When the indentation reaches certain depth, the indentation deformation field satisfies with the stated mechanical model. According to Eq. (20), the yield strength of the specimen, σy, at 0.1 or 0.2% offset (plastic strain) can be extracted from the indentation load–depth curve at the appropriate depth point, where the plastic strain reaches 0.1 or 0.2%, the hemi-spherical contour of equal-strain and hemi-spherical hydrostatic “core” can be well formed, as shown in Figs. 1 and 2. The detailed steps to determine the yield strength corresponding to the appropriate depth point from the indentation load-depth curve can be found in Sec. V.C.
Indentation load–depth curve by a cylindrical flat-tip indenter.

During the linear elastic unloading process, as shown in Fig. 2, the unloading force, P, on the indenter can be calculated based on the indentation depth, h, the reduced elastic modulus, E r, can be calculated based on the stiffness, S, and Young's modulus of the specimen can be calculated, referring to Eqs. (1) and (5)–(7) in Ref. Reference Hu, Lynne, Markondapatnaikuni and Delfanian27.
III. COMPUTER MODELING
A. Tensile tests
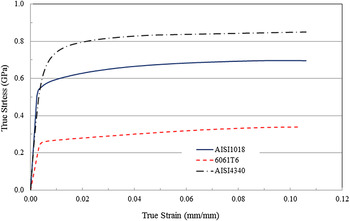
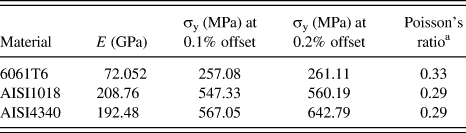
To validate the materials' elastic–plastic property characterization methodology and to provide material properties for modeling input, uniaxial tensile tests were performed. The materials to be investigated include aluminum alloy 6061T6, low carbon steel AISI 1018, and alloy steel AISI 4340. The materials were cut and machined, and several tensile testing specimens were prepared for each material. The machine used for tensile testing was the MTS 370 LandMark. The tests were done according to ASTM E8/E8M-11.63 The rate for the MTS machine was set to 0.6 in./min (0.254 mm/s) for the aluminum and 0.06 in./min (0.0254 mm/s) for the steel. The extensometer was 20 mm. The machine took real-time measurements at a rate of 50 readings per second. The load–displacement data from the tests were converted into engineering stress–engineering strain and true stress–true strain data. Figure 3 shows the average true stress–true strain curves of each material. Some important material properties were analyzed and are listed in Table I.
Average true stress–true strain curves for materials of 6061T6, AISI1018, and AISI4340.

Average elastic–plastic data of 6061T6, AISI1018, and AISI4340 from tensile tests.
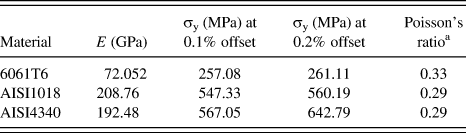
a From the MatWeb.com.
B. Nanoindentation FEA model generation
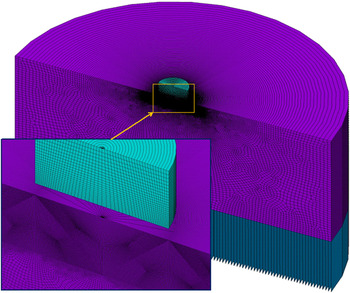
Commercial FEA software ANSYS® version 14.5 (Ref. 64) was used for modeling the cylindrical flat tip indentation test. An axisymmetric model was built, assuming that the specimen and indenter are perfectly symmetrical along the vertical axis. Elements used are PLANE182 for specimen making 21,890 elements and for the indenter 625 elements. The elements have nonlinear capabilities, such as large strain, large deflection, and elasto-plastic stress–strain. For modeling contact between the indenter and the specimen, two element types were adopted, i.e., TARGE169 for indenter and CONTA171 for the specimen composing of 95 elements. Coulomb and shear stress friction are allowed. Since the elastic properties of the specimen measured by modeling the nanoindentation are sensitive to the thickness of the specimen presented in the model and the dimensions in the FEA model are limited due to the limitation of the total number of elements and computational time. Therefore, to suppress the thickness effect, spring elements of COMBIN14, a 2D linear longitudinal spring vertically connected to each node on the bottom of the model, were used.
In understanding the indentation process, it is known that the region of interest lies directly underneath the edge of the indenter. This is the edge where yielding will firstly begin, caused by stress being theoretically near an infinite value, as shown in Eq. (1).Reference Sneddon57–Reference Barquins and Maugis59 Therefore, the mesh density was checked and refined in an indenter tip and testing specimen near the indenting edge areas to improve modeling accuracy. The model is 100 µm in diameter with a height of 50 µm for the specimen and 9.318 μm in diameter for the cylindrical flat-tip indenter (the same diameter for the indenter used in the testing). The proper element size, total elements, and total nodes were determined as in the current model through a convergence study of the indentation load versus depth so that the model in Fig. 4 is mesh-independent.
Axisymmetric FEA model of indenter and specimen (light blue: indenter tip elements; dark blue: spring elements; and purple: specimen elements).

C. Modeling results
True stress and true strain extracted from tensile tests were imported into the FEA model. Young's modulus, hardness, indenting pileup, and 0.1 and 0.2% offset yield strengths were extracted from the indentation tests by computer modeling. Effects of indentation depth and friction on indentation testing results were analyzed.
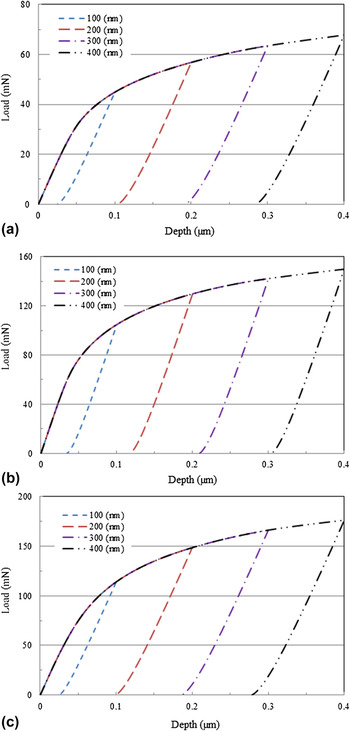
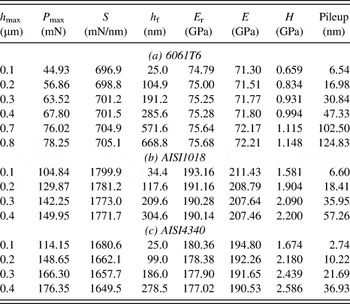
Figure 5 displays indentation load versus depth curves using the cylindrical flat-tip indenter with indentation depth ranging from 100 to 400 nm. Table II lists properties measured for each indentation under different indentation depths. The friction coefficient for each indentation is 0.15.
Indentation load versus depth curves by modeling. (a) 6061T6; (b) AISI1018; and (c) AISI4340.

Indentation testing data for different depths (h max).

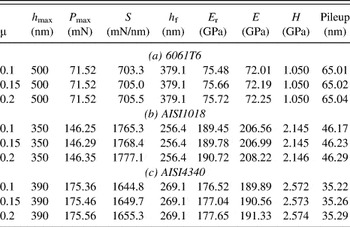
Table III lists properties measured for each indentation with friction coefficient ranging from 0.1 to 0.2.
Indentation testing data for different friction coefficients (µ).

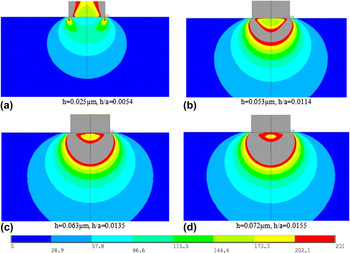
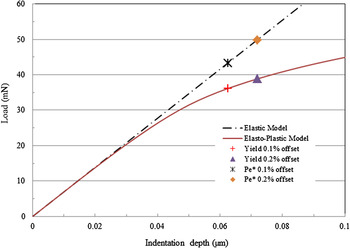
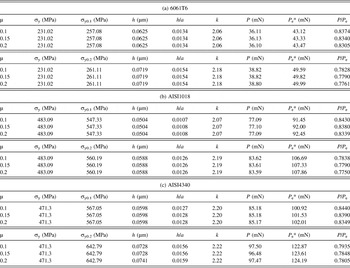
Modeling was done to find 0.1 and 0.2% offset yield strengths of the 6061T6 specimen with different friction coefficient values. Figure 6 displays the development of the von Mises stress in the 6061T6 specimen as the indentation depth increases. The values over 231 MPa are shown in gray. It can be seen that as the indentation process begins yielding is already taking place in the specimen at the edge of the indenter. The yielding profile of the specimen is shown to be circular at appropriated indentation depth as mentioned by Hu et al.Reference Hu, Lynne, Markondapatnaikuni and Delfanian27 and Johnson.Reference Johnson65Figure 7 displays the 0.1 and 0.2% offset yield points of the material on the load–depth curve. Modeling was also done to find the yield points of AISI1018 and AISI4340 with different friction coefficient values, using the same procedures as for 6061T6. The modeling data are listed in Table IV.
Development of von Mises stress (MPa) of 6061T6 with a friction coefficient of 0.15 at different depths.

Elastic and elasto-plastic indentation load versus depth curve with offset yield points for 6061T6.

Load analysis at 0.1 and 0.2% offset yield strength under different friction coefficients (µ).

IV. MICRO-/NANO-INDENTATION TESTS
A. Indentation sample preparation
The indentation samples were cut from the cold-formed circular bars using a lathe, the same batches of materials for tensile testing specimens, to lengths of 12.7 mm (0.5 in.). Three specimens of the 6061T6, two specimens of AISI 1018, and three specimens of AISI 4340 were cut. The specimens were each molded with epoxy using the LECO PR-32 805-600 molding machine to a diameter of 31.75 mm (1.25 in.) and a height of 25.4 mm (1.0 in.), so they could be held by the polishing machine. The specimens were polished in seven steps using the Qualitest DigiPrepBase 250 to get high quality surface finish of the specimens. Steps 1 through 4 used a polishing pad of 240, 360, 600, and 1200 grit abrasive paper, respectively, water as the lubricant, 100 RPM counter clockwise with a force of 20 N. Steps 5 and 6 used 6 µm DIAMAT diamond on TEXPAN pad and 1 µm DIAMAT diamond on ATLANTIS pad, respectively, with a DIALUBE purple Extender as the lubricant, a speed of 100 RPM CCW with a down force of 15 N. Step 7 used a 0.05 µm alumina on a NAPPAD pad with no added lubricant, 200 CW, and a down force of 10 N. As the polishing pad would wear, it would be replaced. The lubricant DIALUBE purple extender was added to the polish pad before beginning the polishing. The 6 and 1 µm DIAMAT diamond was sprayed onto the polishing pad every 20 s during the polishing process. In step 7, the 0.05 µm alumina was poured onto the NAPPAD pad, until the pad was fully covered before polishing.Reference Hu, Lynne, Markondapatnaikuni and Delfanian27
Surface roughness is very important when performing micro/nano-indentation tests. To achieve indentation results within five percent deviation of the true value, it is necessary to have the indentation depth greater than 20 times the arithmetic roughness R a.12 The surface roughness was measured with the KEYENCE VK-9710 Color 3D Violet Laser Scanning Microscope. The lens used to measure the roughness was of 150x magnification, and the magnification of the microscope was 18,000x. The surface roughness average values for the specimens of 6061T6, AISI 1018, and AISI 4340 were 0.023 ± 0.002 µm, 0.0155 ± 0.0015 µm, and 0.0146 ± 0.0011 µm, respectively.Reference Hu, Lynne, Markondapatnaikuni and Delfanian27 Before indentation testing, the microscope in the indentation tester was used to find the least rough area within each sample for the testing.
B. Micro/nano-indentation setup
To know the true dimensions of the indenter, it was first scanned with the 3D Laser Scanning Microscope. The magnification used for the scan was 1800x. Four indenter diameter locations were measured by using the profile line function in the laser microscope, and the measurement was set with a threshold of 10 nm depth. The average line length for the diameter measurement was found to be 9.318 μm giving an area of 68.19 µm2.
The Nanovea's nanoindentation module was used to perform the indentations using the cylindrical flat-tip diamond indenter. The nanomodule specifications include a load range of 400 mN, theoretical load resolution of 0.08 µN, depth range of 25 μm, and theoretical depth resolution of 0.003 µm. The specimen was placed on the controllable stage in the NANOVEA testing platform.Reference Hu, Lynne, Markondapatnaikuni and Delfanian27
C. Micro/nano-indentation test
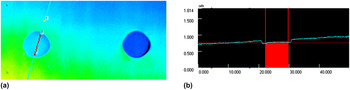
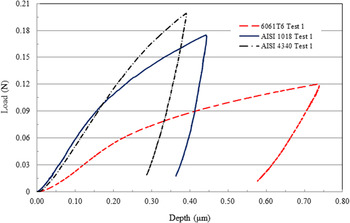
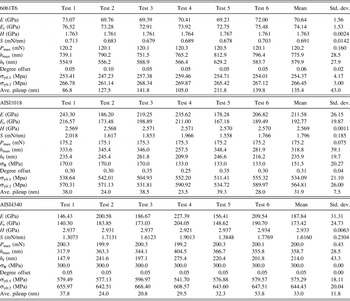
The indenter was installed in the NANOVEA to undergo testing. The parameters of the test were set to an approach speed of 1 µm/min, contact load of 0.1 mN, and load rate of 40 mN/min. The maximum loads for 6061T6, AISI 1018, and AISI 4340 were set to 120, 175, and 200 mN, respectively. It was found after viewing the indentation with the laser microscope that the specimen/indenter was tilted near 1 degree from the horizontal plane of the indenter tip. With the flat-tip indenter, this created significant error for finding the yield point of the material from the indentation test load–displacement graph. For solving this issue, aluminum foil was used underneath the specimen to correct sample–indenter tilt. The sample is held securely to guarantee that the sample will not tilt or shift during handling and testing. Samples were indented and then moved to the microscope to verify that an acceptable smaller indentation angle had been reached. Figure 8(a) displays the specimen's surface scanned by the laser microscope. A red profile line is drawn across the left indentation in the figure such that the maximum to minimum height of the indentation is to be measured. The laser microscope will allow for calculating the angle of the specimen's surface based on the profile line. The profile line is broken up into two regions, the indentation region and the entire profile line, as shown in Fig. 8(b). By taking the difference of the angles measured, the true indentation tilted angles were found, i.e., 0.06° for 6061T6, 0.31° for AISI 1018, and 0.05° for AISI 4340. Figure 9 shows the sample indentation testing load versus depth curves for different materials. Table V lists the indentation test data and derived results for different materials. The laser microscope was used to find the maximum pileup from the indentation. The experimental results show that the elastic modulus varies with a high standard deviation, indicating that the experimental data are not accurate due to several error sources.
Specimen/indenter tilted angle measurement: (a) profile line selection from surface specimen surface measurement and (b) profile measurement (unit: µm).

Sample load versus depth curves of the different materials.

Nanoindentation test data and derived results for different materials.

V. RESULTS AND DISCUSSION
A. Effect of indentation depth
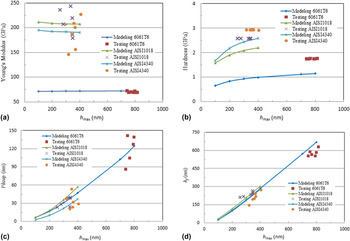
Indentation tests with different indentation depths were modeled to understand the effect of the level of depth. The indentation modeling and testing data listed in Tables II and V are plotted in Fig. 10. The modeling results show that the indentation depth has very little effect on Young's modulus of the specimen (<±1% corresponding to the indentation depth of 0.1–0.4 µm). The hardness values measured by testing are higher than that by modeling, and one of the error sources possibly comes from the residual stress in the specimens. The pileup and final depth increase as the indentation depth increases, and the testing data are in agreement with the modeling data. The other error sources include indentation angle being not perfectly perpendicular to the specimen testing surface and the indenter contact surface being not truly flat.
Indentation modeling and testing data with varying indentation depth. (a) Young's modulus; (b) hardness; (c) pileup; and (d) final depth.

B. Effect of indentation friction coefficient
Indentation tests with different friction coefficients were modeled and the modeling data are listed in Tables III and IV. The values chosen for friction were based on the research performed by Yurkov et al.Reference Yurkov, Skvortsov, Buyanovsky and Matvievsky66 They investigated sliding friction of diamond on steel, aluminum, and fused silica. Their work showed that the friction coefficient varied between 0.1 and 0.2. The modeling results show that the effect of the friction coefficient on indentation testing is very little and can be ignored.
On the other hand, since the Poisson's ratios of the three testing materials are very close (listed in Table I), by comparing the P e* value in Table IV at the same indentation depth and the same friction coefficient, it can be seen that for a perfect elastic indentation, the indentation load P e* is proportional to the Young's modulus of the specimens E and the ratio of the indentation depth to the indenter radius h/a, as shown in Eq. (2).
C. Yield strength
Modeling results, as shown in Table V and Figs. 6 and 7, revealed that for 6061T6 the elasto-plastic model reaches 0.1 and 0.2% offset yield points when the indentation load ratio of the elasto-plastic specimen to the perfect elastic materials, P/P e, reaches (83.4 ± 0.3)% and (77.9 ± 0.29)%, respectively. For AISI1018, the elasto-plastic model reaches the 0.1 and 0.2% offset yield points when P/P e reaches (83.8 ± 0.5)% and (77.9 ± 0.4)%, respectively. For AISI4340, the elasto-plastic model reaches the 0.1 and 0.2% offset yield points when P/P e reaches (83.9 ± 0.5)% and (78.6 ± 0.7)%, respectively. Table IV lists the offset yield strength values with the corresponding loads for all three materials. The modifier k in Eq. (20) was identified for extracting the yield point from indentation tests. Table VI lists the yield strengths obtained from modeling and compared with that from the testing. By using the modifier k at the appropriate yield point P/P e, the indentation tests can provide reliable 0.1 and 0.2% offset yield strengths for these materials with acceptable error.
Yield strength measurements by modeling and testing.

D. Residual stress
For better understanding the error source from the specimen preparation, the residual stresses were measured on the 6061T6, AISI 1018, and AISI 4340 samples. The Proto Manufacturing LXRD Laboratory Non-Destructive Residual Stress Measurement System was used. To calibrate the system, a calibration block of steel with a stress of −526 ± 20 MPa was used. The average reading from the calibration block certification was −528.03 ± 2.05 MPa.
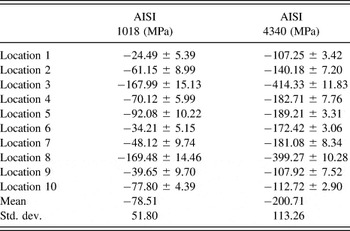
The LXRD was used to scan the samples at five locations in the x-direction and y-direction, respectively, as shown in Fig. 11. The scan locations are numbered, and the spacing between the centers of two adjacent scan locations was set to 2 mm. Aluminum 6061T6 had its residual stress measured on the surface. The error of the measurement was greater than the stress, indicating that the residual stress could not be measured in this material. Table VII lists the results of the residual stress for AISI1018 and AISI4340 specimens. The residual stresses for both 1018 and 4340 are significant, especially on the central area of the specimens (locations 3 and 8). It can be seen from the experiments that the hardness values are higher than the modeling results, indicating that strain hardening has occurred on the surface of the specimen. The indentation test validates the LXRD results of the residual stress in the specimen. The effect of the residual stress values on indentation testing measurements must be considered.
Residual stress scan locations in the sample. (a) Indentation specimen and (b) scan location numbering.

Residual stress measurements for AISI1018 and AISI4340 specimens.

E. Comparison with other classical pointed-shaped tip indenters
Compared with classical pointed-shaped indenters, such as Berkovich, Vickers, Knoop, conical, or spherical tip, the cylindrical flat-tip indenter has the following advantages: It has a constant contact area allowing for the indenter to press on the specimen, which makes the measurement size (diameter) insensitive, can suppress the uncertainties in measuring material properties, and makes the elastic property and yield strength formulation derivation much easier and calculation simpler. It quickly reaches the hemi-spherical elastic–plastic state, which makes the measurements possible at the least penetration depth to probe the elastic and plastic properties of a material, which greatly benefits the material micro-/nanoscale characterization. However, the measurement by the cylindrical flat-tip indenter is sensitive to the perpendicularity of the tip axis to the specimen surface, especially at the low penetration, i.e., low indentation depth. Therefore, special attention should be paid for carefully controlling the perpendicularity to conduct reliable measurements. While the indentation measurements by the classical pointed-shaped tip indenters are insensitive.
VI. CONCLUSIONS
This study shows that the elasticity and yield strength of metallic materials can be characterized through a micro-/nano-indentation test by using a cylindrical flat-tip indenter. The mechanical model proposed for directly extracting the yield strength of the tested materials, based on the hemi-spherical stress–strain distribution assumption, has been analytically derived and numerically validated. The corresponding load point, P/P e, in the indentation load–depth curve and the modifier, k, for extracting the yield strength have been identified. Indentation testing for aluminum alloy 6061T6, low carbon steel AISI1018, and alloy steel AISI4340 has been conducted by computer modeling and validated by experiments. The results by computer modeling are in agreement with the results by testing. The computer modeling results also show that the effect of contact sliding friction on the indentation testing measurements can be negligible. However, the indentation tests and residual stress measurements show that residual stress in the specimen must be considered as one of the important error sources for the testing.
ACKNOWLEDGMENTS
This work was supported by the Materials Evaluation and Testing Lab (METLAB), the Department of Mechanical Engineering at South Dakota State University, and the State of South Dakota. Help from Zachary J. Rykhus for measuring residual stresses and computational facility support from Bryan Rieger at University High Performance Computing, the College of Engineering at South Dakota State University are gratefully acknowledged.