I. INTRODUCTION
Cubic silicon carbide (3C–SiC) is regarded as a very promising candidate for high power and high frequency device applications since 3C–SiC allows for good overall electrical properties. Actually, the main limitation for device realization on such a material comes from the wafer fabrication. Furthermore, the development of 3C–SiC-based electronics is limited by the defect density that is very high with respect to the α-SiC counterpart. Crystallographic defects are extended from the interface up to the film surface, with microtwins and antiphase boundaries (APBs) observed as vanishing defects in thicker films.Reference Yun, Takahashi, Mitani, Ispida and Okumura1–Reference Severino and La Via3 The main limitation of 3C–SiC comes from stacking faults (SFs) since their propagation throughout the epitaxial film causes device failure and their linear density, using conventional Si substrates, at the film surface is still high (ρSF ∼ 104 cm−1).Reference Polychroniadis, Syvajarvi, Yakimova and Stoemenos4–Reference Nagasawa, Yagi, Kawahara, Hatta and Abe6 So far, the heteroepitaxial growth of 3C–SiC by chemical vapor deposition (CVD) methodology on Si is the most used and promising approach to achieve large-area single-crystal 3C–SiC wafers despite the large lattice mismatch and different thermal expansion coefficients between the two materials.Reference Nishino, Powell and Hill7, Reference Reyes, Shishkin, Harvey, Saddow, Dudley, Capano, Kimoto, Powell and Wang8 The community of 3C–SiC growers throughout the world proposed a wide number of studies where Si substrates with several orientations and off-cut angles have been tried to reduce the negative effects of lattice and thermal mismatches on the structural properties and morphology of 3C–SiC films.Reference Nishiguchi, Nakamura, Nishio, Isshiki and Nishino9, Reference Severino, Camarda, Condorelli, Perdicaro, Anzalone, Mauceri, La Magna and La Via10 Beyond the aforementioned defects, a strong wafer bow is always detected due to the high residual stress stored by the heteroepitaxyReference Severino, Bongiorno, Piluso, Italia, Camarda, Mauceri, Condorelli, Di Stefano, Cafra, La Magna and La Via11, Reference Zielinski, Ndiaye, Chassagne, Juillaguet, Lewandowska, Portail, Leycuras and Camassel12 as well as voids underneath the interface with Si are often observed.Reference Severino, D’Arrigo, Bongiorno, Scalese, Foti and La Via13, Reference Portail, Zielisnki, Chassagne, Roy and Nemoz14 By acting on the structure and on the properties of the substrate, it is possible to achieve a better compliance from heteroepitaxy.Reference Zgheib, McNeil, Kazan, Masri, Morales, Ambacher and Pezoldt15, Reference Abe, Komiyama, Suzuki and Nakanishi16 Different examples can be found in the literature: good-quality 3C–SiC film growth on silicon-on insulator was reported with the buried oxide layer effective in suppressing the growth of voids and reducing stress.Reference Möller, Krötz, Eickhoff, Nielsen, Papaioannou and Stoemenos17 Another interesting way to remain compliant would be to use porous silicon (p-Si). Namavar et al.Reference Namavar, Colter, Planes, Fraisse, Pernot, Juillaguet and Camassel18 studied 3C–SiC growth on a 50% p-Si and they compared it with 3C–SiC growth on SIMOX substrates (Separation by IMplantation of OXygen). From this study, they showed a 30% decrease in the density of structural defects at the SiC/Si interface for growth on porous material. An important outcome in the growth on compliant substrates was proposed by Nagasawa et al.Reference Nagasawa, Yagi and Kawahara19 with their undulant Si concept found to be effective in the reduction and elimination of planar defects, such as twin boundaries and APBs, in 3C–SiC heteroepitaxial layers on (001) Si substrates. To ensure the effects of the undulant Si substrate, the entire surface of (001) Si must be covered with continuous undulations, where ridges are aligned in the  $[\bar 110]$ direction. With the growth technique of switch-back epitaxy, a 200-μm-thick 3C–SiC film was grown using a large area (6 inch) undulant Si substrate.Reference Nagasawa, Yagi, Kawahara, Hatta, Pensl, Choyke, Yamada, Itoh, Schöner, Choyke, Matsunami and Pensl20 Notwithstanding these important innovations brought by Nagasawa et al.Reference Schöner, Krieger, Pensl, Abe and Nagasawa21, Reference Nagasawa, Abe, Yagi, Kawahara and Hatta22 with the demonstration of good performance vertical and lateral metal oxide semiconductor field-effect transistors (MOSFETs), 3C–SiC technology must be further improved to realize marketable devices in the medium and high power electronics and sensors for high temperatures and harsh environments. This is mainly due to the still high SF density since SFs are electrically active defects that cause degradation of the device yield with very high level of leakage current in the device. A recent published work has shown as this density has been reduced below 103 cm−1 and, by properly modifying the substrate, it can be further reduced below 102 cm−1.Reference Nagasawa, Kawahara, Yagi, Hatta, Uccida, Kobayashi, Reshanov, Esteve and Schoner23 In this study, we start from the undulant Si substrate idea introducing another approach to favor the geometrical reduction of defects in both the
 $[\bar 110]$ and
 $[\bar 1\bar 10]$ direction. The substrate here proposed is obtained by patterning the surface to realize Inverted Silicon Pyramids (ISP) with a squared base of 1 μm2, covering the whole 6-inch (001) Si wafer. The paper will be focused on the material characterization of 3C–SiC thin films grown on ISP and on conventional (001) Si substrates, by means of several techniques, resulting a deeper inspection of what presented previously in a conference proceeding.Reference D’Arrigo, Severino, Milazzo, Bongiorno, Piluso, Abbondanza, Mauceri, Condorelli and La Via24Evaluation of film morphology, stress evolution, and defect-related effects are discussed by comparing films grown on both substrates under identical growth conditions. It will be shown that ISP substrate provides beneficial effects in stress relaxation, but further improvements must be considered on the process conditions to decrease wafer bow and defect density up to values suitable for good device performances.
II. EXPERIMENTAL DETAILS
In this section, it will be first presented the processing required to realize the ISP substrate followed by the description of experimental conditions within CVD reactor during the growths. Structures were fabricated with standard g-line optical lithography, using a 5x Canon projection system, followed by an anisotropic KOH etching in wet solution using a silicon dioxide mask to obtain inverted pyramids with the walls lying along four {111} planes on a 500-μm-thick (001) Si wafer. The approach is wafer size independent with such a substrate preparation suitable from 2- to 12-inch (001) Si wafers. Substrates were then characterized by scanning electron microscopy (SEM) and atomic force microscopy (AFM).
Growths were performed at the Epitaxial Technology Center (ETC, sited in Catania), within a LPE ACISM8 CVD reactor, using a deposition temperature of 1380 °C, a C/Si ratio of 1.4 and a Si/H2 ratio between 0.032%. Trichlorosilane (SiHCl3 or TCS), ethylene (C2H4), and hydrogen (H2) as the silicon and carbon precursors and gas carrier, respectively, were used to grow 3C–SiC film of different thicknesses, namely 1, 3, 6, and 9 μm. The growth rates used were maintained to 5 μm/h for all the samples. For this set of samples, optimum carbonization conditions, i.e., uniform surface conversion with lateral growth of the initial SiC nuclei, were found at a reaction temperature of 1120 °C and a C2H4 flow rate of 120 sccm while flowing H2 gas carrier at 100 slm. Reactor chamber pressure was held at 100 mbar during the entire growth process. Chlorosilane precursor was observed to be a better choice than SiH4 as it gives the benefit of Cl addition during the reaction.Reference Anzalone, Severino, D’Arrigo, Bongiorno, Abbondanza, Foti, Saddow and La Via25 Thinner samples, about 0.3-mm thick, were grown at the University of South Florida (Tampa) with a process described in Ref. Reference Severino, Frewin, Bongiorno, Anzalone, Saddow and La Via5 in low pressure conditions, using a chemistry system with silane (SiH4) and propane (C3H8) as silicon and carbon precursors, respectively, and H2 as gas carrier. After the carbonization, the growth process was then held for about 5 min at a growth temperature of 1380 °C and a working pressure of the reactor of 75 mbar. For a better evaluation on the impact of the ISP substrate on the resulting 3C–SiC films, each growth process has been conducted simultaneously on both ISP and conventional (001)Si.
After 3C–SiC deposition, several characterization techniques were used to analyze the samples. The film thickness was measured by Fourier Transform Infrared Spectroscopy on both types of samples. Surface roughness and profile analysis have been observed by AFM (Park Systems Model XE-100, Santa Clara, CA) and optical interferometer (WYKO NT1000, Veeco Instruments, Plainview, NY). μ-Raman spectroscopy (Horiba Jobin Yvon LabRam HR8000, Tokyo, Japan), x-ray diffraction (XRD, Bruker D8 Discover, Karlsruhe, Germany), and SEM (ZEISS SUPRA 35, Carl Zeiss, Oberkochen, Germany) were then used for material quality, morphology, and stress evaluation, while transmission electron microscopies (TEMs) (JEOL JEM 2010, Tokyo, Japan) in plan view and in cross section were conducted to study the microstructure and to determine the linear SF densities of different samples.
III. EXPERIMENTAL RESULTS
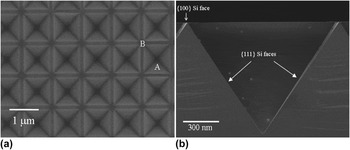
SEM micrographs of the substrate in an intermediate etching state, after the silicon dioxide mask dissolution, are reported in Fig. 1. It is possible to observe that the ISP structure presents the sides of the pyramids parallel to the (111) planes and small regions between each pyramid with a surface parallel to the {100} plane. Details about substrate preparation can be found in Ref. 26.
SEM micrographs of inverted pyramids, in an intermediate etching step after the silicon dioxide dissolution, fabricated on (001) Si surface in plan view (a) and in cross section (b). The periodicity of the structures is clearly visible. A pitch of 1 μm has been used. In (a), A and B denote the different nucleation sites on the surface for the subsequent 3C–SiC growth. In (b), exposed planes at the surface are shown.

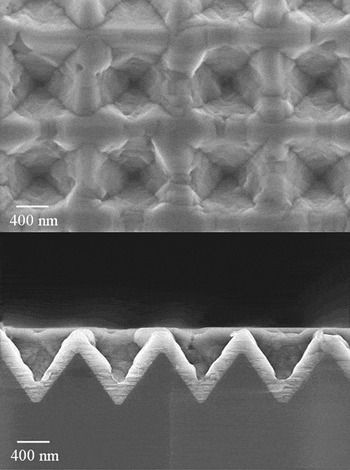
Some considerations on the early stage of growth on ISP were allowed by performing SEM both in plan view and in cross section of the thinnest 3C–SiC (about 0.3-μm thick) film. As reported in Fig. 2, a good step coverage is observed for the growth of a thin 3C–SiC film on ISP. It is worth to note that the depth of the pyramids plays a crucial role during this growth step since adatoms from the gaseous phase have higher probability to be absorbed on the topside (ridges) of the pyramid than on the bottom (valleys). This leads to a local difference in film thickness moving away from the bottom to the top of each pyramid, with a higher nonuniformity in film thickness for very thin films (about 20% for an average thickness of 0.3 μm).
Plan view SEM micrograph of 3C–SiC/ISP sample with a film thickness of about 300 nm (upper). SEM image in cross section of the same sample (lower). Pyramid ridges and sidewalls provide for different nucleation sites for 3C–SiC, with higher growth rate on ridges due to a higher absorbed material supplied from gaseous phase. On the sidewalls, a (111) 3C–SiC film surface can be observed with a lower growth rate. This sample shows nonuniformity in thickness of about 20% due to the different step coverage.

Due to the geometry of the pyramids, the sidewalls will provide the surface for the nucleation sites of 3C–SiC nuclei during the carbonization step. As soon as the growth starts, after the carbonization step, the four {111} 3C–SiC surfaces, growing on the four walls of each pyramid, show opposite growth fronts. The growth fronts are then stimulated to meet one another coalescing in a common surface, nearly parallel to the <100> direction. This coalescence phenomenon starts in the central zone of each pyramid at the very bottom for very thin films. This new growth front grows further for longer growth runs, i.e., for thicker 3C–SiC films, leaving in the coalescence region a crystal disorder that acts as a path for stress relaxation and reducing the nonuniformity of the 3C–SiC film to a value of about 10% for 1-μm-thick film. The consequences of this growth mode are studied performing TEM and μ-Raman spectroscopy to evaluate the structural order and the residual stress of the system. For a 1-μm-thick 3C–SiC film, hollow voids are observed at the center of each pyramids indicating depressions in those zones as a consequence of the substrate surface geometry and, in particular, to the lateral size of the pyramids. One has to take into account this detail when very thin films are required for the desired application scaling down, eventually, the pyramid lateral size.
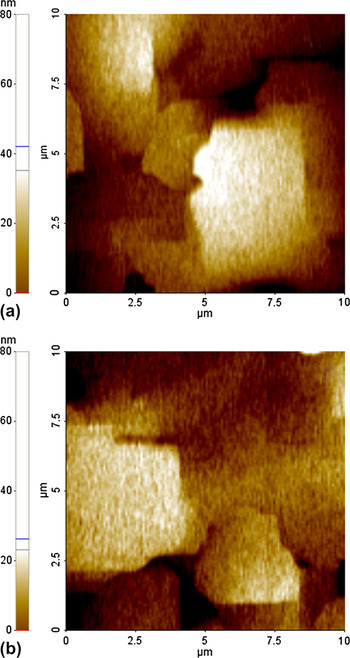
For a 6-μm-thick 3C–SiC film, uniform and flat film morphology has been observed and a high uniformity in film thickness is achieved. Surface morphologies of 6-μm-thick 3C–SiC films grown on ISP and (001) Si have been analyzed conducting AFM, as shown in Fig. 3. By comparing the root-mean-square values on an area of 10 × 10 μm2, a surface roughness of 11.66 nm was detected on 3C–SiC/ISP sample, while in the case of the reference sample grown on (001) Si, the surface roughness was 17.81 nm. However, surface roughness values presented in this work are higher than others published previously for p-type 3C–SiC films grown on (001) Si grown with an optimized carbonization process aided by the introduction of silane.Reference Wagner, Schmidbauer, Irmscher, Tanner and Fornari27It is reasonable to think that a further optimization of growth process, i.e., with the addition of a Si-gaseous precursor in the early stage of growth to reduce the defect generation in 3C–SiC film and void density at the silicon carbide/silicon interface, would help in reducing the surface roughness for 3C–SiC films grown on ISP as well.
AFM images, on an area of 10 × 10 μm2, of 3C–SiC film surfaces grown on (a) (001) Si and (b) ISP substrate. 3C–SiC films are about 6-μm thick. 3C–SiC surface roughness values of 11.66 and 17.81 nm were detected for growth on ISP and (001) substrates, respectively.

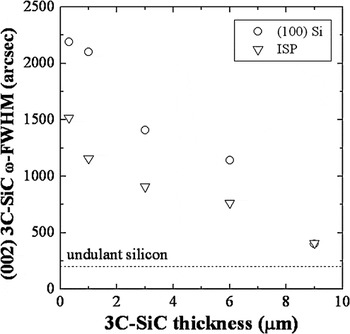
A study of the full width at half maximum (FWHM) of the XRD rocking curve (RC) relative to the 3C–SiC {200} planes has been conducted, as a useful nondestructive analysis, to evaluate the film quality. The diffractometer used is a Bruker D8 Discover with a Cu Kα source at a wave length of 1.54 Å and a (022) Ge crystal monochromator ensuring low-divergence high-monochromatic x-ray probing beam. XRD measurements conducted on the surface symmetric reflection ensure a penetration depth close to 10 μm for the (200) reflection of 3C–SiC (incident angle of about 20.5°), so that the diffracted signal is averaged by integrating over the entire film thickness from the heterointerface up to the film surface. The illuminated area on the surface of the probing beam is about 45 mm2, being the fingerprint diameter of the x-ray beam on the surface of about 7.5 mm, so that the lateral spatial resolution is quite low. The trend of the RC FWHM with the film thickness is reported in Fig. 4 where there are shown FWHM values obtained for films grown on both substrates with different final thicknesses. The dashed line reports the FWHM value, measured with the same diffractometer, of a 2-inch 3C–SiC bulk wafer grown on undulant silicon provided by Hoya. An improvement in the overall crystal quality, suggested by lower values of FWHMs for 3C–SiC/ISP samples, is reported as shown in Fig. 4. Only when thicker 3C–SiC films are considered (about 9 μm in thickness), RC FWHMs reach similar values of about 400 arcsec, regardless from the substrate used. It is worth noting that the broadening of a RC is related to several factors and, among the others, important contributions to this broadening are determined by curvature and crystal disorder (defects). As will be shown later, 3C–SiC/ISP samples show a lower defect density but a higher wafer bow (increasing with the film thickness) if compared to reference samples. As a consequence, when 9-μm-thick 3C–SiC films are considered, the weight of the curvature-related broadening is higher in the 3C–SiC/ISP sample with respect to the reference sample, while the defect-related broadening is lower. These two separated contributions to the broadening lead to similar values of 400 arcsec in RC FWHMs of 9-μm-thick 3C–SiC films grown on both substrates despite of the lower defect density observed in the 3C–SiC/ISP sample. Of course, these are not the best values found in literatureReference Wagner, Schmidbauer, Irmscher, Tanner and Fornari27and, as for surface roughness, further improvements can be achieved by optimizing the growth process, i.e., by lowering the growth rate to reduce defect density.Reference Anzalone, Locke, Carballo, Piluso, Severino, D’Arrigo, Volinski, La Via and Saddow28
Trend of FWHMs of the XRD RC of 3C–SiC {200} planes as a function of 3C–SiC film thickness for 3C–SiC/ISP samples (triangles) and reference samples (circles). The FWHM of the same RC measured on a 200-μm-thick wafer grown on undulant substrate is reported as dashed line. All the measurements are performed with the same experimental conditions.

These trends were confirmed by performing μ-Raman spectroscopy with an excitation wave length supplied by a He–Cd laser (λ = 325 nm) that has a penetration depth in 3C–SiC of about 3 μm. Raman spectra show the presence of the transverse optical (TO) phonon mode (ωTO 3C–SiC), prohibited in cubic semiconductors but here observed because of the presence of crystallographic defects in 3C–SiC. So, the FWHM of this peak, located at ω0 = 796 cm−1 in the frequency spectrum under stress-free conditions, is another experimental indicator useful to determine the short-range periodicity of the analyzed crystal. A Raman map on an area of 50 × 50 μm2 was performed by taking more than 100 experimental points to obtain the FWHM of the TO mode with a very high signal-to-noise ratio and improve the statistical distribution.
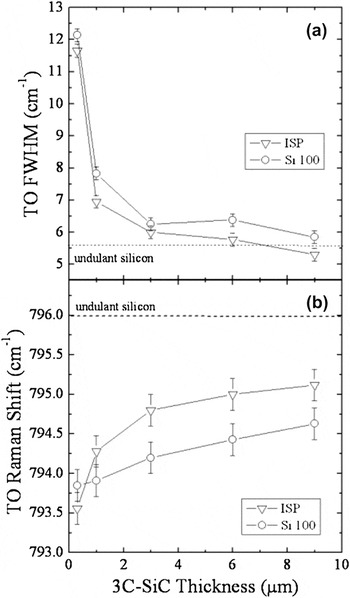
In Fig. 5(a), trends of ωTO 3C–SiC FWHM with the film thickness are reported indicating narrower widths for 3C–SiC films grown on ISP with respect to reference samples. The illuminated area, i.e., the laser spot on the surface, of each spectrum with μ-Raman spectroscopy is limited to 30 μm2 allowing a very high lateral spatial resolution as compared to that one offered by the XRD, whose illuminated area is about 45 mm2. Moreover, the penetration depth of the laser used in Raman spectroscopy is limited to about 3 μm in a 3C–SiC film, while the x-ray probe penetrates deeply (about 20 μm for the used Bragg angle of about 20°). As a consequence, the difference reported in the ωTO 3C–SiC FWHMs also for the thickest samples considered, as shown in Fig. 5(a), is an indicator of an improved film quality of the 3C–SiC/ISP sample. In Fig. 5(a), it is also reported the measurement of the TO FWHM obtained on 2-inch 3C–SiC bulk wafer (dashed line) by Hoya. By taking into account the thickest films of this work and comparing their TO FWHMs with the one measured in the 3C–SiC bulk wafer, it is possible to observe a reduction of this value for the 3C–SiC/ISP sample suggesting a lattice periodicity presented by the 9-μm-thick 3C–SiC/ISP sample at the surface comparable with that one of a very thick (about 200 μm) 3C–SiC bulk wafer.
Trends of the TO FWHM (a) and of the TO Raman shift (b) as a function of 3C–SiC film thickness for 3C–SiC/ISP samples (triangles) and reference samples (circles). The value measured under the same experimental conditions on a 200-μm-thick wafer grown on undulant silicon substrate is reported as dashed line.

By considering now the shift of the ωTO 3C–SiC Raman mode, shown in Fig. 5(b), this is mainly due to the stress nature involved in the entire substrate/SiC system. A displacement of the Raman shift from ω0 toward lower values indicates a residual stress of tensile nature, while a displacement toward higher values than ω0 represents a compressive stress. In this work, all the samples analyzed showed a redshift indicating a tensile stress stored in the 3C–SiC films. The amount of the residual stress in 3C–SiC was higher for thinner films, i.e., the Raman shift is more pronounced toward lower frequency, and decreased by increasing the film thickness. It is interesting to note that, in thicker 3C–SiC films, the Raman shift tends toward the value of the ωTO 3C–SiC Raman mode measured on a HOYA 3C–SiC wafer, which is approaching the stress-free conditions. Furthermore, by analyzing the LO Raman mode of Si in the vicinity of the heterointerface, a blueshift is detected with a Raman shift toward higher frequency than the typical frequency ω0 = 520.5 cm−1. Thus, at the heterointerface, the tensile stress found in 3C–SiC is counterbalanced by a compressive stress observed in Si, as shown in some previous works.Reference Zhu, Zhu, Nishino and Pezzetti29, Reference Huang and Zhang30 Some interesting comments can be done by observing Fig. 5(b), where TO Raman shifts as a function of the 3C–SiC film thickness are reported for samples grown on both substrates. If one looks to the trend shown by reference samples (open circles), a linear trend is observed indicating a constant reduction of the residual stress by growing thicker films. On the other hand, 3C–SiC samples grown on ISP substrate show a notably different behavior when thin films are considered, while a linear trend is recovered when thicker films are analyzed. In fact, for thickness below 3 μm, a very strong shift in frequency of about 1.5 cm−1 of the TO Raman mode is detected. This strong shift for thin films, corresponding to a very intense reduction of the residual stress during the first microns of growth, can be associated to the early stages of growth, described at the beginning of this section.
IV. DISCUSSIONS
The first experimental data of 3C–SiC/ISP sample, relative to the thinner film (about 0.3-μm thick), show a higher redshift of the TO Raman mode compared to the reference sample, implying a higher residual stress stored in the 3C–SiC/ISP sample. A higher stress is expected since the main growth direction of a 3C–SiC/ISP thin film is parallel to the <111> orientation, following the substrate surface. From the literature,Reference Zhu, Zhu, Nishino and Pezzetti29 it is known that the stress on a (111)-oriented surface is higher than on (001) due, among the others, to a higher atomic packing density. Once a thicker film of about 1 μm is grown, the coalescence of the different growth fronts generates a highly defective region in the central part of each inverted pyramid, such regions having a strong effect on the stress relief acting as relaxation path, so that the corresponding Raman shift is now less pronounced in 3C–SiC/ISP sample as compared to the one in the reference sample. The difference in frequency is of about 0.4 cm−1 between 1-μm-thick 3C–SiC films grown on ISP and (001) Si, with the 3C–SiC/ISP sample showing a lower residual stress stored in the system. This difference increases up to 0.6 cm−1 when 3-μm-thick films are analyzed and remains constant for thicker films. From this observation, it can be suggested that, for thin films below 2 μm, a faster and more effective mechanism for stress relaxation is experienced than in thicker films. Thus, the stress relaxation mechanism in 3C–SiC/ISP is tightly linked to the film thickness, because of the defective regions, located at the center of each inverted pyramid and close to the heterointerface. Defective regions are responsible, on one hand, for stress relaxation, by allowing tilting and twisting of the grains required to relieve the stored stress, and, on the other hand, they act as sink for most of the crystallographic defects, such as misfit dislocations and SFs, generated at the heterointerface. This possible mechanism is confirmed by the experimental observation conducted by means of Raman spectroscopy and XRD when FWHMs of TO Raman mode and RCs are considered. Stress relaxation in thicker films follows a similar trend for both substrates used with a reduction of the residual stress being constant as observed for <100>-oriented material. If one presumes that a linear trend is maintained for thicker films, as suggested by extensions of the Stoney formulaReference Huang and Zhang30 when the film residual strain is not uniformly distributed throughout the thickness due to curvature-related effects, a 3C–SiC film with a thickness of about 32 μm is needed on conventional (001) Si, while a thickness of about 25 μm is required on ISP for a complete stress removal. Though, in the case of a heteroepitaxial system such as SiC/Si, the stress reduction should not be linear but it should follow a trend much more similar to an exponential decay or a power function with increasing the epitaxial film thickness. This has been previously observed in several studies by considering the Raman shift from the interface to the film surface in cross-sectional analysisReference Severino, Bongiorno, Piluso, Italia, Camarda, Mauceri, Condorelli, Di Stefano, Cafra, La Magna and La Via11, Reference Feng, Choyke and Powell31 or by studying the deflection of micromachined structures (planar rotating probes) as a function of the film thickness.Reference Anzalone, D’Arrigo, Camarda, Locke, Saddow and La Via32 Indeed, the stress reduction is strongly affected, among the others, by the defect density in the epitaxial film, which follows an exponential decay function when the film thickness increases.Reference Severino, Camarda, Condorelli, Perdicaro, Anzalone, Mauceri, La Magna and La Via10Thus, the final thickness of an epitaxial 3C–SiC film on Si substrate required for complete stress removal should increase much beyond the values suggested by the Stoney approach.
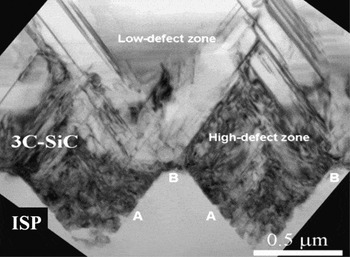
TEMs, both in plan view and in cross section, have been performed to better study and evaluate defect generation and propagation in films grown on ISP. A cross-sectional TEM micrograph is reported in Fig. 6 showing a low-defect density region, generated from the growth on ridges of pyramids (B site), close to the defective region, mentioned above, corresponding to the film growth on the sidewalls of the pyramid (A site). The observed morphology confirms the Raman and XRD data presented above when the effect of the defective region has been discussed. It is clear, as shown in Fig. 6, that these defective regions are limited within a couple of micrometers of 3C–SiC film due to growth mode in thin film configuration, described above, stimulated by the geometry of the substrate.
Cross-sectional TEM micrograph of a 6-μm-thick 3C–SiC film grown on ISP. The micrograph shows a detail of the interface between 3C–SiC film and ISP substrate. A large inverted pyramidal-shaped region with low-defect density is expanding. This region starts at the interface from the ridge between adjacent pyramids (nucleation site B). On the other hand, the film encapsulated within the pyramids (with sidewalls being nucleation sites A) shows a high-defect region where, for geometrical reasons, line defects are stimulated to annihilate one another. This region acts as a preferential path for stress relaxation.

Since the exposed Si surfaces in ISP during the initial SiC nucleation are represented by {111} faces (nucleation sites), as shown in Fig. 1, it is possible to define two different nucleation regions with two different growth mechanisms. The resulting growth is a consequence of the simultaneous nucleation of 3C–SiC in both the A and B sites. A first region is defined from 3C–SiC nucleated in sites A, with a resulting film characterized by a high-defect density, mainly SFs propagating in opposite directions (related to the four {111} planes exposed in the walls of each pyramid). As they propagate from opposite directions, they will overlap within couple of micrometers of film growth resulting in mutual annihilation. 3C–SiC islands nucleated on B sites have a higher growth rate due to higher gaseous supply absorbed on the surface and they grow both laterally and vertically, allowing the encapsulation of defective regions nucleated from sites A. Thus, 3C–SiC islands from different ridges will coalesce, generating a uniform film. Between adjacent ridges, a high concentration of structural defects remains encapsulated within the pyramid during the film growth on the sidewalls, i.e., on A sites. It is worth to note that defect generation is tightly linked to the experimental conditions within the reaction chamber during the growth process. A further reduction of this density can be achieved by optimizing the CVD growth process. Recently, a new growth process has been performed within the CVD reactors sited in ETC (Catania) and a n-type doped 3C–SiC film (6-μm thick) has been grown on ISP substrate showing a very narrow {200} RC FWHM of about 500 arcsec (more than one half narrower than the one presented in this work and shown in Fig. 4), indicating a further improvement of the 3C–SiC crystal quality.
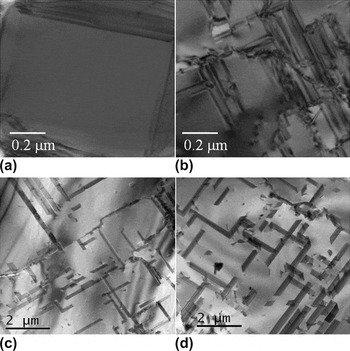
Plan view TEM analyses have been conducted to determine the linear SF density at surface in 3C–SiC/ISP and reference sample for any film thickness. 3C–SiC/ISP samples resulted in a lower SF density compared to the reference samples for any thickness of films considered. Plan view TEM micrographs of 1- and 9-μm-thick 3C–SiC films on ISP and (001) Si are shown in Figs. 7(a), 7(c) and Figs. 7(b), 7(d), respectively. The surface of a 1-μm-thick 3C–SiC film grown on ISP shows defect-free regions close to hollow voids, indicating the film nonuniformity at this thickness. The defect-free regions correspond to the growth on B sites, while hollow voids correspond to the surface of the film grown on the pyramids. Figure 7(a) shows a detail of the surface with a microscope magnification of 8000x but using a lower magnification (not shown), it can be seen that each hollow void is surrounded by four defect-free regions. It must be considered that the thickness of TEM sample was limited to 80 nm, thus the film nonuniformity for 1-μm-thick 3C–SiC film grown on ISP is higher than 8%. This nonuniformity of the TEM sample affects the linear SF density obtained in such a sample, underestimating the value that is about one half with respect to a 1-μm-thick reference sample. For thicker films, the nonuniformity tends to disappear and the value of SF density, obtained by plan-view transmission electron microscopy (PV-TEM), can be considered reliable. In particular, SF density further decreases with increasing 3C–SiC thickness reaching a value of about 1.1 × 10⁴ and 9.8 × 103 cm−1, for 3- and 6-μm-thick 3C–SiC/ISP samples, respectively. It must be pointed out that the linear SF density in reference samples was always higher than that in 3C–SiC/ISP samples with a decreasing gap observed when thicker films are considered. Thus, SF density reduces at a higher rate on reference (001) Si substrate, as confirmed by plan view TEM analysis showing the surfaces of 9-μm-thick 3C–SiC films grown on both substrates, as reported in Figs. 7(c) and 7d, respectively. These micrographs, obtained with a microscope magnification of 2000x, show linear SF density values of 9.31 × 10³ and 1.01 × 104 cm−1 for 3C–SiC/ISP and reference sample, respectively. The reduction rate of SFs due to their self-annihilation is roughly inversely proportional to their density. This statement is further supported by Polychroniadis et al.,Reference Polychroniadis, Syvajarvi, Yakimova and Stoemenos4 where a detailed study on the propagation of SFs using TEM in cross section is presented. They showed that the average length of propagating SFs was of the order of about 0.5 μm in the first 3 μm of film growth, where the SF density is very high (>4 × 104 cm−1), while SFs as long as 26 μm were observed after 20 μm of film growth (with a SF density reduced to 5 × 104 cm−1). In other words, the annihilation rate of SFs is high where a very dense network of SFs is detected and the mutual closure mechanism is stimulated. As the SF density decreases, SFs are much farther each other so that their annihilation rate falls and their density tends to a saturation value. In our case, since the density of SFs in thin films (<6 μm) is much higher on the reference sample, the reduction rate for mutual annihilation is much higher than in 3C–SiC on ISP and, for this reason, the SF density tends to similar value when 9-μm-thick 3C–SiC is grown. In both cases, the linear SF density tends toward a saturation value, suggesting a trade-off in the generation/annihilation process of SFs.
Plan view TEM micrographs of the 3C–SiC grown on ISP (a and c) and on conventional (001) Si substrates (b and d). 3C–SiC films reported in (a) and (b) are 1-μm thick (magnification used of 8000x), while film thickness in (c) and (d) is about 9 μm (magnification used 2000x).

Together with self-annihilation mechanisms, SFs can also be closed by APBs, as it is shown in Figs. 7(c) and 7(d) where several SFs are terminated when intersect such a defect. ISP does not help in the reduction of APBs that are mostly generated when coalescence of 3C–SiC coming from orthogonal {111} faces occurs. However, APBs are dominant defect in on-axis (001) Si surface as well.Reference Nagasawa, Yagi, Kawahara and Hatta33SEM images conducted on 9-μm-thick 3C–SiC film surfaces grown on both substrates (not reported here) do not show difference in APBs density so that their influence on SF reduction is considered similar for growth on (001) Si and ISP.
Linear SF densities obtained in this work for 3C–SiC films grown on ISP were then compared to SF densities obtained in our group for 3C–SiC films grown on different Si orientations, namely on-axis (001) Si and off-axis (111) Si. For the sake of comparison, SF density from very thick 3C–SiC films grown on undulant Si substrate, reported in Ref. Reference Polychroniadis, Syvajarvi, Yakimova and Stoemenos4, has been added in Figure 8. The resulting values suggest a reduction of SF density values when compared to the other samples grown within ACISM8 LPE CVD reactor with similar growth process. This is particularly valid for thickness in the range between 3 and 9 μm, when uniform and smooth films can be grown on the ISP substrate surface. This range of film thickness is very useful for device realization and further improvement of the growth process, as indicated above, should lead to an interesting increase in the yield of electronic devices due to a further reduction in SF density. The realization of device, such as metal oxide semiconductor capacitors and MOSFETs, with an optimized growth process of 3C–SiC films on ISP is the next step to be implemented to define the electrical properties of semiconductor and gate oxide and to observe the device characteristics of a finite device.
Linear SF density on the 3C–SiC film surface as a function of 3C–SiC film thickness, obtained by plan view TEM (<001> zone axis). Upper triangles, down triangles, and circles refer to off-axis (111) Si, ISP, and on-axis (001) Si substrates, respectively. For the only sake of comparison, values of a very thick 3C–SiC film grown on undulant Si substrate (open squares), from Ref. Reference Polychroniadis, Syvajarvi, Yakimova and Stoemenos4, are considered.

To realize an electronic device with good performance, another issue must be faced, the wafer bow observed in the samples after the growth. This is mainly due to the thermal stress originated by the cooling down following the growth process of 3C–SiC.Reference Zielinski, Ndiaye, Chassagne, Juillaguet, Lewandowska, Portail, Leycuras and Camassel12, Reference Zielinski, Leycuras, Ndiaye and Chassagne34 A technique to analyze the wafer bow is the measurement of the radius of curvature of the wafer after the growth process, usually performed by XRD or optical profilometry. The higher the radius of curvature (R c), the lower the curvature (K) and the flatter is the wafer. Substrate surfaces are quite important in the resulting wafer bow, with (111) Si-oriented surface leading to stronger bow than (001) Si wafer and off-axis-oriented substrate surfaces resulting in asymmetric wafer bowing.
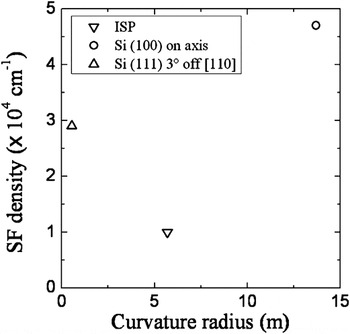
Measurements of curvature radii by optical profilometry were then performed on 3-μm-thick 3C–SiC films grown on different substrates indicating the 3C–SiC/(001) Si sample being the flattest (curvature radius higher than 10 m). The most bowed wafer was the 3C–SiC/(111) Si off-axis. The growth of 3C–SiC films on ISP substrate produces a radius of curvature of 5.5 m, leading to a bow on a 6-inch wafer of about 450 μm. The final bow must be reduced below 100 μm to allow processing steps required for device realization and this improvement can be realized by process optimization or adjustment of the pyramids on the surface reducing the size of the squared base. Despite of the very large bow presented by 3C–SiC/ISP samples, it is very interesting to analyze the plot reported in Fig. 9, where it is shown the trend of SF density as a function of the curvature radius for 3-μm-thick 3C–SiC film grown within the same reactor and similar growth process in ETC (Catania) on three different substrates, i.e., off-axis (111) Si, reference on-axis (001) Si, and ISP. A contradiction seems to arise between the wafer bowing, as measured by optical profilometry, and the residual stress of 3C–SiC, as observed by Raman spectroscopy, grown on ISP and (001) Si. As matter of fact, one would expect that a higher wafer bowing should correspond to a higher residual stress stored in the epitaxial film. However, the heteroepitaxy of 3C–SiC on Si substrates induces plastic deformations in the Si underneath the interface, as experimentally observed in literature.Reference Watts, Attolini, Besagni, Bosi, Ferrari, Rossi, Riesz and Jiang35These deformations will influence strongly the final curvature of the entire system (whole wafer) so that any correlation between the residual stress stored in the film and the curvature of the wafer is lost. Further works on the effect of plastic deformations in the Si microstructure, close to the heterointerface, on the stress status of the SiC/Si system, and on the corresponding wafer bowing are matter of study of several research groups to clarify this issue.Reference Camarda, Anzalone, Piluso, Severino, Canino, La Via and La Magna36, Reference Zielinski, Michaud, Jiao, Chassagne, Bazin, Michon, Portail and Alquier37
Linear SF density (measured by PV-TEM) as a function of wafer curvature radius (measured by Optical Profilometry) for 3-μm-thick 3C–SiC films grown on three different substrates. Upper triangles, down triangles, and circles refer to off-axis (111) Si, ISP, and on-axis (001) Si substrates, respectively. All samples have been grown in an ACISM8 LPE CVD reactor.

V. CONCLUSIONS
A modification of the Si substrate surface as a crystal seed for 3C–SiC film growth has been presented in this work. The substrate surface is organized in squared ISP developing a possible chance in reducing, for geometrical reasons, the linear SF density in the 3C–SiC. During this work, growth of 3C–SiC on ISP and (001) Si (reference samples) have been conducted to discuss the difference between samples when different 3C–SiC film thicknesses are considered. The nucleation and initial growth of 3C–SiC on ISP have been presented suggesting a peculiar growth mode leading to uniform sample morphology in 3-μm-thick 3C–SiC films. Film quality and residual stress evaluations have been conducted by XRD, μ-Raman, and TEM. A fast stress reduction in 3C–SiC/ISP thin samples, due to the presence of defective regions close to very high-quality regions, has been explained leading to a lower residual stress stored in 3C–SiC/ISP thick samples if compared to reference samples. Lower linear SF density with respect samples grown by our group on other Si orientations has been observed for 3C–SiC/ISP samples, with a value of about 9.31 × 103 cm−1 reported in a 9-μm-thick 3C–SiC film. Finally, an important issue to be solved still remains, i.e., the strong wafer bowing observed in 3C–SiC/ISP samples. Further studies are then scheduled for optimizing either the growth process conditions or the geometry of the pyramids on the Si substrate surface.
ACKNOWLEDGMENTS
The authors would like to thank Dr. S. Scalese for her contribution in SEM analysis, G. Milazzo and C. Bongiorno for TEM analysis, M.A. Di Stefano for Optical Profile measurements, Dr. G. Condorelli and Dr. G. Abbondanza for their useful time during CVD growths. This work is partially supported from the Public–Private Laboratory Project DM23176 (art.12 08/08/2000) financed from the Ministry of University and Research of Italy and from the PIA-INNOVATION project E01/0615/2 financed from the Ministry of University and Research and from the Ministry of Production Activity of Italy.