Obesity and prediabetes are major global health concerns, contributing to higher risk of type 2 diabetes and CVD(Reference Chandrasekaran and Ralf1,Reference Alijanvand, Aminorroaya and Kazemi2) . In 2022, 43 % of adults worldwide were overweight, 16 % were obese and prediabetes affected 10·6 % of the population in 2021(3,4) . Prediabetes, characterised by elevated blood glucose levels below diagnostic threshold for diabetes, substantially increases the risk of disease progression if left unaddressed(Reference Khetan and Rajagopalan5). In Malaysia, the overweight and obesity affect 54·4 % of adults, and prediabetes prevalence has reached 5·9 %, representing an escalating public health challenge(6).
Chrononutrition, which examines the interaction between meal timing and circadian rhythms, has emerged as major behavioural determinant of metabolic health(Reference Mentzelou, Papadopoulou and Psara7). Beyond dietary composition, the timing, regularity and frequency of eating episodes influence glucose metabolism, hormonal regulation and energy balance(Reference Flanagan, Bechtold and Pot8). Disruptions in eating patterns, including late night eating and prolonged eating windows, have been associated to increased adiposity, insulin resistance and dyslipidaemia(Reference Wang, Chan and Allman-Farinelli9–Reference Chong, Satvinder and Ruzita11). Although chrononutrition has been increasingly associated to glycaemic regulation, its relationship with anthropometric and body composition parameters remains less clearly established(Reference Ahluwalia12,Reference Bernardes, Teixeira and Madalena Rinaldi13) .
Emerging research suggests that chrononutrition behaviours are associated with weight gain, BMI and abdominal adiposity(Reference McHill, Phillips and Czeisler14–Reference Hana Dzulkafli and Sidek16). Late-night eating and nighttime snacking have been associated with higher waist circumference and visceral fat accumulation, both strong predictors of cardiometabolic risk(Reference Mirghani17–Reference Vujović, Piron and Qian19). The recent study, conducted among Romanian adults, demonstrated that longer sleep duration was independently associated with lower odds of overweight and obesity when classified using both BMI and bioelectrical impedance-derived body fat percentage, with each additional hour of sleep reducing the likelihood of excessive adiposity by approximately 77 %(Reference Pescari, Mihuta and Bena20). Nevertheless, some studies have reported no significant associations between meal timing, meal frequency and breakfast skipping with metabolic measures(Reference Dote-Montero, Acosta and Sanchez-Delgado21,Reference Bohan Brown, Milanes and Allison22) . These inconsistencies may reflect differences in study populations, behavioural exposures and adiposity assessment methods. While anthropometric measures such as BMI, waist:hip ratio and waist circumference are widely used to assess obesity risk, they do not fully capture variations in fat distribution and lean mass(Reference Ramdas Nayak, Nayak and Vidyasagar23,Reference Holmes and Racette24) . Advanced techniques, including bioelectrical impedance analysis, provide a more comprehensive evaluation of body composition, offering deeper insight into metabolic risk beyond conventional anthropometry(Reference Holmes and Racette24,Reference Mohammad, Ziyab and Mohammad25) .
Despite growing interest in chrononutrition, key research gaps remain. Most studies have focused primarily on glycaemic outcomes, with limited longitudinal evidence examining detailed body composition parameters, particularly among adults with prediabetes, a metabolically high-risk group. Addressing these gaps is essential for developing targeted dietary strategies to mitigate obesity-related complications and prevent disease progression. Therefore, the present study aimed to examine the association between chrononutrition behaviours, anthropometric measurers and body composition metrics in adults with prediabetes. We hypothesised that participants with delayed meal timing, frequent nighttime snacking and higher meal frequency would be associated with poorer anthropometric measurers and body composition metrics.
Methods
Study participants
This study is a part of the Chrono-DMTM observational study conducted between 2022 and 2023(Reference Chong, Satvinder and Ruzita26). Participants received standard care for prediabetes from a registered dietitian at fourteen healthcare clinics in Malacca, which focused on improving overall diet quality, portion control and general healthy eating practices. The counselling did not specifically target chrononutrition behaviours such as meal timing, eating window or meal frequency. Chrononutrition behaviours were assessed as part of habitual dietary patterns rather than prescribed during counselling. Each session was individualised, using an evidence-based brochure as an educational tool and incorporating participants’ medical reports to tailor recommendations based on nutritional status, health conditions and lifestyle factors. The inclusion criteria were (i) Malaysian adults recently diagnosed with prediabetes, (ii) proficiency in the Malay language and (iii) willingness to engage in continuous follow-up visits at the healthcare clinic in Malacca. The exclusion criteria were applied to minimise potential measurement bias and confounding included (i) individuals diagnosed with sleep disorders or chronic kidney diseases, (ii) those undergoing treatment with oral glucose-lowering medications, anticonvulsants, oral steroids or diabetic supplements and (iii) pregnant or lactating women. Additionally, (iv) individuals working night shift more than four times a week and (v) those with prior experience in time-restricted eating practices were also excluded from the study.
The study was approved by the ethics committee of the Malaysian Ministry of Health Medical Research and Ethics Committee (NMRR ID-21-02090-SKX (IRR)) and the Tunku Abdul Rahman University of Management and Technology Ethics Committee (TAR UC/EC/2021/02-3). It was conducted in accordance with the Declaration of Helsinki of the World Medical Association. Furthermore, this study is registered with ClinicalTrials.gov (Identifier no: NCT05163964).
Study procedures and data collection
Following the obtaining of written informed consent, each participant was interviewed to collect data on socio-demographic characteristics (age and ethnicity) and indicators of socio-economic status (year of education). Participants were also questioned about their lifestyle behaviours (smoking habits, alcohol consumption and supplement use) and family history of diabetes. The collection of data on light exposure patterns, anthropometric measurements, body composition and chrononutrition behaviours was conducted at baseline, 3-month and 6-month.
Measurements of chrononutrition behaviours and dietary assessments
Participants reported several chrononutrition behaviours (first meal time, last meal times, first eating upon waking, last eating before bedtime, eating window, night fasting duration and meal frequency) through a 3-d dietary record using a paper-based food diary. Participants recorded all food and beverage intake in real time. A research assistant conducted a follow-up call on the same day to verify the recorded dietary information. Participants also captured images of their meals and sent them to the research assistant for further assessment. The other chrononutrition behaviours including breakfast and night snacking frequency were assessed using the Malay translated Chrononutrition Profile Questionnaire(Reference Chong, Satvinder and Talib27). The study on chrononutritional behaviours encompasses nine key elements: first and last mealtimes, the timing of first eating upon waking, last eating before bedtime, eating window, night fasting duration, meal frequency, breakfast frequency and night snacking frequency. All elements, except for breakfast and night snacking frequency, were evaluated using a 3-d dietary record method.
The assessment of these behaviours involved a combination of paper based and photographic food records. Participants were instructed to use their personal smartphones to capture images of all calorie-containing foods and beverages consumed during the 3-day period, sending these records to the research assistant via WhatsApp. A photograph of each selected meal was taken before consumption, following detailed instructions on food photography techniques (e.g., ensuring the serving plate filled the entire frame and taking photographs at a 45-degree angle to estimate the depth of the foods). The timing of the first meal was noted as the initiation of participants’ first food consumption in the morning (at least 5 kcal), while timing of the last meal was recorded as the start of their final meal of the day (at least 5 kcal)(Reference Veronda, Allison and Crosby28). In this study, the ‘recommended solar eating window’ was operationally defined as consuming all main meals between 07.00 and 19.00, reflecting alignment with natural daylight hours and typical circadian metabolic rhythms(Reference Chong, Kaur and Abd Talib29,Reference Chong, Satvinder and Ruzita30) . Participants were categorised as either eating within (07.00–19.00) or outside (< 07.00 or > 19.00) this window. The average time interval between waking and the first caloric intake (≥ 5 kcal) was defined as the ‘first eating upon waking’, and the time span between the last caloric intake and sleep onset was termed the ‘last eating before bedtime’. The duration of the eating window was calculated from the start time of the first eating episode to the start time of the last eating episode, which involved calorie-containing foods and drinks. Meal frequency was defined as the total number of eating occasions per day, including both main meals and snacks (≥ 5 kcal). Night fasting duration was determined by subtracting the duration of eating window from the total 24-h period, indicating the period participants abstained from nighttime food intake(Reference Kwak, Jang and Kim31). In the Malay translated Chrononutrition Profile Questionnaire, the participants underwent interviews conducted by the research assistant regarding their breakfast and nighttime snacking frequency across a 2-week period. The collected data were documented in paper-based questionnaires for subsequent analysis.
Given that dietary composition is influenced by chrononutritional behaviours and has negative impacts on human health, this study assessed the participants’ dietary intake to identify their dietary patterns within the population, with a particular focus on nighttime eating patterns. Data from the 3DDR were analysed using Nutritionist ProTM software, which incorporates the Malaysian Food Composition database(Reference Tee, Mohd Ismail and Mohd Nasir32,Reference Tee, Mohd Ismail and Mohd Nasir33) for a comprehensive analysis of average calorie and nutrient intakes. Considering previous studies highlighting the significant role of nighttime energy and macronutrients intake on glucose profiles(Reference Mirghani17,Reference Liu, Zheng and Xu34) , our study delved into a thorough examination of these dietary patterns. Nighttime energy intake was defined as all calorie-containing foods and beverages consumed after 19.00.
Our dietary assessment included evaluating total daily energy intake, macronutrient distributions and specific nighttime dietary trends among the participants. Nighttime energy intake (kcal/d) was calculated by dividing nighttime energy intake (kcal/d) by total energy intake (kcal/d) and then multiplying by 100 percent. Similarly, nighttime macronutrient intake was determined by dividing the nighttime macronutrient intake by nighttime energy intake and multiplying by 100 percent(Reference Loy, Ku and Zheng35).
Measurement of anthropometric measurements
Body weight and height were measured using a Tanita SC-330 weighing scale (Tokyo, Japan) and a SECA 213 portable stadiometer (Germany), both of which have an accuracy to the nearest ±0·1 kg and ±0·1 cm, respectively. Participants were required to empty their pockets of items, including wallets, keys, watches, glasses and to wear minimal clothing without shoes or socks before stepping on the scale. They were then asked to stand still, looking straight ahead with their arms at their sides, ensuring their feet and head were aligned with the Frankfurt plane. Participants stood unassisted in the middle of the scale, distributing their weight evenly on both feet. The BMI was calculated by dividing the weight in kilograms by the squared of their height in meters. Waist circumference (in centimetres), a crucial measure for evaluating abdominal obesity and associated health risk(36), was assessed using Lufkin metal tape (W606PM, Apex Tool Group) to an accuracy of 0·1 cm. Measurement took place after instructing the participants to stand with their feet 25–30 cm apart, balancing their weight evenly. The tape was placed horizontally around the abdomen, midway between the lowest rib and the top of the hip bone, applied snugly but without compressing the skin or underlying tissues. Hip circumference was recorded at the widest part of the buttocks, ensuring the tape was parallel to the floor.
Measurement of body composition
Body composition was measured using a bioelectrical impedance analysis device (Tanita SC-330), with strict adherence to the manufacturer’s instructions. This assessment included measurements of total body fat percentage, fat free mass, fat mass, muscle mass, total body water, bone mass and visceral fat. The metabolic age provided by the device represents an estimate derived from basal metabolic rate, comparing an individual’s basal metabolic rate with age-specific reference values to indicate the equivalent age at which the reference population demonstrates a similar metabolic rate. Before any measurements were taken, the device was calibrated using a standard 5 kg weight to avoid inaccurate readings and ensure reliability. Throughout the measurement process, the bioelectrical impedance analysis scale was placed on a solid, flat surface. The procedure for measuring body composition was similar to that used for weighing.
Measurement of confounders
Given the previous publications that indicated some confounders significantly associated with sex and ethnicity, information was gathered during screening using a socio-demographic questionnaire(Reference Schorr, Dichtel and Gerweck37,Reference Zulfarina, Sharif and Mokhtar38) . Physical activity was evaluated using the International Physical Activity Questionnaire, which calculates the metabolic equivalent of task score (MET-h/week)(Reference Soo, Wan Abdul Manan and Wan Suriati39). The short version of International Physical Activity Questionnaire was adapted from a previous study,(Reference Soo, Wan Abdul Manan and Wan Suriati39) and the data processing and analysis followed guidelines(40). Physical activity levels were determined by summing the frequency and duration scores for various activities – walking, moderate and vigorous intensities – then multiplying these by MET based on energy demands to derive a MET-minute score. Data on sedentary behaviours (sitting) were reported as medians and interquartile ranges(Reference Lee, Wong and Shanita41) or as means and standard deviations(Reference Waidyatilaka, Lanerolle and Wickremasinghe42). It is worth nothing that there are no universally accepted thresholds for categorising sedentary data. The light exposure patterns were assessed by the HLEA questionnaire, which reported total light exposure based on estimated corneal illuminance values (lux)(Reference Bajaj, Rosner and Lockley43).
Statistical analysis
Sex-specific variations in baseline characteristics, anthropometric measures, body composition, chrononutritional behaviours and dietary patterns were assessed. These comparisons were conducted to descriptively characterise the study population and to identify potential sex-related differences that could act as confounders in subsequent regression analyses. Descriptive variables are reported as means and standard deviations for normally distributed data or medians and interquartile ranges for non-normally distributed data. The independent t test or Mann–Whitney test was employed to compare baseline characteristics between sexes, depending on the data distribution. Additionally, a χ 2 test was applied to compare categorical data between independent and dependent variables.
This study conducted a generalised linear model with a Gaussian distribution to examine the association between chrononutrition behaviours assessed at 6 months (independent variables) and anthropometric as well as body composition outcomes measured at 6 months (dependent variables), with adjustment for corresponding baseline values. To account for potential confounders, three models were developed. The first model adjusted for age, sex, ethnicity and baseline variables, respectively(Reference Rocha, Melson and Zamora44,Reference Aminnuddin45) . Given findings from previous studies, additional models were created to control for physical activity and total light exposure(Reference Bilu, Einat and Zimmet46,Reference Huay, Pusat and Permatapintar47) . The final models further adjusted for dietary patterns, such as total energy intake during the nighttime(Reference Loy, Ku and Zheng35). The model’s goodness of fit was evaluated using Akaike Information Criterion and Bayesian Information Criterion, alongside the likelihood ratio chi-square test to compare nested models. Assumptions of the model, including multicollinearity (checked via variance inflation factor) and interaction effects among key predictors, were examined to ensure model validity. All analyses were conducted using Statistical Package for the Social Science (SPSS, version 22), with a significance threshold set at a P-value < 0·05.
Results
Participants’ characteristics
This study enrolled 120 newly diagnosed adults with prediabetes, comprising thirty-nine males and eighty-one females, with a mean age of 54 ± 15 years (see Table 1). The majority of participants were Malay (64·2 %) and had completed secondary education (42·5 %). Nearly half of the participants were either unemployed or retired (49·2 %), and 50·8 % reported daily supplement consumption, including multivitamins, multiminerals, n-3 and herbal supplements. A significant portion of the participants was diagnosed with hypertension (64·2 %) and hyperlipidaemia (53·3 %), with 75·8 % reporting a family history of diabetes. There were no significant differences observed between sex in physical activity levels and light exposure patterns. Most dietary patterns did not show significant differences, except for total carbohydrate intake in male participants (47·1 (13·2) % per day), which was significantly higher compared with female participants (44·9 (6·6) % per day).
Descriptive characteristics of participants

Table 1. Long description
The table presents the descriptive characteristics of 120 newly diagnosed adults with prediabetes, divided into male and female categories. It includes various variables such as age, race, education level, employment status, lifestyle patterns, comorbidity risk factors, physical activities, sedentary behaviors, light exposure patterns, anthropometric indices, body composition, chrononutrition behaviors, and dietary patterns. The table has 120 rows and 39 columns, with column headers including variables like age, race, education level, employment status, smoking, daily supplement intake, hypertension, hyperlipidemia, family history of diabetes, physical activities, sedentary behaviors, light exposure patterns, anthropometric indices, body composition, chrononutrition behaviors, and dietary patterns. Each row provides data for each variable, with mean and standard deviation or median and interquartile range values. Notable trends include the majority of participants being Malay, having completed secondary education, and nearly half being unemployed or retired. A significant portion of participants was diagnosed with hypertension and hyperlipidemia, with most reporting a family history of diabetes. There were no significant differences observed between sexes in physical activity levels and light exposure patterns. Most dietary patterns did not show significant differences, except for total carbohydrate intake, which was higher in male participants compared to female participants.
lux: Estimated corneal illuminance values; METs: Metabolic equivalents of task; % E: Percentage of total energy intake.
No significant level at P < 0·05 using χ 2 test.
Medians were calculated independently; therefore, the sum of median fat mass and fat-free mass may not equal the median body weight.
Bold values indicate statistically significant results at P < 0.05 or P < 0.001.
*Data presented as mean ± standard deviation; †data presented as median (interquartile range).
‡Data presented as number (percentage).
§Significant level at P < 0·05 using independent t test.
||Significant level at P < 0·05 using Mann–Whitney U test.
Metabolic characteristics of participants
From Table 1, it is evident that female participants had higher BMI (29·1 (6·9) v. 26·3 (5·2) kg/m2), hip circumference measurements (105·4 (14·5) v. 99·8 (12·0) cm) and waist:hip ratio (0·93 (0·07) v. 0·89 (0·06)) compared with their male counterparts. Regarding body composition, females showed a significantly higher total body fat percentage and fat mass than males. Inversely, males exhibited a greater fat free mass (51·5 (10·8) v. 40·0 (5·5) kg), muscle mass (48·8 (10·7) v. 37·6 (4·8) kg), total body water (53·3 (6·5) v. 45·1 (5·3) kg), bone mass (2·7 (0·4) v. 2·3 (0·5) kg), basal metabolic rate (1531 ± 258 v. 1351 ± 248 kcal) and younger metabolic age (56 ± 13 v. 64 ± 12 years) than females.
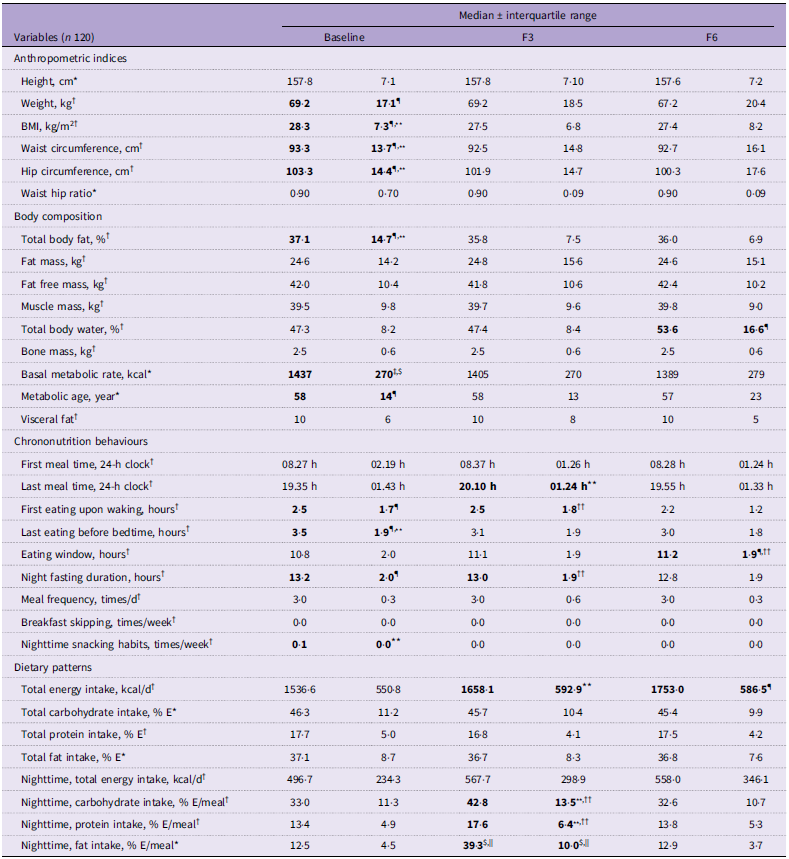
Table 2 illustrates a significant reduction in weight (69·2 (17·1) v. 67·2 (20·4) kg), BMI (28·3 (7·3) v. 27·4 (8·2) kg/m2), waist circumference (93·3 (13·7) v. 92·7 (16·1) cm) and hip circumference (103·3 (14·4) v. 100·3 (17·6) cm) among participants after 6 months. Participants experienced a significant decrease in total body fat (37·1 (14·7) v. 36·0 (6·9) %) and basal metabolic rate (1437 ± 270 v. 1389 ± 279 kcal) after the 6-month period; however, their total body water (47·3 (8·2) v. 53·6 (16·6) %) increased during this time.
Changes in lifestyle characteristics at baseline and follow-ups

Table 2. Long description
A table comparing lifestyle characteristics at baseline and follow-ups. The table has 120 variables and includes data for baseline, F3, and F6 follow-ups. It is divided into sections for anthropometric indices, body composition, chrononutrition behaviors, and dietary patterns. Each section contains multiple rows and columns with specific measurements and times. For example, anthropometric indices include height, weight, BMI, waist circumference, and hip circumference. Body composition includes total body fat, fat mass, fat-free mass, muscle mass, total body water, bone mass, basal metabolic rate, metabolic age, and visceral fat. Chrononutrition behaviors include first meal time, last meal time, first eating upon waking, last eating before bedtime, eating window, night fasting duration, meal frequency, breakfast skipping, and nighttime snacking habits. Dietary patterns include total energy intake, total carbohydrate intake, total protein intake, total fat intake, nighttime total energy intake, nighttime carbohydrate intake, nighttime protein intake, and nighttime fat intake. Each variable is measured with median and interquartile range values.
% E: percentage of total energy intake.
F3: Follow-up after 3 months; F6: follow-up after 6 months.
Medians were calculated independently; therefore, the sum of median fat mass and fat-free mass may not equal the median body weight.
Bold values indicate statistically significant results at P < 0.05 or P < 0.001.
*Data presented as mean ± standard deviation; †data presented as median (interquartile range).
‡Significant level at P < 0·05 using Paired t test from baseline to F6.
$Significant level at P < 0·05 using Paired t test from baseline to F3.
||Significant level at P < 0·05 using Paired t test from F3 to F6.
¶Significant level at P < 0·05 using Wilcoxon signed rank test from baseline to F6.
**Significant level at P < 0·05 using Wilcoxon signed rank test from baseline to F3.
††Significant level at P < 0·05 using Wilcoxon signed rank test from F3 to F6.
Chrononutrition behaviours and dietary patterns of participants
Although no significant differences in chrononutrition behaviours were observed between sexes, participants typically woke up at 06.00 (±1·37 h) and had their first meal at 08.27 (±1·38 h), with an average duration of approximately 2·4 (1·7) h between waking up and eating their first meal (see Table 1). Their last meal of the day occurred around 19.35 (±1·44 h), and they went to sleep at 23.00 (±2·00 h), resulting in an average time span of approximately 3·3(1·9) h between the last meal and bedtime. The participants reported an average meal frequency of 3·0 (0·3) times daily, with an eating window lasting for 10·8 (2·0) h. The median frequency of nighttime snacking was 0·1 (0) times daily. The majority of participants reported regular breakfast consumption, with low frequency of breakfast skipping observed.
In Table 2, participants showed a shorter duration from waking to their first meal (2·5 (1·7) v. 2·2 (1·2) h) and from their last meal before bedtime (3·5 (1·9) v. 3·0 (1·8) h) after 6 months. However, their eating window extended (10·8 (2·0) v. 11·2 (1·9) h), leading to a decrease in night fasting duration (13·2 (2·0) v. 12·8 (1·9) h) during this period. There was no significant difference in changes in total carbohydrate, total protein and total fat intake after 6 months, nor in their distribution at night. However, total energy intake significantly increased from baseline to 6 months (1536·6 (550·8) v. 1753·0 (586·5) kcal).
Association of chrononutrition behaviours with anthropometric measurements
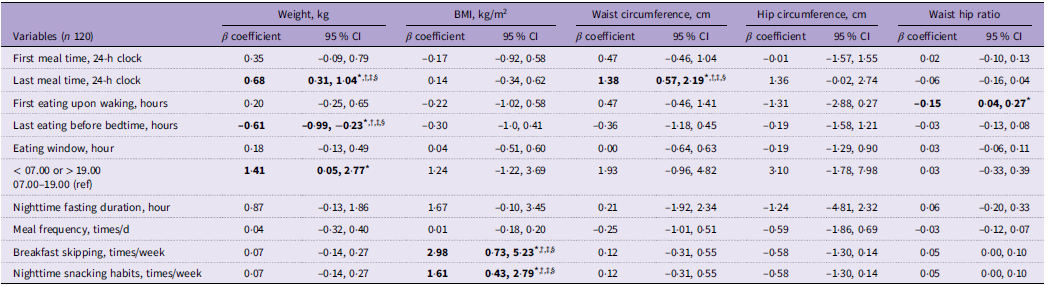
Table 3 depicts the associations between chrononutrition behaviours assessed at 6-month and anthropometric outcomes measured at 6-month, with adjustment for corresponding baseline values. There was a significant positive association between delaying the last mealtime and weight gain (β: 0·68 kg, 95 % CI: 0·31, 1·04), as well as waist circumference (β: 1·38 kg, 95 % CI: 0·57, 2·19) after adjusting for confounding factors during the 6-month follow-up. Participants who consumed meals before 07.00 or later than 19.00 experienced an increase in a body weight of 1·41 kg (β: 1·41 kg, 95 % CI: 0·05, 2·77), compared to those who ate within the 07.00–19.00 timeframe. Conversely, a significant negative trend was observed for the last meal before bedtime; where a longer duration of time between last meal and bedtime (β: −0·61 kg, 95 % CI: −0·99, −0·23) was associated with a decrease in body weight. Following adjustment for confounders, participants who engaged in nighttime snacking during the 6-month follow-up period experienced an increase in BMI of 1·61 kg/m2 (95 % CI: 0·43, 2·79) per unit increase in nighttime snacking frequency per day. Moreover, an extended duration of first meal upon waking was significantly associated with lower waist hip ratio (β: −0·15, 95 % CI: 0·04, 0·27). However, none of the chrononutrition behaviours showed a significant association with hip circumference. In addition, skipping breakfast and nighttime snacking were positively associated with an increase in BMI, with increases of 2·98 kg/m2 (95 % CI: 0·73, 5·23) and 1·61 kg/m2 (95 % CI: 0·43, 2·79), respectively. The Akaike Information Criterion, Bayesian Information Criterion and likelihood ratio χ 2 test results for each model are reported in Table 1 of the online Supplementary File for assessing the association between chrononutritional behaviours and anthropometric measurements.
Association between chrononutrition behaviours at 6-month and anthropometric outcomes at 6-month, adjusted for baseline values

Table 3. Long description
A table with 120 variables comparing weight, BMI, waist circumference, hip circumference, and waist-hip ratio. The table has 10 rows and 15 columns. Column headers include Variables, Weight (kg), BMI (kg/m^2), Waist circumference (cm), Hip circumference (cm), and Waist-hip ratio. Each row represents different chrononutrition behaviors such as first meal time, last meal time, first eating upon waking, last eating before bedtime, eating window, meal frequency, breakfast skipping, and nighttime snacking habits. Each behavior is associated with beta coefficients and 95% confidence intervals for the different anthropometric outcomes. Notable trends include a significant positive association between delaying the last mealtime and increases in weight and waist circumference, and a significant negative trend for the last meal before bedtime with a decrease in body weight. Participants who consumed meals before 07:00 or after 19:00 experienced an increase in body weight compared to those who ate within the 07:00-19:00 timeframe. Skipping breakfast and nighttime snacking were positively associated with an increase in BMI.
ref: Reference group.
β coefficients represent the association between chrononutrition behaviours at 6 months and anthropometric outcomes at 6 months, adjusted for baseline values and covariates.
Bold values indicate statistically significant results at P < 0.05 or P < 0.001.
* Significant level at P < 0·05, using generalised linear model test.
† Model: adjusted for age, sex, ethnicity, baseline chrononutrition characteristics and baseline anthropometric indices, respectively.
‡ Model: adjusted for model 1+ physical activity, total daily light exposure.
§ Model: adjusted for model 2+ total energy intake during nighttime.
Association of chrononutrition behaviours with body composition
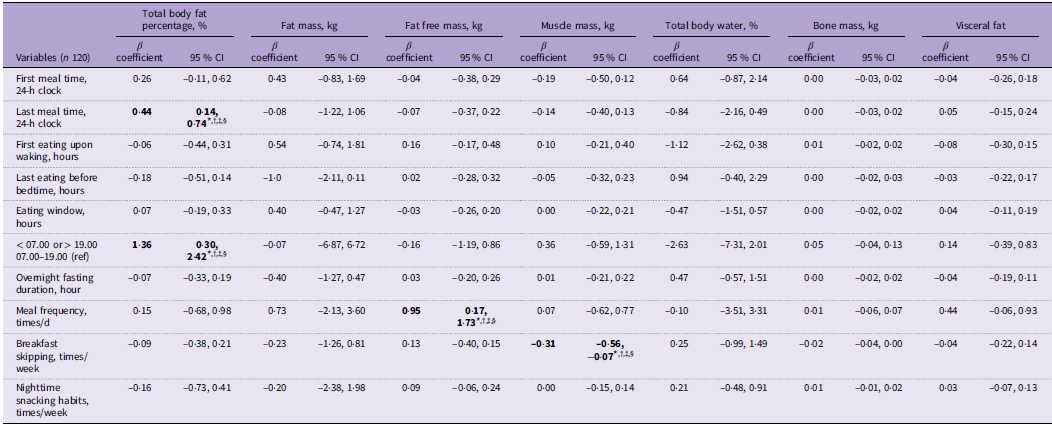
Table 4 presents the associations between chrononutrition behaviours assessed at 6-month and body composition outcomes measured at 6-month, with adjustment for corresponding baseline values. In regression models adjusted for confounding factors, delaying the timing of the last meal was significantly associated with an increase in body fat percentage (β: 0·44 %, 95 % CI: 0·14, 0·74). Additionally, participants who consumed their meals earlier than 07.00 or later than 19.00 exhibited 1·36 % increase in body fat percentage when compared to those who ate within the window of 07.00 and 19.00 (95 % CI: 0·30, 2·42). In the assessment of non-fat indices, an analysis revealed a significant positive association between meal frequency and fat free mass (β: 0·95 kg, 95 % CI: 0·17, 1·73). Furthermore, a higher frequency of skipping breakfast per week was significantly associated with a reduction in muscle mass (β: −0·31 kg, 95 % CI: −0·56, 0·07). However, no significant associations were observed between chrononutrition behaviours and other non-fat components such as visceral fat, total body water and bone mass. These observations indicate that variations in meal frequency and breakfast omission influence non-fat body components. Table 2 in the online Supplementary File presents the Akaike Information Criterion, Bayesian Information Criterion and likelihood ratio χ 2 test results for each model assessing the association between chrononutritional behaviours and body composition.
Association between chrononutrition behaviours at 6-month and body composition outcomes at 6-month, adjusted for baseline value

Table 4. Long description
A table with 120 variables comparing total body fat percentage, fat mass, fat free mass, muscle mass, total body water, bone mass, and visceral fat. The table has 12 rows and 8 columns. Column headers are Variables, Total body fat percentage, Fat mass, Fat free mass, Muscle mass, Total body water, Bone mass, and Visceral fat. Each column contains beta coefficients and 95 percent confidence intervals. Row labels include First meal time, Last meal time, First eating upon waking, Last eating before bedtime, Eating window, Meal timing, Overnight fasting duration, Meal frequency, Breakfast skipping, and Nighttime snacking. Notable trends include significant associations between last meal time and body fat percentage, meal timing and body fat percentage, meal frequency and fat free mass, and breakfast skipping and muscle mass.
ref: Reference group.
Bold values indicate statistically significant results at P < 0.05 or P < 0.001.
* Significant level at P < 0·05, using generalised linear model test.
† Model: adjusted for age, sex, ethnicity, baseline chrononutrition characteristics and baseline body composition, respectively.
‡ Model: adjusted for model 1+ physical activity, total daily light exposure.
§ Model: adjusted for model 2+ total energy intake during nighttime.
Discussion
Primary outcomes
This pioneering longitudinal observational study provides a comprehensive analysis of the chrononutrition behaviours and their associations with anthropometric and body composition parameters in prediabetic population. The analysis reveals that variables including delayed meal timing, eating beyond typical hours (07.00–19.00), increased nighttime snacking, extended intervals between waking and the first meal and higher meal frequency are positively associated with changes in anthropometric and body composition parameters. Conversely, a longer interval before the last meal at bedtime and frequent breakfast skipping are associated with adverse effects on weight and muscle mass, respectively.
Comparison with previous findings
Participant’s characteristics
While both sexes are susceptible to metabolic disorders, the health outcomes associated with these conditions impact differ between males and females(Reference Schorr, Dichtel and Gerweck37). This study demonstrates that females have higher anthropometric indices, including BMI, hip circumference and waist circumference, as well as elevated body composition metrics such as total body fat percentage and fat mass than males. These findings are consistent with a previous study indicating that females typically possess higher total fat mass, whereas males exhibit greater lean and muscle mass(Reference Schorr, Dichtel and Gerweck37). These comparisons were presented to descriptively characterise the study population rather than to suggest novel sex-specific differences. Importantly, sex was adjusted for in all regression models to account for its potential confounding effects on the observed associations. Notably, skeletal muscle is crucial in regulating glucose homeostasis, and a reduction in muscle mass is associated to heightened risk of glucose intolerance(Reference Merz and Thurmond48). The observed sex differences in anthropometric and body composition metrics may be influenced by variations in sex steroids, with age associated declines in estragon and testosterone potentially favouring increased fat accumulation(Reference Wells49).
In this study, the participants demonstrated a significant reduction in weight, BMI and waist and hip circumferences after the 6-month follow-up. There was also a significant decreased in total body fat and basal metabolic rate, while the total body water showed a slight decrease during the same period. These changes observed in anthropometric indices and body composition metrics are likely due to the standard care provided by healthcare professionals at the beginning of the study, as well as the participants’ adherence to dietary guidelines throughout the 6 months(Reference Iatcu, Gal and Covasa50). This finding is consistent with previous research indicating that intensified lifestyle interventions, including healthy eating practices, can lead to improvements in weight lost and obesity-related health outcomes(Reference Mohd Zaki, Appannah and Mohamad Nor51,Reference Gong, Zhang and Wang52) .
Chrononutrition behaviours are significantly associated with anthropometric measurements
Our study indicated significant associations between chrononutrition behaviours, such as delaying the last meal, consuming meals before 07.00 or later than 19.00, and frequent nighttime snacking and higher anthropometric measurements at 6-month period. In contrast, a longer duration between waking and the first meal was associated with reduced waist circumference. Additionally, a longer interval between the last meal and bedtime was associated with lower body weight. Importantly, the inverse association observed for delayed first eating differs from the adverse associations related to late-night intake. While delayed last meal timing and nighttime snacking extend energy intake into the biological night, potentially disrupting circadian alignment and metabolic regulation(Reference Flanagan, Bechtold and Pot8,Reference Vujović, Piron and Qian19,Reference Franzago, Alessandrelli and Notarangelo53) . A modest delay in the first meal may reflect prolonged overnight fasting without extending the overall eating window into metabolically vulnerable hours(Reference Regmi and Heilbronn54,Reference Manoogian and Laferrère55) . Thus, the metabolic implications of delaying the first meal may differ from those of late-night eating. Nevertheless, the underlying mechanisms remain to be fully elucidated and these changes may also be partially influenced by standard care received during the study period.
Collectively, our findings support evidence suggesting that energy consumption later in the day contributes to increased adiposity weight gain(Reference Madjd, Taylor and Delavari56). Consistent with this, data from National Health and Nutrition Examination Survey reported that elderly adults who had their last meal (22.03) had a higher prevalence of abdominal obesity compared with those who ate earlier (18.40)(Reference Bernardes, Teixeira and Madalena Rinaldi13). The same study further demonstrated that longer eating durations are associated with a higher prevalence of abdominal obesity(Reference Bernardes, Teixeira and Madalena Rinaldi13). Similarly, a study involving Japanese adults revealed that a late eating window, starting at 08.11, resulted in a lower weight loss rate compared to an early window, starting at 06.48, during a 12-week weight lost programme(Reference Hatanaka, Hatamoto and Tajiri57). Further supporting our findings, a prospective cohort study involving USA adults over 6 months indicated that participants who had a shorter time from waking up to their first meal, and a longer time from their last meal to bedtime, appeared to have less weight increase(Reference Zhao, Guallar and Woolf58). Moreover, a longitudinal study in Japan supported that nighttime eating habits, such as consuming dinner immediately before bedtime and snacking after dinner, were significantly associated with higher odds of obesity after a follow-up period of 3·9 years(Reference Yoshida, Eguchi and Nagaoka59). This aligns with previous research on nighttime eating behaviours, which indicates that frequent nighttime eating negatively impacts weight control(Reference Kwan, Lee and Cheng60–Reference Okada, Imano and Muraki62). Additionally, a large-scale cohort study revealed that regular nighttime snacking triples the risk of developing obesity(Reference Liu, Zheng and Xu34).
Several pathways have been proposed to explain how chrononutrition behaviours can disrupt circadian rhythms, leading to a higher risk of metabolic disorders(Reference Flanagan, Bechtold and Pot8,Reference Franzago, Alessandrelli and Notarangelo53) . First, eating food at times that do not align with typical light or dark cycles may disrupt the production of satiety hormones, including leptin and ghrelin, resulting in increased food consumption(Reference Tacad, Tovar and Richardson63). Furthermore, the timing of food consumption can impact energy expenditure(Reference Shaw, Leung and Jong64). For instance, delayed eating at night can trigger a decrease in metabolic rate after eating, thereby resulting in reduced energy expenditure(Reference Fukuda and Morita65,Reference Quatela, Callister and Patterson66) . Lastly, the synchronisation of feeding and fasting, as well as sleep and wake cycles, with light or dark cycles is also seen as a potential factor affecting gut microbiota and contributing to increased adiposity(Reference Górowska-Kowolik and Chobot67).
Chrononutrition behaviours are significantly associated with the body composition
In addition to assessing body composition, chrononutrition behaviours highlight the importance of nighttime eating in contributing to fat accumulation(Reference Ahluwalia12). This study found that having the last meal later at night and eating beyond the designated window (between 07.00 and 19.00) are associated with a higher body fat percentage in adults with prediabetes. A cross-sectional study of overweight and obese adults in the USA, demonstrated that a delayed start to eating was associated with 25 % increase in body fat percentage(Reference Thomas, Zaman and Cornier68). Moreover, another study conducted involving young USA adults with high body fat revealed that consuming food near to melatonin onset was associated with a greater body fat percentage(Reference McHill, Phillips and Czeisler14). A large-scale cohort study in Spain further supported the notion that later meal timing is associated with obesity and related comorbidities(Reference Dashti, Gómez-Abellán and Qian18). This study identified associations between late eating and higher concertation of triglycerides, independent of BMI, various dietary components and levels of physical activity(Reference Dashti, Gómez-Abellán and Qian18). Furthermore, late eating was found to reduce fat oxidation and increase LDL cholesterol levels, indicating a shift in fat metabolism and an elevated risk of obesity(Reference Hibi, Masumoto and Naito69). These findings emphasise the necessity for further examination of clinical markers to fully understand the effect of late eating on overall metabolic health.
Our findings regarding meal frequency and fat free mass diverge from those of a longitudinal study conducted over 6 years in a Danish adult population(Reference Larsen and Heitmann70). While that study did not find a direct association between meal frequency and fat free mass, it did observe an inverse association between the frequency of regular meals and subsequent changes in fat free mass(Reference Larsen and Heitmann70). Additionally, a systematic review found that reducing meal frequency with restricted calories intake provided limited evidence of benefits for individuals with obesity, particularly when consuming one to three meals was associated with reduced fat mass(Reference Schwingshackl, Nitschke and Zähringer71). In addition, our findings reveal a negative association between skipping breakfast and muscle mass. Similarly, a cross-sectional study involving healthy young subjects revealed that regular breakfast consumption was positively associated with muscle mass(Reference Yasuda, Asako and Arimitsu72). The reduction in muscle mass due to delaying breakfast could be attributed to the increased conversion of body protein into glucose to meet the metabolic demands of waking the brain and other glucose-dependent tissues(Reference Boyle, Scott and Krentz73). Collectively, these chrononutrition behaviours propose that eating late in the day can delay hunger the following morning, resulting in skipped breakfast and altered meal frequency, ultimately contributing to short term changes in adiposity and muscle measures(Reference Ahluwalia12).
The observed increase in reported energy intake at follow-up, despite reductions in anthropometric and body composition measures, may reflect improved dietary reporting accuracy over time, as underreporting is common at baseline among individuals with overweight or obesity. Additionally, standard care and lifestyle modifications may have contributed to improved metabolic outcomes independent of total energy intake.
Limitations and strengths of the study
Our findings should be interpreted with caution due to several limitations inherent in the current study. First, participants were recruited from a single healthcare clinic based on their availability and accessibility during the study period. Therefore, the findings may not generalisable to the broader prediabetic population. Second, some participants did not consistently report their food records, leading to potential inaccuracies in interpretating dietary patterns. Although a prospective dietary record method was used, self-reported data may still be subject to reporting bias, including under- or over-reporting, which may result in potential misclassification of dietary intake and chrononutrition behaviours. Third, variation in participants’ engagement in lifestyle interventions and adherence to regular exercise training, as recommended by healthcare professional, was beyond the researchers’ control and may have influenced the outcome measurements. As an observational study, causal relationships cannot be established. In addition, the study sample was predominantly female, and women had significantly higher BMI at baseline compared with men. This sex imbalance may affect the generalisability of the findings, given known sex differences in body composition and metabolic responses. Although all regression models were adjusted for sex to minimise potential confounding, future studies with more balanced sex representation are needed to validate these results. In addition, as participants received standard dietary counselling as part of routine care, concurrent lifestyle modifications may have influenced both behavioural patterns and anthropometric outcomes. Therefore, the independent effects of chrononutrition behaviours cannot be fully disentangled. Body composition was assessed using bioelectrical impedance analysis, which, although practical and widely used in clinical settings, may be influenced by factors such as hydration status and recent food intake, potentially introducing measurement variability. Despite these limitations, this study is strengthened by its prospective longitudinal design, enabling the assessment of changes within a 6-month period. The inclusion of multiple confounders in the analyses strengthened the robustness of the findings, and the use of a validated, translated questionnaire helped ensure data quality and reduce language-related bias. The use of a validated and translated questionnaire during the data collection ensured data accuracy and minimised potential bias related to language comprehension.
Conclusions
In conclusion, this study suggests that chrononutrition behaviours are significantly associated with anthropometric and body composition measurers. The positive associations between later meal timing, eating beyond designated window (between 07.00 and 19.00) and nighttime snacking with metabolic measures underscores the importance of these factors. These findings highlight that the timing of food intake and eating behaviours are crucial considerations in obesity treatment and prevention. Future longitudinal studies with extended follow-up durations are warranted to evaluate the sustainability and long-term effects of chrononutrition behaviours on metabolic health and disease progression.
Supplementary material
For supplementary material/s referred to in this article, please visit https://doi.org/10.1017/S0007114526108095
Acknowledgements
We would like to acknowledge the Ministry of Health for their approval and support of research. We would also like to recognise the medical team for granting permission to conduct research in healthcare clinics Malacca. Our appreciation extends to the dietitian team (Poh Lee Chua, Nor Hazirah bt Muhamad Ali, Siti Aishah bte Darussalam, Hidayati Mohd Rashid and Xiao Xuan Ti), diabetes educators and the laboratory team for their dedicated efforts in this research. Additionally, we express our gratitude to all subjects who participated in the research for their cooperation and contribution.
The Ministry of Higher Education Malaysia supports the research under the Fundamental Research Grant Schema (FRGS/1/2021/SKK06/TARUC/02/1). The funders played no role in the study design, data collection, management, analysis and interpretation, manuscript preparation, decision-making or submission of the report for publication.
G. Y. C.: Conceptualisation-Supporting, Formal analysis-Equal, Investigation-Lead, Methodology-Equal, Project administration-Equal, Software-Equal, Validation-Equal, Writing – original draft-Equal, Writing – review & editing-Equal; S. K.: Conceptualisation-Equal, Methodology-Supporting, Supervision-Equal, Writing – review & editing-Supporting; R. A. T.: Conceptualisation-Equal, Methodology-Supporting, Supervision-Equal, Writing – review & editing-Supporting; S. L. L.: Conceptualisation-Equal, Formal analysis-Supporting, Methodology-Supporting, Writing – review & editing-Supporting; H. Y. T.: Conceptualisation-Equal, Writing – review & editing-Equal; R. B. A.: Conceptualisation-Equal, Writing – review & editing-Equal; H. B. M.: Conceptualisation-Equal, Writing – review & editing-Equal; W. Y. S.: Conceptualisation-Equal, Investigation-Supporting, Supervision-Supporting, Writing – review & editing-Equal; L. K. T.: Formal analysis-Supporting, Writing – review & editing-Supporting; K. C. C.: Formal analysis-Supporting, Writing – review & editing-Equal; H. C. K.: Conceptualisation-Equal, Funding acquisition-Equal, Methodology-Equal, Project administration-Equal, Supervision-Equal, Writing – review & editing-Equal. All authors have read, reviewed and approved the final manuscript.
The authors declared that they have no competing interests.