





Intake of fish and supplementation with n-3 PUFA, specifically EPA (20:5n-3) and DHA (22:6n-3) acids, are associated with reduced incidence of various disorders, including CVD(Reference Ricci, Gaeta and Franchi1,Reference Hu, Hu and Manson2) as well as metabolic disorders(Reference Basirat and Merino-Torres3), brain pathologies(Reference Dighriri, Alsubaie and Hakami4), autoimmune diseases(Reference Hong, Hun and Wu5) and pre-eclampsia(Reference Amza, Haj Hamoud and Sima6).
In the VITamin D and OmegA-3 TriaL (VITAL) study, however, intake of approximately 840 mg/d EPA and DHA did not, in general, show an effect on CVD events, although participants with low fish consumption experienced a reduced CVD risk(Reference Tobin, Midtbø and Mildenberger7). Studies with higher doses of n-3 PUFA also show inconsistent results; the Long-Term Outcomes Study to Assess Statin Residual Risk with Epanova in High Cardiovascular Risk Patients with Hypertriglyceridemia (STRENGTH) trial (4 g/d EPA and DHA) found no effect on CVD events, while the the Reduction of Cardiovascular Events with Icosapent Ethyl–Intervention Trial (REDUCE-IT) trial (4 g/d of EPA) found a significantly lower risk of ischaemic events(Reference Manson, Bassuk and Buring8–Reference Bhatt, Steg and Miller10).
The synthesis of n-6 and n-3 PUFA starts with the precursors linoleic acid (LA, 18:2n-6) and α-linolenic acid (ALA, 18:3n-3), respectively, and the synthesis is mediated by various desaturases; Δ6 desaturase (Δ6D) (encoded by the FA desaturase 2 (FADS2) gene), Δ5 desaturase (Δ5D) (encoded by the fatty acid (FA) desaturase 1 (FADS1) gene) and the elongation of very long-chain fatty acids proteins 2 and 5 (ELOVL2/5)(Reference Videla, Hernandez-Rodas and Metherel11). The initial Δ6 desaturation reaction is suggested to be rate-limiting, whereas the elongation processes are more rapid processes, and generally, the desaturation and elongation occur as alternating reactions. EPA, however, is elongated twice to form 22:5n-3 (docosapentaenoic acid) and subsequently 24:5n-3 (tetracosapentaenoic acid)(Reference Dyall12). Human studies generally show a low conversion rate or low levels of EPA and DHA in response to ALA, and dietary intake is considered the main source of EPA and DHA(Reference Schaeffer, Gohlke and Müller13,Reference Goyens, Spilker and Zock14) . However, this conversion is influenced by the FADS1 genotype, which shows great differences between countries around the world(Reference Schaeffer, Gohlke and Müller13,Reference Ameur, Enroth and Johansson15–Reference Blomquist, Albrecht and Hallmark18) , but dietary factors may also affect this conversion. The hepatic Δ6D is the main regulatory enzyme involved in the biosynthesis of n-3 and n-6 PUFA(Reference Skrzypski, Bellenger and Bellenger19), but the elongases, especially the ELOVL2, seem to have an important role in regulating n-3 PUFA levels(Reference Metherel, Irfan and Klingel20,Reference Gregory, Gibson and Cook-Johnson21) .
A recent study showed that the long-chain MUFA cetoleic acid (22:1 n-11) resulted in higher levels of n-3 PUFA in Atlantic salmon and human HepG2 cells(Reference Østbye, Berge and Nilsson22), but whether this translates to humans is unknown. To explore if cetoleic acid supplementation results in higher levels of n-3 PUFA in humans, we performed a double-blinded randomised controlled trial. Healthy adults consumed either capsules with mackerel oil, naturally rich in cetoleic acid(Reference Tobin, Midtbø and Mildenberger7), or a control oil.
Experimental methods
Participants and study design
A 4-week randomised double-blinded control trial with two intervention groups was conducted at the University of Oslo from April 2021 to April 2022, and forty-nine healthy adults (thirty-seven females and twelve males) from the Oslo area in Norway were included (Figure 1). Inclusion criteria were healthy males and females, based on disease history and no regular use of any medication, between 20 and 70 years of age and a BMI between 20 and 35 kg/m2. Exclusion criteria were any known chronic diseases, a high alcohol consumption (> 40 g/d), fasting blood glucose > 7·9 mmol/l, ongoing or planned pregnancy or breast-feeding in the intervention period, a high fish consumption (> 3 meals a week), blood donation during the intervention period, difficulty following the protocol, nicotine use, sporadic use of anti-inflammatory drugs and use of n-3 PUFA supplementation.
Study flow diagram of participants enrolled in the trial from April 2021 to April 2022. A total of fifty-one healthy participants from the Oslo area were enrolled and randomised to receive capsules containing mackerel oil or control oil. A total of forty-nine completed the 4-week intervention.

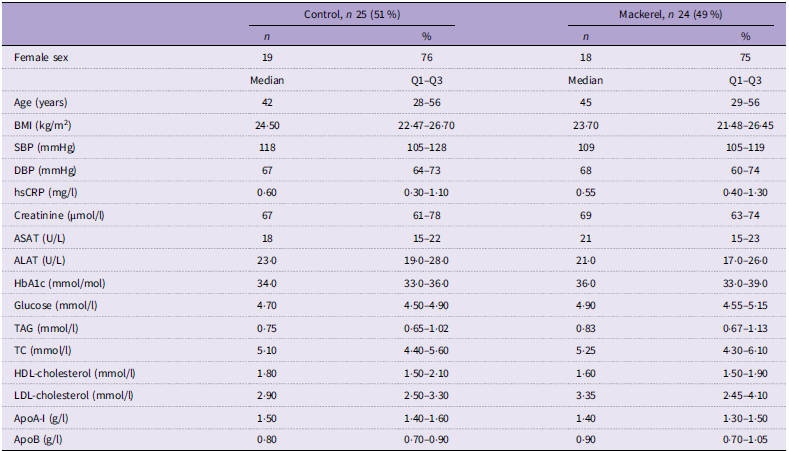
A total of forty-nine individuals (twenty-five in the control and twenty-four in the mackerel group) were ultimately included in the study, and baseline characteristics (i.e. demographic, clinical and laboratory data) are presented in Table 1. Use of medications affecting TAG levels was not allowed, except statins when provided at a stable dose for the past 3 months. Hormonal treatment therapy and contraceptives were allowed if the administered dose was stable for the past 3 months before inclusion and during the study. During the study, intake of other n-3 PUFA supplements was not allowed, and participants who were regularly taking n-3 supplements were asked to stop supplementation 3 weeks prior to the screening visit. Intake of fish was restricted to one meal per week from the screening visit and throughout the intervention period, and the participants were not allowed to eat mackerel or herring, which are naturally high in cetoleic acid. Subjects were instructed not to change their habitual diet and level of physical activity during the intervention. Participants who were using dietary supplements were provided with instructions to maintain a consistent intake throughout the entire duration of the study. Blood samples were taken before run-in, at baseline and after the 4-week intervention. At all visits, blood pressure and anthropometric measurements were taken, and adverse events were registered. Capsules were provided to participants at the visits.
Baseline characteristics of control and mackerel study groups

Table 1. Long description
A table comparing baseline characteristics of control and mackerel study groups. The table has 18 rows and 6 columns. The columns are labeled as Control, n 25 (51 percent), Control percent, Mackerel, n 24 (49 percent), and Mackerel percent. The rows are labeled as Female sex, Age (years), BMI (kilograms per square meter), SBP (millimeters of mercury), DBP (millimeters of mercury), hsCRP (milligrams per liter), Creatinine (micromoles per liter), ASAT (units per liter), ALAT (units per liter), HbA1c (millimoles per mole), Glucose (millimoles per liter), TAG (millimoles per liter), TC (millimoles per liter), HDL-cholesterol (millimoles per liter), LDL-cholesterol (millimoles per liter), ApoA-1 (grams per liter), and ApoB (grams per liter). Each row contains median values and interquartile ranges (Q1-Q3) for the respective characteristics in both the control and mackerel groups. The table provides a detailed comparison of demographic, clinical, and laboratory data between the two groups.
SBP, systolic blood pressure; DBP, diastolic blood pressure; hsCRP, high-sensitive C-reactive protein; ASAT, aspartataminotransferase; ALAT, alaninaminotransferase; TC, total cholesterol.
n (%); median (Q1–Q3).
At baseline, participants were randomised to receive either mackerel oil rich in cetoleic acid (800–900 mg/d or control oil low in cetoleic acid (35–40 mg/d), respectively, produced by Epax. Participants were instructed to take six capsules each day with their breakfast. After a 3-week run-in period where all subjects received the control oil, the participants were randomised to receive capsules of either control oil or mackerel oil rich in cetoleic acid.
EPA and DHA concentration in plasma and erythrocytes and n-3 index (EPA + DHA/total fatty acids) in erythrocytes measured at baseline and after a 4-week intervention was the primary endpoint of the study. Effects on RNA levels of enzymes regulating long-chain PUFA in peripheral blood mononuclear cells (PBMC) and lipid profile, and inflammatory and metabolic parameters were the predefined secondary endpoints. In this manuscript, we present effects on the primary endpoint as well as the effects on lipid profile and RNA expression on the actual enzymes in PBMC.
The participants were randomised and stratified by sex and age prior to 1:1 block randomisation. Randomisation was performed by a person not involved in the recruitment or enrolment of participants. The randomisation list was created using Microsoft Excel (version 2016), and the randomisation code was concealed from the study investigators until the statistical analyses were completed. The intervention and the control group were blinded for the participants and the investigators, except for one person who received the randomisation code and labelled the capsule containers with ID numbers. The capsules came in identical containers and were of equal size and appearance.
To control for compliance, all participants returned unused capsules, which were then counted. Based on the number of returned capsules, we found no compliance issues.
Fatty acid composition of mackerel and control capsules
Online Supplementary Table S1 shows the FA composition of the supplements (both placebo and mackerel capsule). The analyses were performed by Eurofins and show the results from five capsules. While there were no statistical differences in the concentration of any of the PUFA between the two capsules, there were numerically higher levels of some of the PUFA (e.g. 20:4n-3 was 3-fold higher). The mackerel capsules, however, had significantly higher levels of the MUFA 22:1n-11, not surprisingly, and 20:1n-9 (23-fold and 13-fold higher than control oil, respectively.
Clinical examination and routine biochemistry
Clinical examination was performed by trained health personnel, and blood sampling was performed by a trained bioengineer. Routine laboratory variables were measured by standard methods at an accredited routine laboratory (Fürst Medical Laboratory).
Blood sampling protocol
Venous blood samples were drawn after an overnight fast (≥ 10 h). Serum was obtained from silica gel tubes (Becton, Dickinson) and kept at room temperature for > 30–60 < min, until centrifugation (1500 g, 21°C, 15 min). Plasma was obtained from K2EDTA tubes (Becton, Dickinson and Company), immediately placed on ice and centrifuged within 10 min (2000 g, 4°C, 15 min). Lithium-heparin tubes (Becton, Dickinson) and K2EDTA tubes with whole blood were kept at room temperature.
Isolation of peripheral blood mononuclear cells
Whole blood was collected in a BD CPT™ Cell Preparation Tube (Becton, Dickinson) coated with sodium heparin, and PBMC were isolated according to the manufacturer’s instructions. Briefly, the CPT tubes were mixed by inverting the tubes eight times and then centrifuged (1650 g, 15 min, room temperature). The PBMC layer was transferred to a new tube (Corning® 50 ml centrifuge tubes, Merck) and washed twice with PBS, followed by centrifugation (300 g, 15 min, room temperature). After isolation, the PBMC pellets were snap-frozen without any storage solution and stored at –80°C until RNA extraction for RNA analyses.
RNA and reverse transcriptase quantitative PCR analysis
Total RNA from PBMC (5 million cells) was isolated using the RNeasy kit (Qiagen) according to the manufacturer’s instructions and under RNase-free conditions. Extra care was taken in ensuring high RNA quality by also performing DNase digestion (Qiagen) and measuring the 260/280 ratios. RNA concentration and purity were measured on a DS-11 spectrophotometer (DeNovix). Reverse transcription was performed using qScript cDNA Supermix (Quantabio) with 600 ng RNA input for all samples, and cDNA was diluted 1:10 in nuclease-free water before quantitative (qPCR).
Real-time qPCR was performed with Perfecta SYBR Green Supermix (Quantabio) and the CFX384 Real-Time, C1000 Touch PCR system (Bio-Rad) using the delta-delta Ct method. The primers used were manufactured by Sigma-Merck, all at a final concentration of 375 nM. PCR conditions were 95°C for 3 min, followed by 40 cycles of 95°C for 15 s and 60°C for 45 s. The results were analysed on the Bio-Rad CFX Maestro Software, and qPCR expression levels were normalised to the B2M reference gene. Primers are listed in online Supplementary Table S2.
Fatty acid measurement
Plasma was obtained in EDTA tubes and kept in the dark on ice. Erythrocytes were collected in EDTA tubes, centrifuged at 3200 rpm for 15 min within 30 min of collection, aliquoted and stored at –80°C. Samples were shipped on dry ice for FA analysis at Vitas Analytical Service.
The FA analyses were performed as previously described(Reference Ulven, Leder and Elind23). In brief, EDTA plasma was added to an internal standard (1,2-diheptadecanoyl-sn-glycero-3-phosphatidylcholine) and 3 n-methanolic HCl, mixed and heated at 80°C for 120 min. The resulting FA methyl esters were added to hexane and 3 m-KOH in water. GC analysis of the hexane phase was performed directly from this solution according to the method described below. Analyses were performed using a 7890 n GC with a split/splitless injector, a 7683B automatic liquid sampler and a flame ionisation detector (Agilent Technologies). Separations were performed with a SP-2380 (30 m × 0·20 mm i.d. × 0·25 µm film thickness) column from Supelco. Samples of erythrocytes were weighed into 2 ml GC vials. Internal calibrator triheptadecanoin dissolved in dichloromethane was added, and samples were methylated with 3N HCl in methanol at 50°C overnight. FAME were extracted with hexane, neutralised with KOH in water, and the organic phase was injected into the Gas Chromatography - Flame Ionisation Detector (GC-FID). Analysis was performed on an 8890 GC with a split/splitless injector, a 7693A automatic liquid sampler and a flame ionisation detector (Agilent Technologies). Separation was performed on a Trace Fatty Acid Methyl Esters (TR-FAME) (30 m × 0·25 mm i.d. × 0·25 µm film thickness) column from Thermo Scientific. The concentration of the individual fatty acids was measured as µg FA/ml plasma (Vitas Analytical Service).
The limit of detection for FA was 0·35 µg/ml (0·015 % for relative values), and values below the limit of detection were set to zero. This was applied largely to cetoleic acid; at baseline, 25 (100 %) and 23 (96 %) samples were set to zero for plasma values for the control and mackerel group, respectively. At the end of the study, 22 (88 %) and 2 (9 %) samples were set to zero for plasma values for the control and mackerel group, respectively. Similar changes were made for erythrocytes.
Statistics
Data were presented as medians (25th–75th percentile) for continuous variables and counts (percentage) for categorical variables. Linear regression was used to assess the between-group differences (mackerel group v. control group) in plasma and erythrocyte fatty acids at end-of-study, adjusted for baseline values. Prior to analysis, all FA variables were log-transformed; also, for visualisation in forest plots, log-transformed FA variables were further scaled to a standard normal distribution (mean = 0, sd = 1).
Linear regression was also used to assess the differences in PBMC gene expression (mRNA transcripts expressed as 2^-dCq values) at the end-of-study, adjusted for baseline values. Spearman’s correlation and linear regression analyses were used to examine the bivariate association between plasma FA and gene expression at the end of the study.
Sample size was determined based on expected changes in plasma levels of EPA and DHA. As this is a pilot study, we referenced previous research on the change of the n-3 index to estimate an anticipated 15 % difference between groups following the intervention(Reference Ottestad, Vogt and Retterstøl24,Reference Ulven, Kirkhus and Lamglait25) .
Sensitivity analyses were performed using linear mixed-effects models including fixed effects for time, treatment group and their interaction, with a random intercept for participant ID to account for repeated measurements. The treatment × time interaction term was used to assess whether changes over time differed between groups. The mixed-effects model approach has been shown to yield results consistent with the ANCOVA-based analyses (regression models adjusted for baseline values), which are statistically equivalent under standard assumptions and are commonly recommended for randomised trials(Reference Tutino, Schofield and Saracino26).
The FA composition of the study oils was provided by the manufacturer as mean values and CV, based on analyses of five individual capsules per oil (online Supplementary Table S1). Standard deviations were derived from the reported CV (sd = mean × CV). Differences between the mackerel oil and control oil were assessed using Welch’s two-sample t tests, calculated from summary statistics (means, standard deviations and sample size). Given the limited number of samples and the analytical nature of the measurements, these analyses should be interpreted with caution.
We set the significance level (α) at 0·05 and the desired power (1–β) at 0·80, resulting in a required sample size of 19 per group. To account for an anticipated dropout rate of 20 %, we adjusted the total sample size to 46 participants, with 23 in each group.
Statistical analyses and data visualisations were performed in R version 4.4.1 using RStudio version 2024.12.1. In all FA analyses, the differences between the two intervention arms at the end of the study were adjusted for baseline levels.
Results
Baseline characteristics
Forty-nine healthy subjects were included in the study: thirty-seven females and twelve males. The median age was 43 years (25–75 percentile; 28–56 years) with a median BMI of 24·2 (25–75 percentile; 22·2–26·6). Metabolic markers, including lipid profile, glucose and high-sensitive C-reactive protein, were within the normal range. Baseline characteristics are shown in Table 1.
Effect on the plasma fatty acid profile
Whereas there were no differences in baseline levels of FA, reported as absolute levels, between the two treatment groups, plasma levels of the PUFA 20:4n-3 (eicosatetraenoic acid, ETA) were significantly higher (P < 0·001) after 4 weeks in the mackerel group, despite similar n-3 PUFA content in the capsules (Table 2 and Figure 2). Plasma levels of the MUFA 20:1n9 (eicosenoic acid; P = 0·003) and, not surprisingly, 22:1n11 (cetoleic acid; P < 0·001) were also significantly higher in the mackerel group after 4 weeks (Table 2 and Figure 2).
Concentration of individual fatty acids in plasma at baseline and end-of-study. Bold indicates a p value <0.05 between groups

Table 2. Long description
Median (Q1–Q3); Wilcoxon rank-sum (exact) test.
Forty-nine healthy adults were randomised to receive either mackerel oil or control oil. Baseline-adjusted absolute and relative (weight % of FAME) changes in plasma and erythrocyte fatty acids after intervention are displayed as normalised β and 95 % CI.

Figure 2. Long description
The image contains multiple graphs showing the changes in fatty acid concentrations in plasma and erythrocytes after intervention with mackerel oil compared to control oil. The graphs are divided into four main categories: SFA, MUFA, n-6 PUFA, and n-3 PUFA. Each category is further divided into two subcategories: Absolute concentration (µg/mL) and Relative level (weight percent of FAME). Panel A: SFA (Saturated Fatty Acids) The first set of graphs shows the absolute concentration and relative level of various saturated fatty acids. The x-axis represents the normalized beta (β) values with 95 percent confidence intervals, comparing mackerel oil to control oil. The y-axis lists different fatty acids by their carbon chain length and saturation. The sum of SFA is also included. Panel B: MUFA (Monounsaturated Fatty Acids) The second set of graphs displays the absolute concentration and relative level of various monounsaturated fatty acids. Similar to the SFA graphs, the x-axis represents the normalized beta (β) values with 95 percent confidence intervals, and the y-axis lists different fatty acids by their carbon chain length and saturation. The sum of MUFA is also included. Panel C: n-6 PUFA (Omega-6 Polyunsaturated Fatty Acids) The third set of graphs shows the absolute concentration and relative level of various omega-6 polyunsaturated fatty acids. The x-axis represents the normalized beta (β) values with 95 percent confidence intervals, and the y-axis lists different fatty acids by their carbon chain length and saturation. The sum of n-6 PUFA is also included. Panel D: n-3 PUFA (Omega-3 Polyunsaturated Fatty Acids) The fourth set of graphs displays the absolute concentration and relative level of various omega-3 polyunsaturated fatty acids. The x-axis represents the normalized beta (β) values with 95 percent confidence intervals, and the y-axis lists different fatty acids by their carbon chain length and saturation. The sum of EPA+DHA and the sum of n-3 PUFA are also included. Each graph uses different symbols to represent plasma and RBC (erythrocytes) data, with color coding to indicate statistical significance levels.
A similar pattern was seen when the FA profile in plasma was reported as relative concentration (see online Supplementary Table S3 and Figure 2). Thus, whereas only the levels of SFA 14:0 were different between the two treatment groups at baseline (lower in the mackerel group), the mackerel group had higher levels of the MUFA 20:1n-9 (P = 0·005) and 22:1n-11 (P < 0·001) as well as the PUFA 20:4n-3 (ETA) (P < 0·001) as compared with the control group after 4 weeks. In addition, when the levels were assessed as relative levels, the mackerel group also had significantly higher levels of the MUFA 24:1n9 (nervonic acid) (P = 0·026), the PUFA 20:5n-3 (EPA) (P = 0·035) and the sum of total n-3 PUFA (P = 0·048), but not of 22:6n-3 (DHA) (Figure 2 and online Supplementary Table S3). There was no significant difference in plasma levels of 18:3n-3 (ALA) between the groups either at baseline or after 4 weeks, as assessed by both absolute and relative measurements (Table 2 and online Supplementary Table S3).
Treatment effects for time, treatment group and their interaction
We next performed sensitivity analyses using linear mixed-effects models, including fixed effects for time, treatment group and their interaction, with a random intercept for participant ID to account for repeated measurements. Overall, we found the same pattern as in the other analyses (online Supplementary Table S4). For example, there was a significant increase in 20:4n-3 over time in the mackerel oil group compared with the control, as indicated by a significant treatment × time interaction (e.g. for absolute concentration in plasma: β = 1·01, 95 % CI 0·55, 1·48, P < 0·001). However, in general, the main effect of time indicated a non-significant decrease in controls for most n-3 PUFA compared with a non-significant increase in the cetoleic group (online Supplementary Table S4).
Effects on fatty acid profile in erythrocyte membrane
Except for a lower level of the SFA 14:0, there were no significant differences in FA baseline levels between the two treatment groups as assessed by both absolute and relative levels in erythrocytes (Table 3, online Supplementary Table S3 and Figure 2). After 4 weeks, levels in the erythrocytes membrane of the MUFA eicosenoic acid (20:1n-9), cetoleic acid (22:1n-11) and nervonic acid (24:1n-9) were significantly higher in the mackerel group as expressed as both absolute and relative levels (Table 3, online Supplementary Table S3 and Figure 2). Expressed as both absolute and relative levels, the PUFA 20:4n-3 were also higher in the mackerel group after 4 weeks of intervention (Table 3, online Supplementary Table S3 and Figure 2). Levels of EPA, DHA or the n-3 index did, however, not differ between the treatment groups after 4 weeks, regardless of whether the FA levels were expressed as absolute or relative levels (Table 3, online Supplementary Table S3 and Figure 2).
Concentration and proportion of individual fatty acids in erythrocytes at baseline and end-of-study. Bold indicates a p value <0.05 between groups

Table 3. Long description
The table presents the concentration and proportion of individual fatty acids in erythrocytes at baseline and end-of-study for control and mackerel groups. It includes absolute concentrations of fatty acids in erythrocytes (µg/ml) and their sums for different categories of fatty acids. The table is divided into two main sections: Baseline and End-of-study, each with columns for Control and Mackerel groups. Each section provides median values and interquartile ranges (Q1-Q3) for various fatty acids. The fatty acids are listed by their carbon chain length and degree of unsaturation, such as 12:0, 14:0, 15:0, etc. The table also includes sums for specific categories like SFA (saturated fatty acids), MUFA (monounsaturated fatty acids), n-6 PUFA (n-6 polyunsaturated fatty acids), n-3 PUFA (n-3 polyunsaturated fatty acids), EPA + DHA, and total fatty acids. Notable trends include significant differences in the levels of certain fatty acids between the control and mackerel groups at the end-of-study, particularly for MUFA eicosenoic acid (20:1n-9), cetoleic acid (22:1n-11), nervonic acid (24:1n-9), and PUFA 20:4n-3. The boldface in the table highlights significant differences between the groups.
Effect on clinical, inflammatory and metabolic parameters
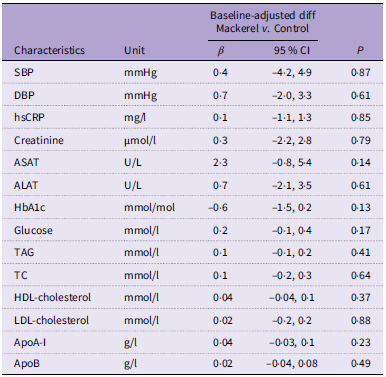
After the 4-week intervention, no significant changes were observed in blood pressure, kidney function markers, liver transaminases, high-sensitive C-reactive protein, HbA1C, fasting blood glucose or various lipid parameters between participants receiving cetoleic-rich mackerel oil and those receiving the control oil, after adjusting for baseline levels (Table 4). It is, however, important to underscore that most of these values were within normal limits at baseline in both treatment groups, and there were no changes in BMI or blood pressure in these healthy individuals (Table 1).
Effect of intervention on lipids and safety markers

Table 4. Long description
A table comparing the effects of mackerel oil and control oil on various health markers after a 4-week intervention. The table has 16 rows and 5 columns. The columns are labeled Characteristics, Unit, Baseline-adjusted diff Mackerel v. Control, 95 % CI, and P. The rows list different health markers and their respective units. The Baseline-adjusted diff Mackerel v. Control column shows the beta values, the 95 % CI column shows the confidence intervals, and the P column shows the p-values. Row 1: SBP, mmHg, 0.4, -4.2, 4.9, 0.87. Row 2: DBP, mmHg, 0.7, -2.0, 3.3, 0.61. Row 3: hsCRP, mg/l, 0.1, -1.1, 1.3, 0.85. Row 4: Creatinine, µmol/l, 0.3, -2.2, 2.8, 0.79. Row 5: ASAT, U/l, 2.3, -0.8, 5.4, 0.14. Row 6: ALAT, U/l, 0.7, -2.1, 3.5, 0.61. Row 7: HbA1c, mmol/mol, -0.6, -1.5, 0.2, 0.13. Row 8: Glucose, mmol/l, 0.2, -0.1, 0.4, 0.17. Row 9: TAG, mmol/l, 0.1, -0.1, 0.2, 0.41. Row 10: TC, mmol/l, 0.1, -0.2, 0.3, 0.64. Row 11: HDL-cholesterol, mmol/l, 0.04, -0.04, 0.1, 0.37. Row 12: LDL-cholesterol, mmol/l, 0.02, -0.2, 0.2, 0.88. Row 13: ApoA-I, g/l, 0.04, -0.03, 0.1, 0.23. Row 14: ApoB, g/l, 0.02, -0.04, 0.08, 0.49.
SBP, systolic blood pressure; DBP, diastolic blood pressure; hsCRP, high-sensitive C-reactive protein; ASAT, aspartataminotransferase; ALAT, alaninaminotransferase; TC, total cholesterol.
Effects on RNA levels of enzymes regulating long-chain PUFA in peripheral blood mononuclear cells
Lastly, we examined the effect of the two treatment arms on RNA expression in PBMC of FADS1, FADS2 and elongation of very long-chain fatty acids protein 5 (ELOVL5), all enzymes involved in the synthesis of long-chain PUFA such as EPA, DHA and the n-6 PUFA arachidonic acid(Reference Robichaud, Munganyiki and Boilard27). As shown in Figure 3(a), while there were no significant differences between the two treatment arms on the expression of FADS1 and FADS2, those who received the cetoleic-rich mackerel oil had a decrease in expression of ELOVL5 in PBMC as assessed by reverse transcriptase PCR. All values were corrected for baseline levels. In the control group, but not in the mackerel oil group, the change in ELOVL5 expression was significantly positively correlated with baseline levels of cetoleic acid (Figure 3(b)) and tended to be correlated with baseline levels of EPA (Figure 3(c)). No such correlations were found for changes in FADS1 and FADS2 expression in either of the treatment groups (Figure 3(b)–(c)). ELOVL2 has been proposed as an important regulatory step in the synthesis pathway.
RT-qPCR analysis of FADS1, FADS2 and ELOV5 RNA in PBMC from forty-nine healthy adults. ELOV2 RNA was not detected. (A) Relative gene expression of the enzymes between the mackerel and the control group when corrected for baseline value. (B) Correlation analysis of the enzymes against plasma cetoleic acid at baseline, (C) Correlation analysis of the enzymes to plasma EPA. RT-qPCR, reverse transcriptase quantitative polymerase chain reaction; FADS, fatty acid desaturase; ELOVL, elongation of very long-chain fatty acid; PBMC, peripheral blood mononuclear cells.

Liver is, however, the main organ for desaturation and elongation of FA(Reference Wang, Botolin and Xu28). In line with other literature(Reference Pan, Cavalli and Carlsson29), we did not detect ELOVL2 expression using qPCR analysis of RNA isolated from PBMC, using the hepatocyte cell line HepG2 as a positive assay control (data not shown).
Discussion
Cetoleic acid has been shown to promote n-3 PUFA generation in salmon and human HepG2 cells(Reference Østbye, Berge and Nilsson22), but data on these effects in humans are scarce. In this study, we show that individuals who were supplemented with mackerel oil for 4 weeks, naturally rich in cetoleic acid, had higher plasma levels of the n-3 PUFA 20:4n-3 (ETA) and 20:5n-3 (EPA), as well as some MUFA, in addition to cetoleic acid, as compared with the group receiving control oil. Importantly, there were no differences in baseline levels of these FA between the treatment groups (summarised in Figure 4). These changes, however, may not necessarily reflect induced conversion of ALA to downstream n-3 PUFA or other precursors in relation to the higher levels of MUFA but could also reflect other mechanisms, such as slower breakdown and metabolism. Moreover, although there were no statistical differences in the concentration of any of the PUFA between the two capsules, we cannot exclude that the numerically higher levels of some of the PUFA (i.e. 20:4n-3 was 3-fold higher, and to some degree its precursor 18:4n-3 was 5-fold higher) could have at least contributed to the increase in 20:4n-3 in the mackerel group. Moreover, the decrease of PUFA and EPA in the control group could have influenced some of the differences between the two treatment groups.
Summary of main results: elongation pathways of n-3 and n-6 were investigated in this study. Red colour if significantly higher, blue if significantly lower and black if not regulated after the cetoleic supplement. Grey indicates not measured/detected. AA, arachidonic acid; ALA, α-linoleic acid; LA, linoleic acid; ELOVL, elongation of very long-chain fatty acid; FADS, fatty acid desaturase; PBMC, peripheral blood mononuclear cells.

Figure 4. Long description
A diagram of the elongation pathways of omega-6 and omega-3 fatty acids. The diagram is divided into two main sections: Omega n-6 fatty acids on the left and Omega n-3 fatty acids on the right. Key enzymes involved in the pathways are labeled, including FADS2, ELOVL5, FADS1, and ELOVL2. The diagram shows the conversion of various fatty acids through a series of steps, indicated by arrows. For Omega n-6 fatty acids, the process starts with 18:2n-6 (LA) and progresses through several intermediates, including 18:3n-6, 20:3n-6, 20:4n-6 (AA), 22:4n-6, and 24:4n-6, eventually leading to 22:5n-6 and 24:5n-6. For Omega n-3 fatty acids, the process starts with 18:3n-3 (ALA) and progresses through several intermediates, including 18:4n-3, 20:3n-3, 20:4n-3, 20:5n-3 (EPA), 22:5n-3, 24:5n-3, and 24:6n-3, eventually leading to 22:6n-3 (DHA). The diagram also indicates peroxisomal beta-oxidation and retroconversion processes. Specific fatty acids and enzymes are highlighted in different colors to indicate their regulation status: red for significantly higher, blue for significantly lower, and black for not regulated after the cetoleic supplement. Grey indicates not measured or detected. The diagram includes labels for key fatty acids such as AA (arachidonic acid), ALA (alpha-linoleic acid), and LA (linoleic acid), as well as enzymes like ELOVL (elongation of very long-chain fatty acid) and FADS (fatty acid desaturase).
A previous study by Ulven et al. (Reference Bhatt, Steg and Miller10) found that intake of krill oil (3 g/d), a marine oil also rich in cetoleic acid and n-3 PUFA, increased the plasma levels of EPA and DHA after a 7-week intervention to a similar extent as cod liver oil, even if the n-3 PUFA dose of krill oil was only about 60 % of the cod liver oil dose. Both n-3 and n-6 PUFA use FADS2 for conversion to their end products; however, ALA has been shown to be a better substrate than LA for FADS2(Reference Sprecher and Chen30). However, in the present study, we have no data to support an enhanced cetoleic acid-mediated endogenous conversion of ALA to EPA and DHA.
Although erythrocytes have an approximately 3-month turnover, we found that the FA gondoic acid (20:1n-9) and, not surprisingly, cetoleic acid (22:1n-11) and nervonic acid (24:1n-9), both with significantly higher levels in the mackerel than in the control capsules, were incorporated into the erythrocytes membrane already after a 4-week intervention. More importantly, those who received the cetoleic-rich capsules had higher levels of 20:4n-3 (ETA) in the erythrocytes membrane than those receiving control capsules. Although less studied than EPA and DHA, we have previously shown that low plasma levels of 20:4n-3 (ETA) is a risk factor for disease severity and mortality in patients with chronic heart failure(Reference Øie, Ueland and Dahl31), suggesting a potential beneficial effect of an increase in this PUFA. However, the levels of 20:4n-3 is erythrocytes is in general low, and the importance of the higher levels could be questionable(Reference Buoncristiani, Howard and Otsuka32).
Synthesis of n-6 and n-3 fatty acids is mediated by desaturases and elongases, and the main organ in rodents and humans is the liver(Reference Valenzuela, Metherel and Cisbani33), but synthesis can also be operating in lymphocytes(Reference Robichaud, Munganyiki and Boilard27). While there were no significant differences between the two treatment arms on the expression of FADS1 and FADS2, those who received the cetoleic-rich mackerel oil had a decrease in RNA expression of ELOVL5 in PBMC as assessed by reverse transcriptase PCR (summarised Figure 4). However, the regulation of these enzymes is complex, and the down-regulation could be a feedback mechanism due to an increase in the enzyme product(Reference Metherel, Valenzuela and Klievik34). Further, these analyses were done in PBMC that may not necessarily reflect the expression in the liver. Moreover, although the enzyme activity of ELOVL2 influences the synthesis of EPA(Reference Metherel, Valenzuela and Klievik34), we have no firm data on either activity or expression of this enzyme in the present study. Based on these data, we have no data to prove that the higher levels of 20:4n-3 and 20:5n-3 in the mackerel group could reflect cetoleic acid-mediated enhancement of the conversion of α-linolenic acid to n-3 PUFA.
We found no differences in lipid or glucose parameters or high-sensitive C-reactive protein between the two treatment groups. Importantly, however, the participants in the study were healthy subjects and had levels of these parameters within normal limits at inclusion, and forthcoming studies should be performed in patients with or at risk for CVD or metabolic disorders to be able to explore the effects of cetoleic acid on cardiometabolic risk. Such studies should also be performed over a longer period of time, have a considerable and clinically relevant increase in the n-3 index in erythrocytes, that was not increased in the present study, and should be validated not only in high fish-intake population such as in Norway but also in low fish-intake population(Reference Ricci, Gaeta and Franchi1,Reference von Schacky and Harris35,Reference Jackson, Polreis and Tintle36) .
The conversion of ALA to n-3 PUFA is, in general, poor(Reference Arterburn, Hall and Oken37), and one could argue that the levels of ALA in the study cohort could have influenced the results. The intervention supplement contains 0·08 g ALA/d and the median absolute plasma levels of ALA at baseline and at the end of the study were between 15 and 19 ug/ml with no significant differences between the two study arms. Moreover, in Norway, the average daily intake is approx. 2·2 g ALA/d(Reference Myhre, Brodin and Andersen38), which is in contrast to 1·3 g ALA/d in Americans(Reference Arterburn, Hall and Oken37). Nonetheless, it could be of interest that in forthcoming studies, one could test cetoleic acid with and without ALA.
The present study has several limitations. As the FADS1 genotype, an enzyme of major importance for the conversion of ALA to EPA and DHA, varies greatly around the world, the lack of data on this genotype is a limitation of the study and reduces the transferability of data from this study to countries outside Europe. We do not know whether 4 weeks was a long enough duration to see the effects on all the parameters measured, and this should be examined in forthcoming studies. Moreover, although we adjusted for baseline levels of FA, the lack of stricter standardisation of food intake (e.g. avoiding all fishmeals) is a potential limitation of the study. Furthermore, the enzyme data should be interpreted with caution, as we have no activity data or data from the liver, the main organ for the actual enzymes, and in PBMC, RNA levels and not activity data. Also, although the intervention showed an effect on EPA levels, there was no effect on DHA and the n-3 index, which was part of the primary outcome. Moreover, although not statistically significant, some n-3 PUFA had numerically higher levels in the mackerel as compared with control capsules. Finally, the study was performed in healthy individuals, and the results may not necessarily be transferred to various relevant patient groups.
Our data suggest that cetoleic-rich mackerel oil may result in higher levels of certain n-3 PUFA as compared with the control oil. Forthcoming and preferably longer studies in individuals at risk for CVD could investigate if such supplementation could influence more robust markers for CVD risk, such as the n-3 index in erythrocytes.
Supplementary material
To view supplementary material for this article, please visit https://doi.org/10.1017/S0007114526107958
Acknowledgements
The authors would like to thank Epax® (Pelagia AS) for providing the study oil.
The project was funded by the Norwegian Seafood Research Fund (project 901591), the Throne Holst Foundation for Nutrition Research and the University of Oslo. ClinicalTrials.gov Identifier: NCT04841044
K. B. H.: Conceptualisation-Lead, Funding acquisition-Lead, Investigation-Lead, Project administration-Lead, Supervision-Lead, Writing – original draft-Lead, Writing – review and editing-Lead; T. B. D.: Data curation-Equal, Project administration-Equal, Writing – original draft-Lead, Writing – review and editing-Lead; P. B.: Data curation-Equal, Formal analysis-Equal, Investigation-Equal, Project administration-Equal, Writing – review and editing-Equal; J. J. C.: Data curation-Equal, Formal analysis-Equal, Writing – review and editing-Equal; I. O.: Data curation-Equal, Investigation-Equal, Methodology-Equal, Writing – review and editing-Equal; A. R.: Investigation-Equal, Methodology-Equal, Writing – review and editing-Equal; B. R.: Conceptualisation-Equal, Investigation-Equal, Methodology-Equal, Writing – review and editing-Equal; S. H.: Investigation-Equal, Methodology-Equal, Writing – review and editing-Equal; P. A.: Investigation-Equal, Methodology-Equal, Writing – original draft-Equal, Writing – review and editing-Equal; Y. S.: Formal analysis-Equal, Methodology-Equal, Writing – review and editing-Equal; I. S. H.: Data curation-Equal, Investigation-Equal, Writing – review and editing-Equal; V. H. T-H.: Investigation-Equal, Methodology-Equal, Writing – review and editing-Equal; K. R.: Data curation-Equal, Investigation-Equal, Methodology-Equal, Writing – review and editing-Equal; S. M. U.: Conceptualisation-Lead, Funding acquisition-Supporting, Investigation-Equal, Methodology-Equal, Writing – review and editing-Equal; B. E. H.: Conceptualisation-Lead, Funding acquisition-Lead, Investigation-Equal, Methodology-Equal, Project administration-Equal, Writing – original draft-Equal, Writing – review and editing-Equal.
During the past 5 years, K. B. H. has received research grants or honoraria from Sanofi, Amgen, Menarini and Ultragenyx, none of which are related to the contents of this manuscript. A.R. is at the time of submission employed at Novo Nordisk Norway AS.
The study was approved by the Committee for Medical Research Ethics Region Southeast Norway (approval no. 176979) and performed according to the Declaration of Helsinki. All participants gave informed consent. The study was also registered in clinicaltrials.gov (NCT04841044, 08.04.21).
The datasets used and/or analysed during the current study are available from the corresponding author on reasonable request.





 Open access

