Introduction
Over recent decades, the mid- and high-latitude Southern Hemisphere atmosphere and climate has undergone major changes (Jones et al. Reference Jones, Gille, Goosse, Abram, Canziani, Charman, Clem, Crosta, de Lavergne, Eisenman, England, Fogt, Frankcombe, Marshall, Masson-Delmotte, Morrison, Orsi, Raphael, Renwick, Schneider, Simpkins, Steig, Stenni, Swingedouw and Vance2016). Since the 1950s, the Southern Ocean mid-latitudes have experienced a weaker westerly flow, while around Antarctica, a stronger atmospheric circumpolar flow has been observed (Thompson & Wallace Reference Thompson and Wallace2000). Within the maritime sub-Antarctic, there has been a significant warming trend in air surface temperatures at individual stations (Richard et al. Reference Richard, Rouault, Pohl, Crétat, Duclot, Taboulot, Reason, Macron and Buiron2013). In particular, maritime sub-Antarctic islands are extremely sensitive to climatic change and can therefore be considered early identifiers of large-scale climate change (Selkirk Reference Selkirk2007). The islands in the sub-Antarctic are some of the most pristine places in the world, where human activities and impacts are often limited to research stations. This enhances the value of this locality for the investigation of various topics, especially those related to natural processes occurring in the environment.
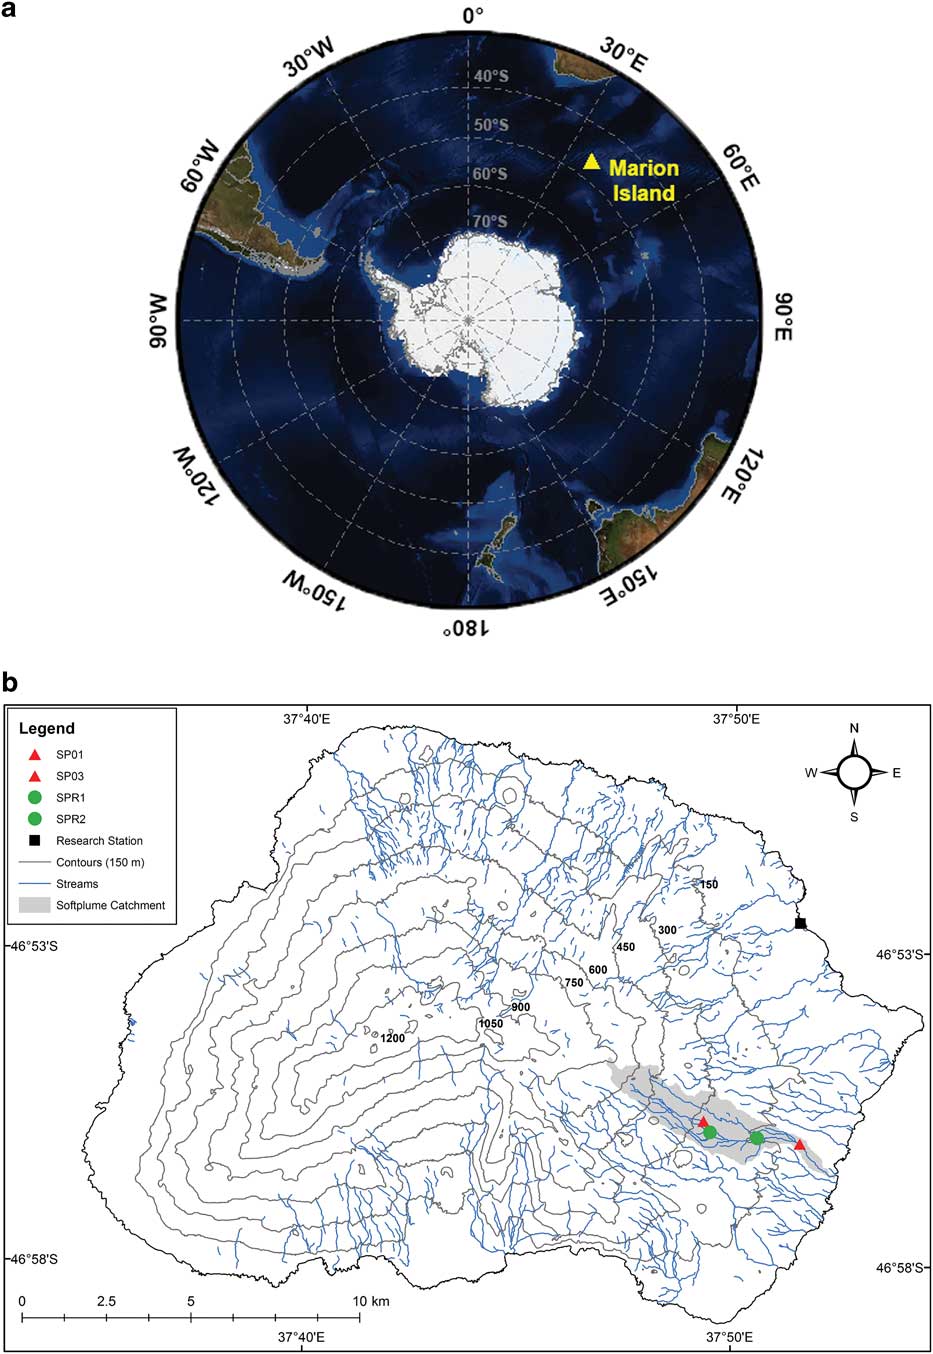
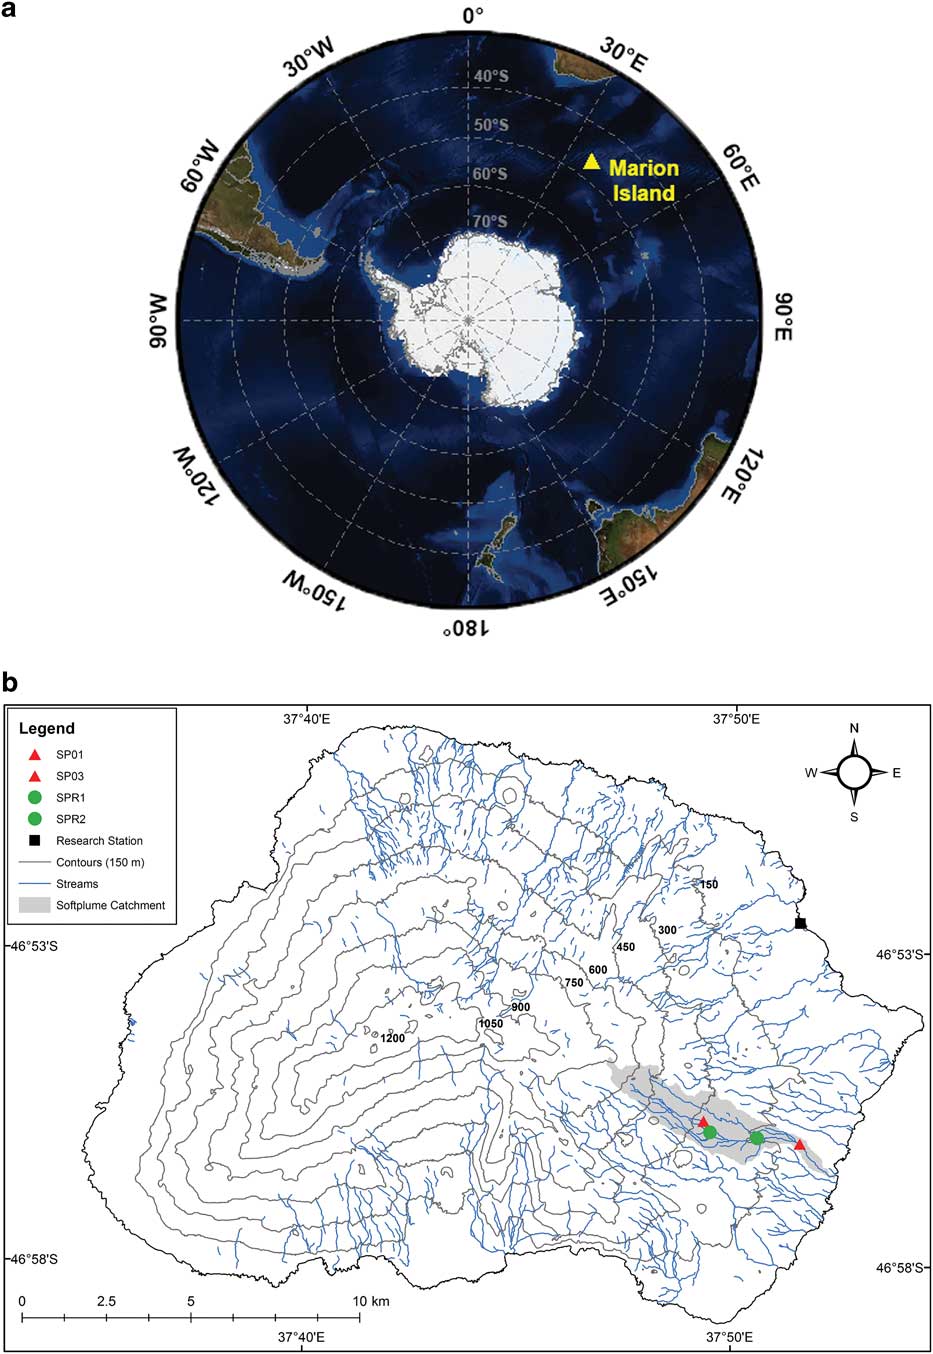
Positioned at the interface between the sub-Antarctic Front and Antarctic Polar Front in the Indian sector of the Southern Ocean, Marion Island (Fig. 1a) is ideally placed to contribute to understanding environmental change in the Southern Hemisphere. Therefore, observations from the island can provide valuable information pertaining to the nature of regional environmental change in the sub-Antarctic (Selkirk Reference Selkirk2007). Given the observed warming and drying trends in temperature and precipitation on Marion Island (e.g. Rouault et al. Reference Rouault, Melice, Reason and Lutjeharms2005, Le Roux & McGeoch Reference Le Roux and McGeoch2008), coupled with changes in the relative intensity and frequency of mid-latitude synoptic systems that affect the island (Jones et al. Reference Jones, Gille, Goosse, Abram, Canziani, Charman, Clem, Crosta, de Lavergne, Eisenman, England, Fogt, Frankcombe, Marshall, Masson-Delmotte, Morrison, Orsi, Raphael, Renwick, Schneider, Simpkins, Steig, Stenni, Swingedouw and Vance2016), there is a need to examine past and current hydroclimatic dynamics. This ought to provide information on how these systems may potentially respond to future climatic change.
a. Location of Marion Island in relation to other major landmasses. b. Map of Marion Island indicating stream sampling (SP01, SP03) and rainfall collection (SPR1, SPR2) sites along the Soft Plume River (SPR). All streams are included for reference.
The stable isotope (δ2H and δ18O) composition of precipitation and surface water can provide valuable insight into numerous hydroclimatic processes at multiple temporal and spatial scales (Lachniet & Patterson Reference Lachniet and Patterson2009). Insight into the controls on the isotope composition of present-day water has significant importance for climatic (Rozanski et al. Reference Rozanski, Araguas-Araguas and Gonfiantini1993), hydrological (Halder et al. Reference Halder, Terzer, Wassenaar, Araguás-Araguás and Aggarwal2015) and palaeoenvironmental studies (Amesbury et al. Reference Amesbury, Charman, Newnham, Loader, Goodrich, Royles, Campbell, Keller, Baisden, Roland and Gallego-Sala2015). Therefore, gaining a better understanding of water isotope composition through space and time is important for identifying variability in atmospheric systems (Lachniet & Patterson Reference Lachniet and Patterson2009). Owing to the inherent connection between hydrology and climate, the isotope composition of meteoric waters is often used in combination with isotopes from proxies, such as vascular plant cellulose in ombrotrophic peatlands (Amesbury et al. Reference Amesbury, Charman, Newnham, Loader, Goodrich, Royles, Campbell, Keller, Baisden, Roland and Gallego-Sala2015), to interpret archives relative to palaeoenvironmental research.
Variations in the isotope composition of precipitation depend on many factors. These include moisture sources and precipitation and rainout history of the cloud, temperature of condensation, as well as evaporation below the cloud base (Dansgaard Reference Dansgaard1964). Together with surface water δ2H and δ18O, these factors control the initial isotopic composition of vapour arriving at oceanic islands (Bowen Reference Bowen2008). Subsequent variation in the isotope composition of precipitation are a result of geographical (i.e. latitude, continentality and altitude) and climatic processes (e.g. temperature and precipitation fluctuations; Rozanski et al. Reference Rozanski, Araguas-Araguas and Gonfiantini1993, Feng et al. Reference Feng, Faiia and Posmentier2009). These climatic factors influence the variation in precipitation δ2H and δ18O (Dansgaard Reference Dansgaard1964) through the seasonality of temperature (‘temperature effect’, positive empirical relationship with mean surface air temperature) and precipitation (‘amount effect’, negative relationship between precipitation δ18O and rainfall amount).
Topography is known to interact with local atmospheric circulation by lifting atmospheric moisture, influencing the distribution and amount of rainfall (Basist et al. Reference Basist, Bell and Meentemeyer1994). Heterogenous rainfall patterns can also result in a localized ‘amount effect’ characterized by orographically induced differences in precipitation amounts being associated with lower (higher) isotope ratios with higher (lower) rainfall amounts (Dansgaard Reference Dansgaard1964). This orographic forcing, known as the ‘altitude effect’, affects the isotopic of precipitation through the adiabatic lift of moisture causing fractionation and resulting in lower isotope values at higher elevations (Ambach et al. Reference Ambach, Dansgaard, Eisner and Møller1968).
Coupled with precipitation, hydrogen and oxygen isotopes in stream water provide complementary information that is able to advance understanding of hydroclimatic systems in a region (Lachniet & Patterson Reference Lachniet and Patterson2009). This is because stream water δ2H and δ18O are considered a spatially and temporally integrated isotopic signal that can reflect multiple environmental and hydrological processes (Kendall & Coplen Reference Kendall and Coplen2001). Differences between the isotope composition of stream water and precipitation are generally observed in larger catchments with varying altitude (Halder et al. Reference Halder, Terzer, Wassenaar, Araguás-Araguás and Aggarwal2015). Variation in stream water isotope content is strongly dependent on elevation within a catchment, with high-elevation headwaters having generally low δ2H and δ18O values compared to lower elevation sections of a stream, except under altitudinal gradients of less than 200 m (Kendall & Coplen Reference Kendall and Coplen2001). Moisture source origins and synoptic types are reflected in stream water δ2H and δ18O (Dutton et al. Reference Dutton, Wilkinson, Welker, Bowen and Lohmann2005). The isotopic composition of stream water is therefore able to provide information pertaining to specific climatic processes and variability that directly influence the hydrology of a catchment.
Although sub-Antarctic maritime environments are some of the most sensitive regions to climate change, understanding of isotopic and hydrochemical dynamics on sub-Antarctic islands is limited. Here we present δ2H and δ18O values of monthly precipitation and stream water from the Soft Plume River on sub-Antarctic Marion Island collected between 2015–16. While a precipitation δ2H and δ18O dataset exists for the island, sample collection as part of the Global Network of Isotopes in Precipitation (GNIP) programme began in 1960 and ended in 2013, so our study represents a valuable addition to the precipitation isotope data archive. The stream water δ2H and δ18O values presented are the first for Marion Island. We investigate seasonal variation, as well as examine spatial differences in the isotopic composition of precipitation and stream water. We also investigate diurnal variation in stream water δ2H and δ18O along the stream and its response to local precipitation variability. By integrating precipitation and stream water isotope data, we aim to advance understanding of isotopic and hydrochemical dynamics on sub-Antarctic Marion Island.
Study area
Regional setting
Marion Island (46°54′S and 37°51′E) is part of the Prince Edward Islands and is situated in the Indian sector of the Southern Ocean (Fig. 1a). The island is the tip of a shield volcano and has an area of±293 km2 and peak elevation (Mascarin Peak) at 1240 m above mean sea level (a.m.s.l.) (Hedding Reference Hedding2008). From the central plateau, the eastern and northern sectors slope gently towards an undulating coastal plain, ~5 km wide. On the western and southern sectors of the island, the coastal plain is narrower (~900 m wide) and is met by a steep escarpment that rises to the interior. The island’s geology consists primarily of basaltic lava (Le Roex et al. Reference Le Roex, Chevallier, Verwoerd and Barends2012).
Climate
Marion Island’s hyper-maritime position results in a distinct climatic regime. Synoptic climate for the island is characterized by mid-latitude cyclones, frontal systems and anticyclones (Rouault et al. Reference Rouault, Melice, Reason and Lutjeharms2005). These cyclones make their way from west to east, embedded in the westerly storm track.
The island experiences high precipitation amounts, mostly falling as rainfall, which is approximately evenly distributed throughout the year. Mean annual precipitation and air surface temperature are 2243 mm and 5.9°C (1949–2014), respectively. The island has a mean daily temperature of <2°C and 3°C in winter and summer, respectively. Seasonal differences in mean air temperature are ~4°C. Coupled with these conditions are high relative humidity, cloud cover and strong (>8.4 m sec-1) westerly to north-westerly winds (Le Roux & McGeoch Reference Le Roux and McGeoch2008).
As with other volcanic islands, climatic conditions on Marion Island are modified by its topography. As a result, conditions recorded at the research station may be different to elsewhere on the island. Blake (Reference Blake1996) found total annual rainfall at mid-altitude (4653 mm, ~550 m a.m.s.l.) to be higher than a lower elevation site (2873 mm, 34 m a.m.s.l.). While there appears to be an altitudinal precipitation for certain areas of the island, its extent will vary with the topography and landscape position of the study sites. Marion Island experiences considerable spatial variability in climate, but a detailed understanding is yet to emerge (Blake Reference Blake1996).
Study site
Perennial streams are uncommon on the island. Because porous lavas dominate much of the island’s topography, precipitation infiltrates rapidly with the majority reaching the sea via underground recharge (Grobbelaar Reference Grobbelaar1975). The Soft Plume River (SPR) is the only perennial stream on the island. The SPR is located on the eastern side of the island and flows through one of the larger catchments (~5.26 km2) (Fig. 1b). Elevation in the catchment varies between ~650 m a.m.s.l. at the lava peaks and ~15 m a.m.s.l where the stream enters the ocean. The upper reaches of the stream are shallow, with stream banks of varying gradients that depend on topography. The banks of the SPR are usually steep in the lower reaches owing to fluvial erosion and consist mainly of peat. The stream bottom varies in composition. In the upper reaches of the stream, rocky and more granular substrate dominate, whereas, along the lower reaches peat is predominantly found (Grobbelaar Reference Grobbelaar1975).
As the only perennial stream on the island, the SPR provides a unique opportunity to investigate spatiotemporal dynamics over the entire cycle of annual hydroclimatic variability. Currently, no stream water δ2H and δ18O dataset exists for the island. To address this knowledge gap, two sites along the SPR were identified. The two study sites span an altitudinal range of ~150 m. The highest site, SP01, is at ~253 m a.m.s.l., while the lower site, SP03, is located at ~103 m a.m.s.l. (Fig. 1b).
Methods and data
Sample collection
Precipitation and stream water samples were collected during two separate field campaigns. Monthly precipitation samples were collected at the research station on Marion Island (46°53′S, 37°52′E, 24 m a.m.s.l, Fig. 1b) from April 2015 to April 2016. Precipitation samples were collected in a standard rain gauge situated 1.2 m above the ground, with no structures nearby. The collector was emptied manually daily at 05h45 GMT +3. The collected water was transferred into a high-density polyethylene bottle containing the composite monthly sample and stored in a cool, dark place in the research station.
Stream water samples were collected from the SPR (Fig. 1b). Samples were collected daily at approximately the same time from two sites along the stream (SP01 and SP03) over a 16 day period (21 April 2015 – 6 May 2015). Quasi weekly samples were collected only at SP03 from May 2015 to May 2016. Samples were collected in 60 ml glass bottles from ~20 cm below the surface. Sample bottles were rinsed three times with sample water before final collection. The rinsed bottles were filled to the brim to ensure that no air space was present and sealed tightly. Samples were returned immediately to the research station on Marion Island where they were given an additional seal of Parafilm (Bemis Flexible Packaging, Neenah, WI, USA) to prevent any potential evaporation.
Sample analysis
All samples were analysed for oxygen and hydrogen stable isotopes at the Geological Science Laboratory, University of Cape Town, South Africa. Stream water samples collected over the April/May 2015 field campaign were analysed following Harris et al. (Reference Harris, Burgers, Miller and Rawoot2010). Oxygen was analysed using the CO2 equilibration method of Socki et al. (Reference Socki, Karlsson and Gibson1992) with pre-evacuated glass vials (7 ml). Hydrogen was analysed using the closed-tube-Zn-reduction method, whereby sample water was converted to H2 using disposable aliquots of Zn in individual reaction vessels (Coleman et al. Reference Coleman, Shepherd, Durham, Rouse and Moore1982). A microcapilliary tube containing 2 mg of water was placed into a Pyrex tube containing 100 mg of Indiana Zn (Schimmelmann & DeNiro Reference Schimmelmann and Deniro1993). The Pyrex tube was then attached to the vacuum line, frozen in liquid nitrogen, evacuated and then sealed using a torch. Once a sufficient number of samples had been prepared, the batch was placed in a furnace at 450°C, allowing the sample to reduce to H2. Isotope ratios of CO2 and H2 were measured using a ThermoFinnigan DELTAplus XP mass spectrometer in dual inlet mode. A fractionation factor of 1.0412 between CO2 and water was used to convert raw CO2 δ18O values to those of water (Coplen Reference Coplen1988).
The isotope ratios are expressed in the δ notation, where:
 $${\rm \rdelta X}\,{\equals}\,\left[ {\left( {{\rm R}_{{{\rm sample}}} \,/\,{\rm R}_{{{\rm standard}}} } \right)-{\rm 1}} \right]{\times}{\rm 1}0^{{\rm 3}}\, ‰,$$
X is 18O or 2H, and Rsample and Rstandard are the ratios of heavy to light isotope in the sample and standard, respectively. All δ2H and δ18O values are reported relative to the Vienna Standard Mean Ocean Water (V-SMOW). For samples analysed using isotope ratio mass spectrometry, two internal standards were analysed in duplicate (O) or triplicate (H) with each batch of samples. These standards, CTMP2010 (Cape Town Millipore Water 2010) and RMW (Rocky Mountain Water), have calibrated δ2H and δ18O values of -7.4‰ and -2.74‰, and -131.4‰ and -17.38‰, respectively, and were calibrated using a range of international standards, including V-SMOW and standard light Arctic precipitation (SLAP). The values obtained for the internal standards were used to convert raw data to the V-SMOW scale and to correct for scale compression. The precision of analyses, determined by repeat measurements of standard materials, was better than 2.0‰ and 0.2‰ for δ2H and δ18O, respectively.
Precipitation and stream water samples collected between April 2015 and April 2016 were analysed by wavelength-scanned cavity ring-down spectroscopy (WS-CRDS) using a L2120-i (Picarro, Sunnyvale, CA, USA). For each sample, six injections were made, with the first three being discarded to avoid memory effects. Following the methodology of West et al. (Reference West, February and Bowen2014), all WS-CRDS samples were screened post-analysis by Chemcorrect version 1.0.0. None of the water samples were identified as problematic. The Adam’s CTMP (δ2H=-0.2‰, δ18O=-0.78‰) and RMW standards were used to convert raw data to the V-SMOW scale, and to correct for drift and scale compression. Evian water was analysed as an unknown every ten analyses and gave δ2H and δ18O values of -71.6‰ (1σ=1.36, n=12) and -10.33‰ (1σ=0.33, n=12), respectively. The accepted values for Evian water are -73.1‰ and -10.2‰ (Spangenberg & Vennemann Reference Spangenberg and Vennemann2008).
Meteorological data
In addition to precipitation samples from this study (n=13), long-term monthly precipitation δ2H and δ18O values from Marion Island were extracted from the GNIP database (http://www.iaea.org/water, accessed July 2016). These data cover the period 1961–2013 (n=185) and precipitation samples with deuterium excess values less than 0‰ (n=15) were removed from the raw dataset. All precipitation samples were collected manually at the research station and analysed at numerous laboratories using different techniques.
Tipping bucket rain sensors (rainfall sensor RS-100, Pace Scientific, Mooresville, NC, USA) were installed at ~213 m a.m.s.l. (SPR1) and ~147 m a.m.s.l. (SPR3) to monitor spatiotemporal variability of precipitation along the stream (Fig. 1b). These rain gauges were equipped with data loggers (XR5-SE, Pace Scientific) and set to recorded rainfall amounts at five minute intervals for the duration of the field campaign (21 April–6 May 2015). Precipitation and air surface temperature data recorded at the research station was obtained from the South African Weather Service (SAWS, Fig. 1b). Discharge was not measured in the SPR.
All data were processed, analysed and plotted using R statistical software (version 3.3.0).
Results
δ2H and δ18O in precipitation and stream water
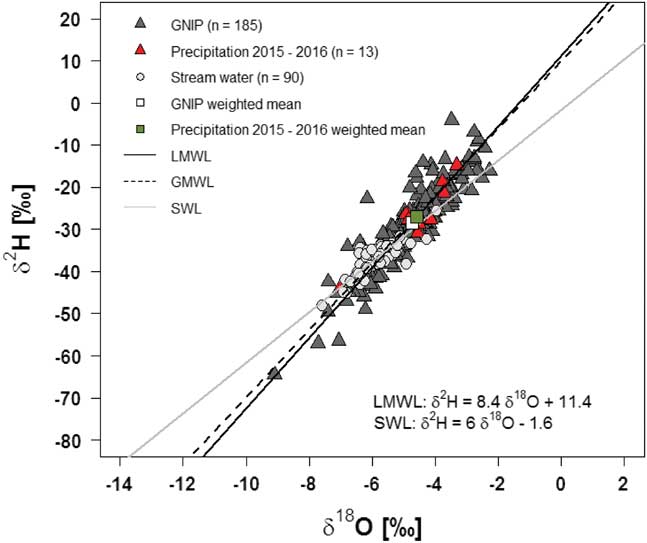
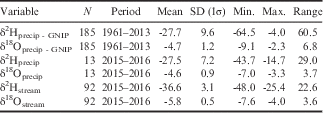
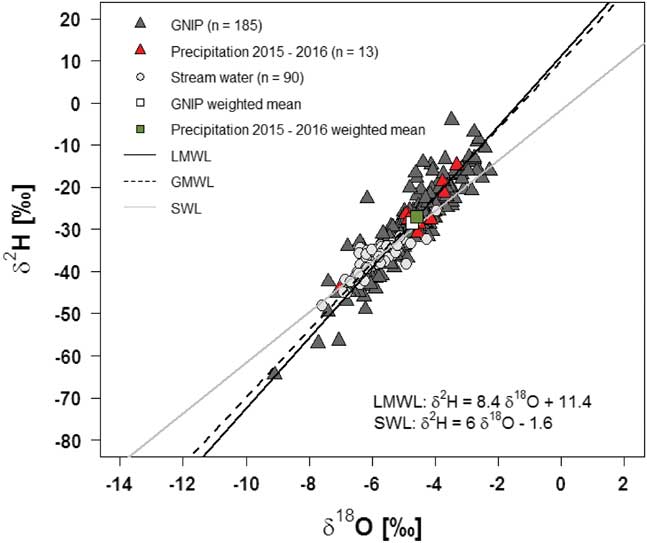
The precipitation and stream water data collected in this study are provided in Table S1 found at http://dx.doi.org/10.1017/S0954102017000475. All precipitation and stream water δ2H and δ18O values are plotted in Fig. 2, with a statistical analysis presented in Table I. Precipitation δ2H (Mann–Whitney Z value=-0.11, P=0.9) and δ18O (Z=0.15, P=0.88) were not significantly different to the long-term GNIP data. Significantly higher δ2H (Z=9.28, P<0.00001) and δ18O (Z=9.07, P<0.00001) values are observed in all monthly precipitation data compared to stream water.
Monthly averaged δ2H vs δ18O values for precipitation and stream water from Marion Island. GNIP=Global Network of Isotopes in Precipitation, LMWL=local meteoric water line, GMWL=global meteoric water line (Craig Reference Craig1961), SWL=surface water line.
Data for precipitation and stream water δ2H and δ18O (‰) on Marion Island.

Precipitation values are from monthly samples collected at the research station.
Stream water values represent grab samples collected at SP01 and SP03.
GNIP=Global Network of Isotopes in Precipitation, SD=standard deviation.
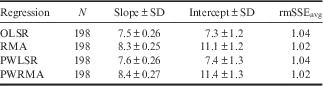
Local meteoric water lines (LMWL), both amount-weighted and unweighted, for Marion Island were determined on all precipitation data (n=198). The results of each regression are displayed in Table II. The precipitation-weighted (PW) reduced major axis (RMA) LMWL for the island was δ2H=8.4δ18O+11.4. Stream water δ2H and δ18O from the SPR yielded a surface water line (SWL) defined as δ2H=6δ18O−1.6, using an RMA regression model. The ordinary least squares regression (OSLR)-derived SWL was δ2H=4.9δ18O−7.8.
Slopes and intercepts of local meteoric water lines (LMWLs) determined following Hughes & Crawford (Reference Hughes and Crawford2012) and Hughes et al. (2014) with standard errors for unweighted and precipitation-weighted regressions.
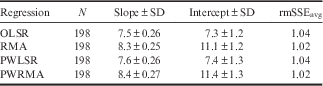
rmSSEavg (root mean sum of standard errors (averaged)) was calculated according to Crawford et al. (Reference Crawford, Hughes and Lykoudis2014).
OLSR=ordinary least squares regression, PWLSR=precipitation-weighted least squares regression, PWRMA=precipitation-weighted reduced major axis regression, RMA=reduced major axis regression, SD=standard deviation.
The GNIP δ18O data exhibited a moderate, significant positive correlation with mean air surface temperature (r=0.39, P<0.001) and a weak negative correlation with total monthly rainfall amount (r=-0.24, P<0.05) measured at the research station. Similarly weak, albeit non-significant, relationships were found for mean air surface temperature (r=0.35, P=0.2) and total monthly rainfall amount (r=0.2, P=0.52) with precipitation δ18O values.
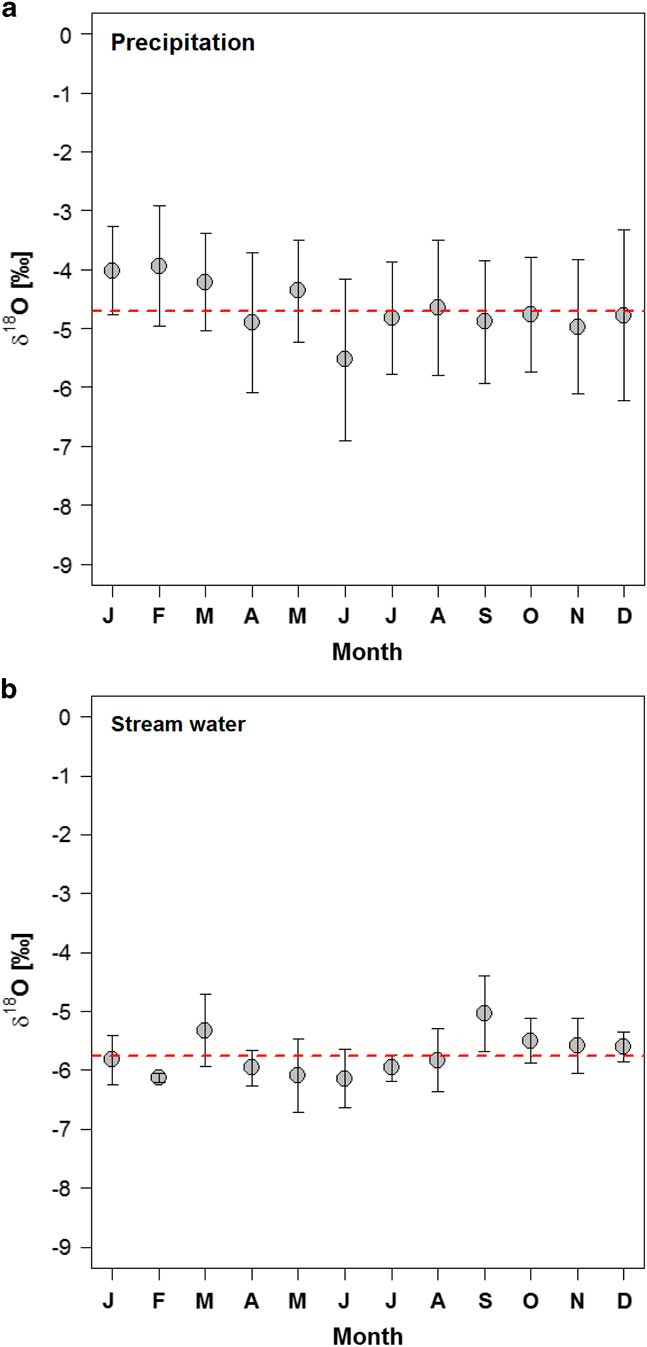
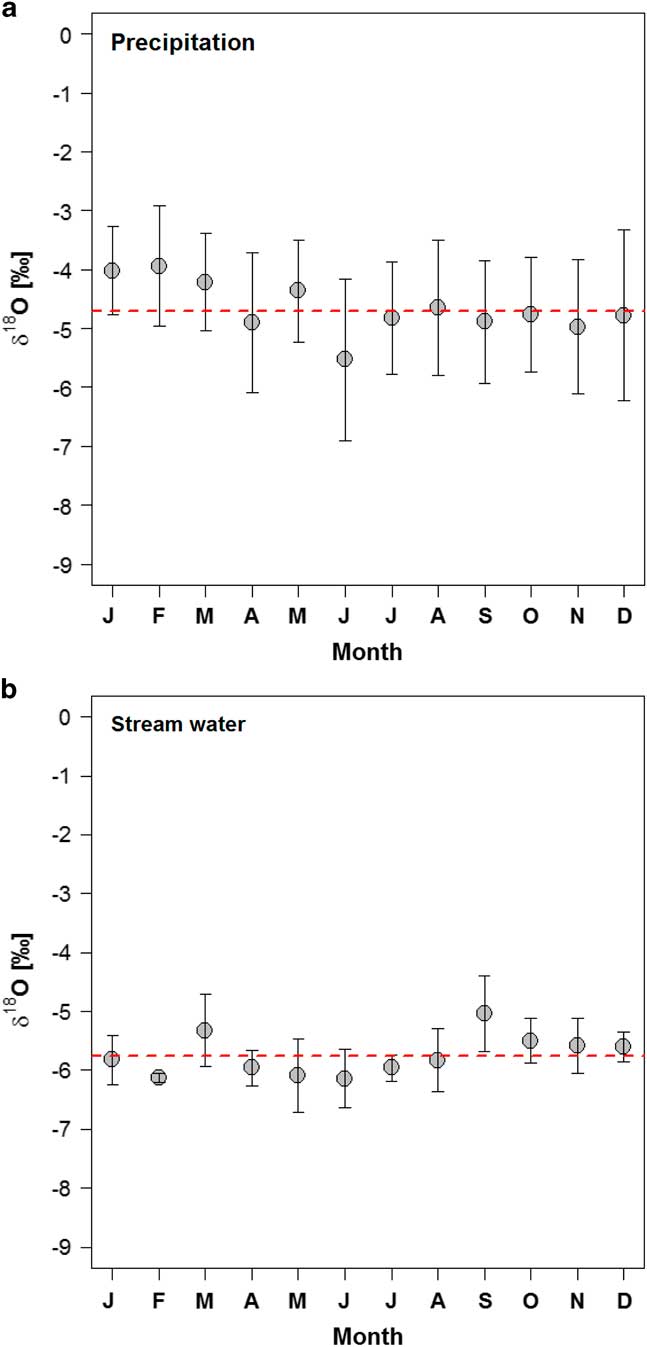
Temporal variability of δ18O in precipitation and stream water is presented in Fig. 3a & b. There was no clear isotopic seasonality in all precipitation and stream water δ18O mean values (Fig. 3a & b). For both precipitation and stream water, the lowest mean δ18O values were found in winter months. Temporal variation in stream water δ18O is dampened compared to that in precipitation.
Temporal variation of δ18O for monthly a. precipitation and b. stream water. Grey circles indicate arithmetic monthly mean values and error bars represent the 1σ spread of each month’s mean value. The red dashed lines are the arithmetic mean δ18O values of all precipitation (-4.6‰) and stream water (-5.8‰) samples.
Daily time series
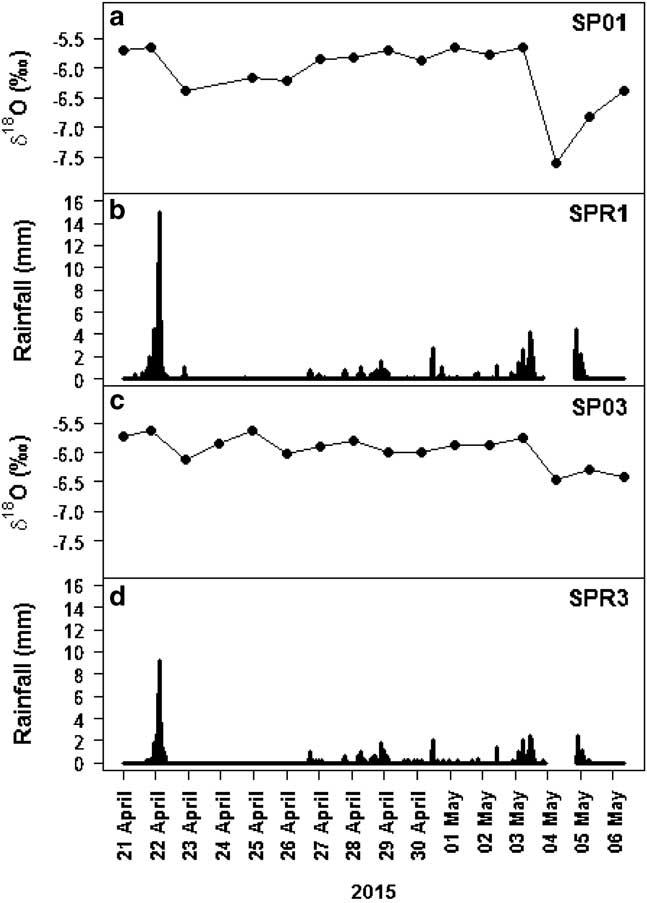
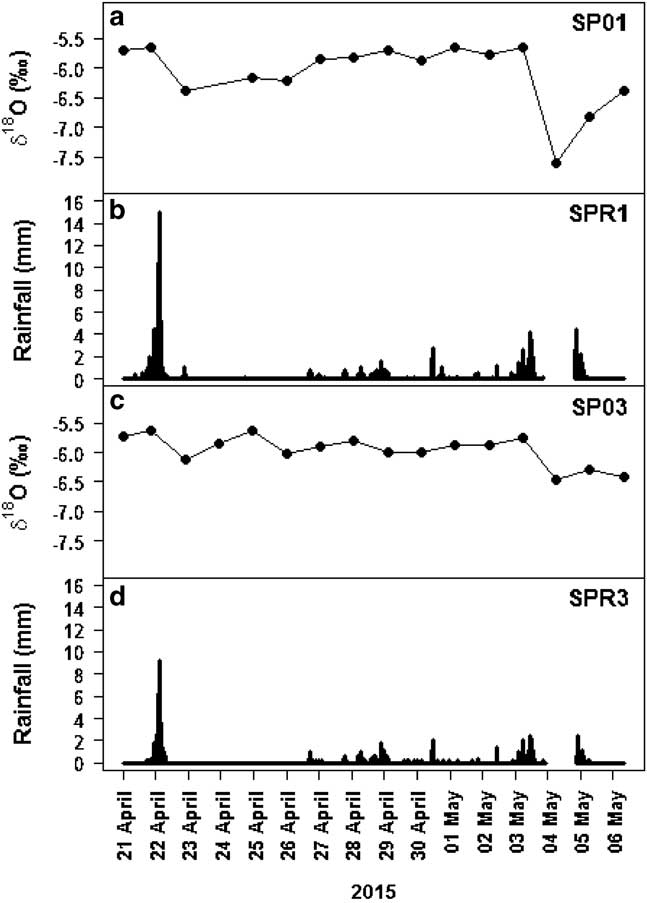
A daily time series of stream water δ18O and precipitation amount along the SPR is shown in Fig. 4a–d. All δ2H and δ18O data for daily stream water samples are shown in Table S1. Over the time series, mean δ2H was -37.1±3.2‰ (range: -48.0‰ to -33.6‰; n=31). For δ18O, the mean was -6.0±0.4‰ (range: -7.6‰ to -5.6‰; n=31). Along the stream there was no significant difference between SP01 and SP03 for δ2H (Mann–Whitney Z value=0.5, P=0.7) and δ18O (Z=-0.2, P=0.8). The ranges in stream water δ18O and δ2H were larger at the higher site (SP01; δ18O=2‰, δ2H=14.2‰) compared with the lower site (SP03; δ18O=0.8‰, δ2H=6.5‰).
Daily time series of a. δ18O at SP01, b. hourly rainfall amount at SPR1, c. δ18O at SP03 and d. hourly rainfall amount at SPR3. No rainfall data is available between 13h00 (GMT +3) 4 May 2015 and 11h00 (GMT +3) 5 May 2015.
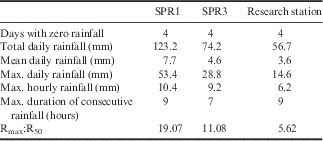
Precipitation statistics for the field campaign (21 April 2015 – 6 May 2015) are presented in Table III. Within the SPR catchment, there was strong agreement between SPR1 and SPR3 (r=0.95, P<0.00001). This relationship was weaker between the research station and SPR1 (r=0.69, P<0.00001) and SPR3 (r=0.69, P<0.00001). Along the stream there was an altitudinal precipitation gradient. On most days, higher total, mean and maximum daily rainfall was measured at SPR1 compared with SPR3 and the research station (Table III). Despite this pattern, there was no significant difference in total daily rainfall amounts between SPR1 and the lower site SPR3 (Z=0.73, P=0.47) and the research station (Z=0.59, P=0.57).
Precipitation statistics from two rain gauges along the Soft Plume River (SPR) and one at the research station, 21 April 2015 – 6 May 2015. Relative rainfall intensity (Rmax:R50) calculated as maximum daily rainfall divided by the median daily rainfall.
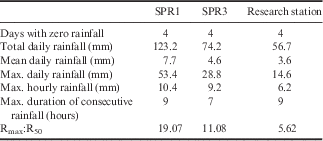
Temporal variability in stream water through the time series was small, often within the range of analytical error associated with δ18O (Fig. 4a & b). At both sites, the largest decreases in stream water δ18O occurred on 23 April 2015 and 4 May 2015. These dips coincide with higher rainfall amounts recorded at SPR1 and SPR3 (Fig. 4a–d).
On 23 April 2015, the decrease in δ18O was 0.74‰ at SP01 and 0.57‰ at SP03. This decrease followed rainfall on 22 April 2015 which amounted to 53 mm at SPR1 (04h00–22h00 GMT +3) and 28.3 mm at SPR3 (08h00–22h00 GMT +3) (Fig. 4). On 4 May 2015, the decrease in δ18O was 1.94‰ at SP03 and 1.0‰ at SP01. It was not possible to identify the total amount and duration of rainfall associated with this decrease in stream water δ18O because the data from the rainfall tipping buckets were missing (Fig. 4b & d). However, hourly precipitation data from the research station suggest that the rainfall continued over the unavailable period (13h00 (GMT +3) 4 May 2015 – 11h00 (GMT +3) 5 May 2015).
Discussion
Isotopic composition of precipitation and stream water
The δ2H and δ18O in monthly precipitation on Marion Island yield a LMWL defined as δ2H=8.4δ18O+11.4 determined using a PWRMA regression and a PWLSR-derived LMWL of δ2H=7.6δ18O+7.8. Similarly, Crawford et al. (Reference Crawford, Hughes and Lykoudis2014) observed larger slopes for PWRMA-derived LMWLs compared to those determined using the PWLSR technique on oceanic islands and at coastal sites. The slopes of 8.3 and 7.6 are close to the global meteoric water line (GMWL), which is slightly greater than eight for meteoric waters unaffected by evaporation (Craig Reference Craig1961). This similarity of slopes largely reflects the hyper-oceanic climate of Marion Island, with cool moist conditions resulting in minimal sub-cloud evaporation of precipitation (Rozanski et al. Reference Rozanski, Araguas-Araguas and Gonfiantini1993). Similar observations have been made at mid-latitude ocean exposed sites in Tasmania, Cape Grim (40°41′S, 144°19′E; Liu et al. Reference Liu, Fu, Song, Charles, Zhang, Han and Wang2010) and Margate (42°57′S, 147°19′E; Treble et al. Reference Treble, Budd, Hope and Rustomji2005).
While there was no clear seasonal isotopic variability in precipitation present in our data, the lowest δ2H (not shown) and δ18O values were observed in the winter months. This pattern is in agreement with Feng et al. (Reference Feng, Faiia and Posmentier2009), who, in their analysis of GNIP data, found lower precipitation δ18O values in winter months. The lack of a distinct seasonal isotopic signal is consistent with the island’s climatic regime (Rouault et al. Reference Rouault, Melice, Reason and Lutjeharms2005). High precipitation amounts, evenly distributed throughout the year, coupled with small seasonal and diurnal temperature ranges, result in no clear seasonal isotopic signal in precipitation (Fig. 3a; Rozanski et al. Reference Rozanski, Araguas-Araguas and Gonfiantini1993). The isotope composition of monthly precipitation δ18O correlates poorly with mean air surface temperature (r=0.39, P<0.001) and total monthly rainfall amount (r=-0.24, P<0.05) measured at the research station. These relationships are typical for islands with a strong maritime influence and low seasonal temperature oscillations (Bowen Reference Bowen2008).
Stream water δ18O (or δ2H) in a drainage basin should reflect the amount- and altitude-weighted precipitation over the catchment of the stream (Halder et al. Reference Halder, Terzer, Wassenaar, Araguás-Araguás and Aggarwal2015). Differences between precipitation and stream water δ18O values are generally observed in large catchments where altitude varies, such as areas of western USA (Kendall & Coplen Reference Kendall and Coplen2001, Dutton et al. Reference Dutton, Wilkinson, Welker, Bowen and Lohmann2005). On Marion Island, stream water from the SPR had significantly lower mean δ2H (-36.6‰) and δ18O (-5.8‰) values compared with the GNIP data (δ2H=-27.7‰, δ18O=-4.7‰) and precipitation isotope values from this study (δ2H=-27.5‰, δ18O=-4.6‰). The range of stream water isotope values (δ2H=22.6‰, δ18O=3.6‰) was smaller than GNIP data (δ2H=60.5‰, δ18O=6.8‰) but was almost identical to that of precipitation samples from this study (δ2H=29.0‰, δ18O=3.7‰). These differences are probably a result of the multiple years represented in the long-term GNIP dataset, coupled with the fact that precipitation was sampled at a different location (research station) than stream water (SPR). Some of the variation in the GNIP dataset can be explained by interannual variability of the precipitation isotope signal associated with fluctuations in the water vapour transport in the region of the westerly storm track (Noone & Simmonds Reference Noone and Simmonds2002). Furthermore, spatial variability in the isotopic composition of precipitation can result in differences even within relatively small catchments. For example, Fischer et al. (Reference Fischer, van Meerveld and Seibert2017) observed differences in weighted mean precipitation δ18O of 0.3‰ up to 2.0‰ over a distance of 250 m in the Zwäckentobel catchment, Switzerland.
Spatiotemporal variability in stream water isotopic composition and rainfall amount
Temporal variation in stream water over the daily time series was small at both sites, often within the analytical error associated with δ18O (± 0.2‰). Dunn et al. (Reference Dunn, Bacon, Soulsby, Tetzlaff, Stutter, Waldron and Malcolm2008) observed a similar pattern of spatial and temporal homogeneity in stream water δ18O in a small, nested sub-catchment in north-east Scotland. On Byers Peninsula, Livingston Island, Lyons et al. (Reference Lyons, Welch, Welch, Camacho, Rochera, Michaud, Dewit and Carey2013) found that the total variation in δ18O from a single small stream was small (1.5‰) over a 13 day time series. This is similar to the range in stream water isotope values in the SPR (2.0‰) recorded over the daily time series in this study. The most pronounced fluctuations in the SPR appear to be generated by direct inputs into the stream, as the timing and response of stream water δ18O (and δ2H) values are coincident with precipitation events (Fig. 4, Dunn et al. Reference Dunn, Bacon, Soulsby, Tetzlaff, Stutter, Waldron and Malcolm2008). Lower stream water δ18O values are observed following higher rainfall amounts recorded along the stream at SPR1 and SPR3 (Fig. 4). This relationship is present over the entire time series and consistent with observations from streams in small catchments that experience frequent and flash precipitation events (Machavaram et al. Reference Machavaram, Whittemore, Conrad and Miller2006). The quick changes in the stream water isotope composition seen in the SPR emphasizes the need for at least daily sampling to capture hydrological events.
Despite the relative lack of temporal variation in stream water isotopes, there is a clear and consistent trend in δ18O and precipitation amounts along the stream (Fig. 4). Cumulative precipitation amounts were higher and total stream water δ18O variation was larger at the higher elevation (SPR1 and SP01; 2‰) compared with the lower elevation sites (SPR3 and SP03; 0.9‰) (Table III, Fig. 4). Rainfall data were not corrected for potential systematic errors and typical wind-induced errors for the observed wind speeds can be assumed to be 2–10% (Sieck et al. Reference Sieck, Burges and Steiner2007). This is similar to the volume error associated with the tipping buckets and generally smaller than the observed differences in rainfall amounts (Sieck et al. Reference Sieck, Burges and Steiner2007, Table III). This rainfall–stream isotope relationship is further supported by consistently larger decreases in δ18O at SP01 in response to precipitation compared with SP03. The altitudinal differences in stream water isotopes and rainfall amounts are probably the result of the ‘amount’ and/or ‘elevation’ effects in precipitation. Taken together these findings offer a potential explanation for the observed differences between stream water and precipitation isotopes on Marion Island. While the time that water takes to move through the landscape can affect the isotopic composition of recharge, the mean residence time is expected to be relatively short given the catchment’s steep slopes, permeability, high infiltration rates, and flash and consistent precipitation. However, more data that cover seasonal and interannual climatic variability are needed to assess possible explanations accurately. Nevertheless, the findings highlight the need for sampling at different locations to better understand the precipitation–stream water isotope relationship.
Conclusions
Our study presents the first dataset of stream water δ2H and δ18O values for Marion Island, and extends the GNIP data previously collected on the island. Precipitation δ2H and δ18O values are consistent with previous data and yielded a LMWL defined as δ2H=8.4δ18O+11.4. There was no clear seasonality in precipitation isotopes, which reflects the island’s climatic regime. Precipitation δ2H and δ18O were consistent with the GNIP data. Stream water had significantly lower mean isotope values and a smaller range than monthly precipitation. Continuous daily sampling revealed that the ‘amount effect’ in precipitation has a strong control on spatiotemporal stream water isotope variability. Stream water isotope values decreased following high rainfall amounts. Stream water δ18O values were lower and more variable at the higher altitude site, which is attributed to more rainfall at higher elevations (i.e. ‘amount effect’). Taken together, the results illustrate spatiotemporal patterns in precipitation and stream water isotopes on sub-Antarctic Marion Island, which, in turn, advances our understanding of the island’s isotope hydrology.
Acknowledgements
The research presented here is part of the project Landscape and Climate Interactions in a Changing Sub-Antarctic Environment (grant no. 93075). This research received logistical support from the South African Department of Environmental Affairs. Funding was provided through the National Research Foundation by the South African Department of Science and Technology under the auspices of the South African National Antarctic Program. Climate data from the research station on Marion Island was provided by the SAWS. Abuyiselwe Nguna (University of Fort Hare) assisted with sample collection in the field. Sherissa Roopnarain of the Department of Geological Science at the University of Cape Town provided the precipitation and stream water isotope analysis. We thank two anonymous reviewers for their inputs which improved the quality of the manuscript.
Author contributions
MJS, DH, FE and WN conceived the project. MJS, DH and WN carried out fieldwork on Marion Island. WN was the principal investigator of the Landscape and Climate Interactions in a Changing Sub-Antarctic Environment (grant no. 93075) project. CH oversaw the isotope analyses and provided interpretation of the results. MJS processed and analysed the data and wrote the initial draft of the manuscript. All authors contributed to the writing of the manuscript, and to the discussion of data and implications of results.
Supplemental material
A supplemental table will be found at http://dx.doi.org/10.1017/S0954102017000475.