1 Introduction
The transfer of energy from large to small scales in density stratified fluids such as the oceans, lakes and the atmosphere is known to be driven in large part by internal gravity waves (Staquet & Sommeria Reference Staquet and Sommeria2002). One particularly energetic type of internal wave found in each of these systems is the internal solitary wave (ISW); see the recent reviews by Helfrich & Melville (Reference Helfrich and Melville2006) and Grimshaw et al. (Reference Grimshaw, Pelinovsky, Talipova and Kurkina2010). In the ocean these waves can be quite large, with wave amplitudes,
 $\unicode[STIX]{x1D702}_{MAX}$
, in excess of
 $240$
m in some cases (Huang et al.
Reference Huang, Chen, Zhao, Zhang, Zhou, Yang and Tian2016) and, equally notable, nonlinearity
 $\unicode[STIX]{x1D6FC}=\unicode[STIX]{x1D702}_{MAX}/h\approx 5$
, where
 $h$
is an appropriate depth scale (Stanton & Ostrovsky Reference Stanton and Ostrovsky1998). There are several mechanisms that generate oceanic ISWs with the most common being the interaction of barotropic tide with a localized topographic feature where three-dimensional affects can be important (e.g. Grue Reference Grue2015). This leads to the radiation of an internal tide that subsequently steepens through nonlinearity to produce one or more ISWs. See Jackson, Da Silva & Jeans (Reference Jackson, Da Silva and Jeans2012) for a recent review on this and other ISW generation mechanisms. Once produced, these large-amplitude ISWs can propagate for very long distances. A striking example occurs in the South China Sea where the waves emerge from the westward propagating internal tide generated in the Luzon Strait (Alford et al.
Reference Alford, Peacock, MacKinnon, Nash, Buijsman, Centuroni, Chao, Chang, Farmer and Fringer2015). The waves have amplitudes
 ${>}100$
m and travel hundreds of kilometres across the South China Sea to the continental shelf where they shoal, break and dissipate (St. Laurent et al.
Reference St. Laurent, Simmons, Tang and Wang2011). The resulting vertical turbulent mixing from wave shoaling can be significant (Sandstrom & Elliott Reference Sandstrom and Elliott1984; Shroyer, Moum & Nash Reference Shroyer, Moum and Nash2010a
).
The waves are also subject to internal instabilities as they propagate in constant depth (Moum et al.
Reference Moum, Farmer, Smyth, Armi and Vagle2003; Shroyer et al.
Reference Shroyer, Moum and Nash2010a
). Zhang & Alford (Reference Zhang and Alford2015) analysed 6 months of in situ data from the Washington continental shelf that produced records of nearly
 $600$
individual ISWs, with over
 $120$
exhibiting instabilities and turbulent dissipation. They categorized the waves based on a Froude number,
 $Fr=u_{s}/c$
, where
 $u_{s}$
is the near-surface fluid velocity and
 $c$
is the wave phase speed, and identified two types of ISWs, each associated with a different type of instability. The first wave type had
 $Fr<1$
and was characterized by a thin region of Richardson number,
 $$\begin{eqnarray}Ri=\frac{N^{2}}{(\unicode[STIX]{x2202}u/\unicode[STIX]{x2202}z)^{2}},\end{eqnarray}$$
less than
 $0.25$
, a necessary but not sufficient condition for Kelvin–Helmholtz (K–H) instability. Here
 $N$
is the local Brunt-Väisälä, or buoyancy, frequency and
 $\unicode[STIX]{x2202}u/\unicode[STIX]{x2202}z$
is the local wave-induced vertical shear. These waves were subject to an instability that produced large-amplitude K–H billows (see also Moum et al.
Reference Moum, Farmer, Smyth, Armi and Vagle2003) and dissipation localized within and downstream of the interfacial region of low
 $Ri$
. The second type of wave had
 $Fr>1$
and was associated with the formation of a trapped vortex core (cf. Davis & Acrivos Reference Davis and Acrivos1967; Helfrich & White Reference Helfrich and White2010) and was characterized by turbulent mixing within the overturning core. Note that these ISW propagation speeds used by Zhang & Alford (Reference Zhang and Alford2015) were estimated from theory. Laboratory experiments by Grue et al. (Reference Grue, Jensen, Rusås and Sveen2000) and Luzzatto-Fegiz & Helfrich (Reference Luzzatto-Fegiz and Helfrich2014) suggest that
 $Fr$
would not exceed unity for the trapped cores they measured, where both the wave speed and the fluid particle velocity were measured using particle tracking velocimetry. There is, however, observational (Lien et al.
Reference Lien, D’Asaro, Henyey, Chang, Tang and Yang2012) and numerical (Lamb Reference Lamb2003) evidence to the contrary. Additional comprehensive field observations and turbulence resolving numerical simulations should help resolve this issue. Despite this uncertainty, the interfacial K–H instability was significantly more common and is the focus of the work presented here. Despite the extensive data set, they could not find a clear relationship between the occurrence of instabilities and parameters such as wave steepness, stratification or mean flow, except that unstable waves tend to be more energetic (i.e. have larger amplitudes and phase speeds). From observations on the Scotian Shelf, Sandstrom & Elliott (Reference Sandstrom and Elliott1984) did deduce that a minimum Richardson number
 $Ri_{min}\lesssim 0.1$
was necessary for shear instabilities. Laboratory experiments (Carr et al.
Reference Carr, Fructus, Grue, Jensen and Davies2008; Fructus et al.
Reference Fructus, Carr, Grue, Jensen and Davies2009; Luzzatto-Fegiz & Helfrich Reference Luzzatto-Fegiz and Helfrich2014) and numerical simulations (Barad & Fringer Reference Barad and Fringer2010; Almgren, Camassa & Tiron Reference Almgren, Camassa and Tiron2012) have also indicated that
 $Ri_{min}\lesssim 0.1$
is required for observable K–H billows.
However, a condition for instability based solely on
 $Ri_{min}$
does not appear to be adequate. In their numerical study of ISW instabilities excited by numerical round-off error, Carr, King & Dritschel (Reference Carr, King and Dritschel2011) determined that a single parameter such as
 $Ri_{min}$
is insufficient and that a bound on stability was always a function of the details of the background and wave-induced stratification. From their laboratory experiments in nearly two-layered stratification with a thin interfacial region, Fructus et al. (Reference Fructus, Carr, Grue, Jensen and Davies2009) suggested an alternative criterion for ISWs to be unstable, namely that
 $L_{Ri}/\unicode[STIX]{x1D709}\approx 0.86$
, where
 $L_{Ri}$
is the half-length of the
 $Ri<0.25$
zone and
 $\unicode[STIX]{x1D709}$
is the half-length of the ISW (measured between the wave crest and where the interfacial displacement equals
 $\unicode[STIX]{x1D702}_{MAX}/2$
). However, as shown below,
 $Ri_{min}$
,
 $L_{Ri}$
and
 $\unicode[STIX]{x1D709}$
are functions of
 $c$
for a given background stratification, and so are not independent. This implicated the length of the potentially unstable zone, that is, the spatial or temporal extent available for growing K–H instability, as a critical consideration. Subsequent attempts to define an instability criterion based on the length or the time spent by a perturbation in the region with
 $Ri<0.25$
, using linear growth rates predicted by the Taylor–Goldstein equation from either a temporal analysis (Troy & Koseff Reference Troy and Koseff2005; Fructus et al.
Reference Fructus, Carr, Grue, Jensen and Davies2009; Barad & Fringer Reference Barad and Fringer2010; Almgren et al.
Reference Almgren, Camassa and Tiron2012) or a spatial analysis (Lamb & Farmer Reference Lamb and Farmer2011; Camassa & Viotti Reference Camassa and Viotti2012) have yielded similar results. For example, Troy & Koseff (Reference Troy and Koseff2005) found that
 $Ri_{min}\lesssim 0.1$
and
 $\bar{\unicode[STIX]{x1D714}}_{i}T_{W}>5$
. Here
 $\bar{\unicode[STIX]{x1D714}}_{i}$
is the average temporal growth rate in the
 $Ri<0.25$
region and
 $T_{W}$
(
 ${\approx}2L_{Ri}/c$
) is a measure of the time it takes a disturbance to propagate through the zone. Similarly, Lamb & Farmer (Reference Lamb and Farmer2011) found
 $Ri_{min}\lesssim 0.1$
,
 $L_{Ri}/\unicode[STIX]{x1D709}>0.8$
and
 $2\bar{k}_{i}L_{Ri}>4$
are necessary. Here
 $\bar{k}_{i}$
is the average spatial growth rate in the low
 $Ri$
region. In all these cases the criteria rest on the appearance of finite-amplitude K–H billows. Not surprisingly then, the criteria are sensitive to the properties (e.g. frequency, amplitude, etc.) of the perturbations (Lamb & Farmer Reference Lamb and Farmer2011; Almgren et al.
Reference Almgren, Camassa and Tiron2012).
These criteria were recently questioned by Camassa & Viotti (Reference Camassa and Viotti2012) where the response of large-amplitude ISWs in nearly two-layered stratifications to infinitesimal disturbances was shown to be critically connected with the variable and non-parallel structure of the
 $Ri<0.25$
region. They demonstrated that this could promote the absorption of perturbation energy into the spatially varying vertical shear field as a disturbance entered the wave and also to the clustering of local eigenvalues along the wave. Their study promotes an energetic coupling among neutral modes stronger than what may be expected to occur in parallel or slowly varying flows and gives rise to multi-modal transient dynamics of the kind often referred to as non-normality effects. Additionally, the ISW flow configuration is characteristic of globally stable but strongly non-normal system, also known as a noise amplifier (Schmid & Henningson Reference Schmid and Henningson2001; Chomaz Reference Chomaz2005), in which perturbations localized in the pycnocline grow exponentially as they travel along the ISW and leave the ISW without inducing self-sustained instabilities (Lamb & Farmer Reference Lamb and Farmer2011; Camassa & Viotti Reference Camassa and Viotti2012).
Motivated by these considerations, the transient growth of linear instabilities in ISWs is investigated by computing optimal initial disturbances that maximize the energy of the perturbation for a given time horizon (Schmid Reference Schmid2007; Luchini & Bottaro Reference Luchini and Bottaro2014) where the base flow is an ISW found by solution of the Dubreil-Jacotin–Long (DJL) equation. This approach makes no assumptions regarding the perturbation properties and does not require parallel or even a slowly varying background state. It provides an upper bound on the energy growth generated by a perturbation with an infinitesimal amplitude. The results from the optimization procedure are then compared with a local Wentzel–Kramers–Brillouin (WKB) approach to transient growth, based on the assumption of a weakly non-parallel base flow, together with initial short-time transient growth mechanisms and the growth experienced by packets of free linear internal waves.
The questions that we seek to address are: What are the necessary and sufficient conditions for a wave to be unstable? What perturbations grow, and under what conditions do K–H billows form? How does this depends on the background wave field and other perturbations? How much energy is extracted from the ISW? For parallel shear flows, the fastest growing modes are two-dimensional. Is this the case in ISWs with their curved and spatially varying shear layers? And how do these results impact the issue of dissipation, or decay, of ISWs?
The following manuscript is organized as follows. The governing equations, the DJL model, and solitary wave solutions are introduced in § 2. The transient growth optimization problem is derived and explored in § 3. This is compared to an analysis of slowly varying (WKB) linear spatial K–H instability in § 4, where the effects of non-normal growth are highlighted. The linear evolution of packets of free waves is examined in § 5. The nonlinear development of both types of disturbances and the primary ISW are considered in § 6. An application to field observations of Moum et al. (Reference Moum, Farmer, Smyth, Armi and Vagle2003) appears in § 7. Conclusions are drawn in § 8.
2 DJL solitary waves
2.1 Equations of motion
The fluid motion is governed by the incompressible Navier–Stokes system in the Boussinesq approximation, written formally, in non-dimensional form as
 $$\begin{eqnarray}\displaystyle \left.\begin{array}{@{}c@{}}\displaystyle \boldsymbol{E}\unicode[STIX]{x2202}_{t}\boldsymbol{q}=\boldsymbol{F}(\boldsymbol{q},Re,Sc),\\ \displaystyle \boldsymbol{F}(\boldsymbol{q},Re,Sc)=\left[-(\boldsymbol{u}\boldsymbol{\cdot }\unicode[STIX]{x1D735})\boldsymbol{u}-\unicode[STIX]{x1D735}p-s\boldsymbol{e}_{z}+\frac{1}{Re}\unicode[STIX]{x1D6FB}^{2}\boldsymbol{u};\unicode[STIX]{x1D735}\boldsymbol{\cdot }\boldsymbol{u};-(\boldsymbol{u}\boldsymbol{\cdot }\unicode[STIX]{x1D735})s+\frac{1}{ScRe}\unicode[STIX]{x1D6FB}^{2}s\right]\end{array}\right\} & & \displaystyle \nonumber\\ \displaystyle & & \displaystyle\end{eqnarray}$$
for the velocity
 $\boldsymbol{u}(x,z,t)$
, the density
 $s(x,z,t)$
and the pressure field
 $p(x,z,t)$
. The solution vector is
 $\boldsymbol{q}=(\boldsymbol{u},p,s)^{\text{T}}$
and
 $\boldsymbol{E}$
is the projection operator onto the velocity and density fields such that
 $\boldsymbol{E}\boldsymbol{q}=(u,v,w,0,s)^{\text{T}}$
. The variables have been scaled using the reduced gravity
 $g^{\prime }=g(\unicode[STIX]{x1D70C}_{b}-\unicode[STIX]{x1D70C}_{0})/\unicode[STIX]{x1D70C}_{0}$
, where
 $g$
is the acceleration of gravity,
 $\unicode[STIX]{x1D70C}_{b}$
and
 $\unicode[STIX]{x1D70C}_{0}$
are, respectively, the densities at the bottom and top of the domain of depth
 $H$
.
The non-dimensional quantities are given by
 $$\begin{eqnarray}(x,z)=\frac{(x^{\ast },z^{\ast })}{H},\quad t=t^{\ast }\sqrt{\frac{H}{g^{\prime }}},\quad (\boldsymbol{u},c)=\frac{(\boldsymbol{u}^{\ast },c^{\ast })}{\sqrt{g^{\prime }H}},\quad \text{and}\quad s=\frac{\unicode[STIX]{x1D70C}^{\ast }-\unicode[STIX]{x1D70C}_{0}}{\unicode[STIX]{x0394}\unicode[STIX]{x1D70C}},\end{eqnarray}$$
where the
 $\ast$
denotes a dimensional quantity. Note that
 $\unicode[STIX]{x1D70C}^{\ast }$
is the density and
 $s$
is a scaled departure from
 $\unicode[STIX]{x1D70C}_{0}$
. The Reynolds number
 $Re=\sqrt{g^{\prime }H^{3}}/\unicode[STIX]{x1D708}$
and
 $Sc=\unicode[STIX]{x1D708}/\unicode[STIX]{x1D705}$
is the Schmidt number. Here
 $\unicode[STIX]{x1D708}$
is the kinematic viscosity of the fluid and
 $\unicode[STIX]{x1D705}$
is the diffusivity of the stratifying agent.
The two-dimensional flow domain is
 $-L\leqslant x\leqslant L$
,
 $0\leqslant z\leqslant 1$
. Adiabatic and free-slip conditions,
 $\left[\unicode[STIX]{x2202}u/\unicode[STIX]{x2202}z,w,\unicode[STIX]{x2202}s/\unicode[STIX]{x2202}z\right]=0$
, are imposed on
 $z=0$
and
 $1$
and the lateral boundary condition at
 $x=\pm L$
are taken as a specified upstream inflow and, for the numerical solutions, a downstream outflow with an advective-type condition
 $$\begin{eqnarray}\frac{\unicode[STIX]{x2202}\boldsymbol{u}}{\unicode[STIX]{x2202}t}=\hat{u} \frac{\unicode[STIX]{x2202}\boldsymbol{u}}{\unicode[STIX]{x2202}x},\quad \frac{\unicode[STIX]{x2202}s}{\unicode[STIX]{x2202}t}=\hat{u} \frac{\unicode[STIX]{x2202}s}{\unicode[STIX]{x2202}x},\end{eqnarray}$$
is employed. Here
 $\hat{u}$
is the fluid velocity just upstream of the outflow boundary.
2.2 DJL theory for internal solitary waves
The finite-amplitude internal solitary waves that form the base state for the stability analysis are obtained from the Dubreil-Jacotin–Long (DJL) equation (Dubriel-Jacotin Reference Dubriel-Jacotin1934; Long Reference Long1953). It is an exact reduction of the steady, two-dimensional Euler equations (equation (2.1) with
 $\unicode[STIX]{x1D708}=\unicode[STIX]{x1D705}=0$
). For a Boussinesq fluid of depth
 $H$
, the DJL equation is, in dimensional variables, (cf. Stastna & Lamb Reference Stastna and Lamb2002)
 $$\begin{eqnarray}\unicode[STIX]{x1D6FB}^{2}\unicode[STIX]{x1D702}+\frac{\bar{N}^{2}(z-\unicode[STIX]{x1D702})}{c^{2}}\unicode[STIX]{x1D702}=0,\end{eqnarray}$$
with boundary conditions
 $$\begin{eqnarray}\unicode[STIX]{x1D702}(x,0)=\unicode[STIX]{x1D702}(x,H)=0,\quad \unicode[STIX]{x1D702}(\pm \infty ,z)\rightarrow 0.\end{eqnarray}$$
Here
 $c$
is the wave phase speed,
 $\unicode[STIX]{x1D702}(x,z)$
is the displacement of an isopycnal from its upstream resting position. The buoyancy frequency
 $\bar{N}$
of the resting density profile
 $\bar{\unicode[STIX]{x1D70C}}(z)$
is given by
 $$\begin{eqnarray}\bar{N}^{2}(z)=-\frac{g}{\unicode[STIX]{x1D70C}_{0}}\frac{\text{d}\bar{\unicode[STIX]{x1D70C}}}{\text{d}z},\quad \bar{\unicode[STIX]{x1D70C}}(z)=\unicode[STIX]{x1D70C}_{0}+\unicode[STIX]{x0394}\unicode[STIX]{x1D70C}\bar{S}(z).\end{eqnarray}$$
The scaled background density profile
 $\bar{S}(z)=[0,1]$
. In the non-dimensionalization of (2.2) with
 $\unicode[STIX]{x1D702}$
scaled by
 $H$
, equations (2.4) and (2.5) are unchanged except that
 $\bar{N}^{2}=-\text{d}\bar{S}/\text{d}z$
. In the frame moving with the wave the streamfunction
 $\unicode[STIX]{x1D6F9}=c(\unicode[STIX]{x1D702}-z)$
, the velocities
 $(U,W)=(\unicode[STIX]{x1D6F9}_{z},-\unicode[STIX]{x1D6F9}_{x})$
, and the density field is
 $S(x,z)=\bar{S}(z-\unicode[STIX]{x1D702}(x,z))$
. Upper case symbols are used for the ISW fields to distinguish them from the perturbation variables introduced in the next section.
Given
 $\bar{S}(z)$
, a family DJL solutions that branch from the linear long wave with phase speed
 $c_{0}$
are obtained for increasing values of
 $c$
 $({>}c_{0})$
using Newton–Raphson iterations, where
 $c$
is added as a parameter in a pseudo-arclength continuation method (Luzzatto-Fegiz & Helfrich Reference Luzzatto-Fegiz and Helfrich2014). Standard second-order finite differences are used for the Laplacian operator. Iterations are continued until the
 $L_{2}$
norm of the corrections is less than
 $10^{-10}$
. Since solitary waves (see below) are symmetric about the wave crest, we take
 $\unicode[STIX]{x2202}\unicode[STIX]{x1D702}/\unicode[STIX]{x2202}x=0$
at
 $x=0$
and reduce the domain to
 $0<x<L$
and take
 $\unicode[STIX]{x1D702}(L,z)=0$
.
 $L\geqslant 6$
is made large enough that the ISW solutions are not affected by the finite size. The calculation is started from a weakly nonlinear solitary wave solution to the Korteweg–de Vries (KdV) equation (Helfrich & Melville Reference Helfrich and Melville2006). Typically
 $250$
cells in
 $z$
and
 $500$
in
 $x$
are used. However, when a particular wave is needed for a calculation, the solution is interpolated onto the desired fine grid and adjusted to convergence by additional Newton–Raphson iterations.
2.3 DJL solitary waves
A two-layer stratification is given by
 $$\begin{eqnarray}\bar{S}(z)={\textstyle \frac{1}{2}}(1-\tanh [\unicode[STIX]{x1D706}(z-z_{0})]),\end{eqnarray}$$
where
 $z_{0}$
is the location of the interface with thickness scale
 $\unicode[STIX]{x1D706}^{-1}$
. In what follows
 $z_{0}=0.85$
and
 $\unicode[STIX]{x1D706}=80$
are used to produce a thin pycnocline close to the upper boundary. Note that because the interface is in the upper half of the domain, the solitary waves are waves of depression with negative wave amplitudes. However, the amplitude
 $\unicode[STIX]{x1D702}_{MAX}=|\text{min}[\unicode[STIX]{x1D702}(0,z)]|$
is defined as the magnitude for convenience. This definition is close to, but not precisely, the maximum displacement of the
 $S=0.5$
isopycnal.
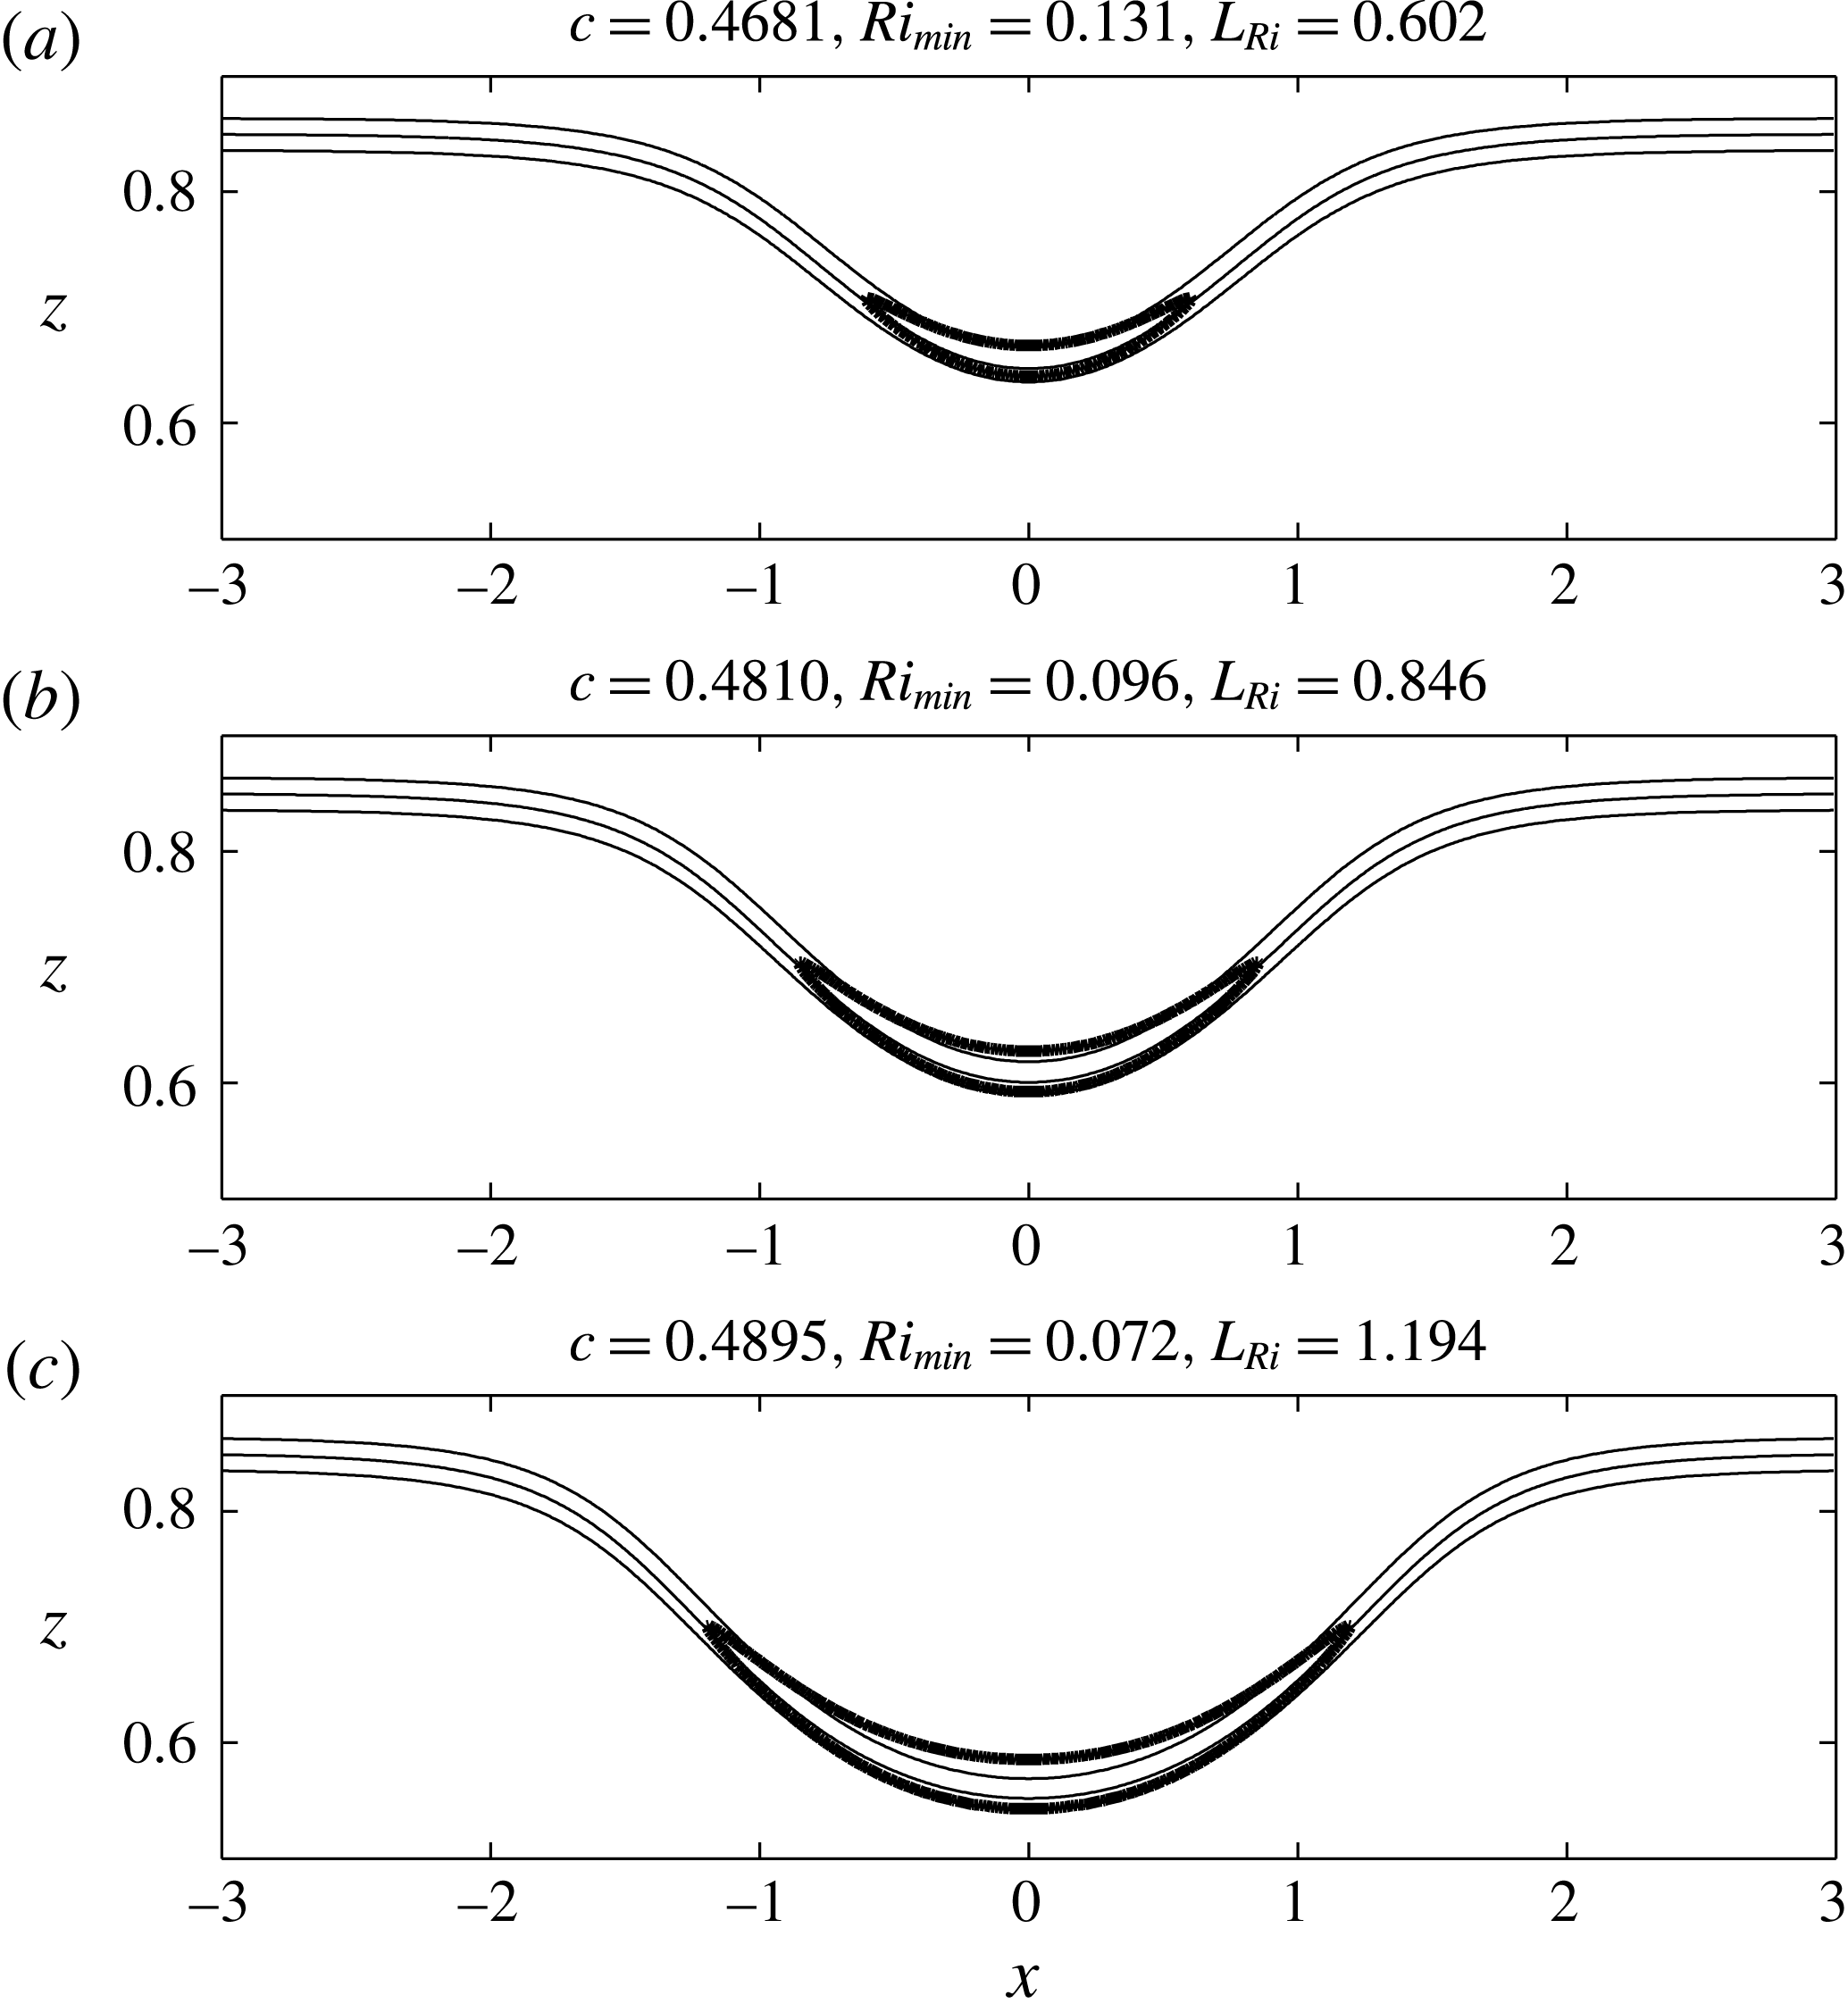
Three DJL internal solitary waves for the density profile (2.7) with
 $z_{0}=0.85$
and
 $\unicode[STIX]{x1D706}=80$
. Values for
 $c$
,
 $Ri_{min}$
and
 $L_{Ri}$
are indicated. The thin lines are the
 $S=[0.1,0.5,0.9]$
isolines and the heavy line shows the
 $Ri=0.25$
contour. Only a portion of the full domain is shown.

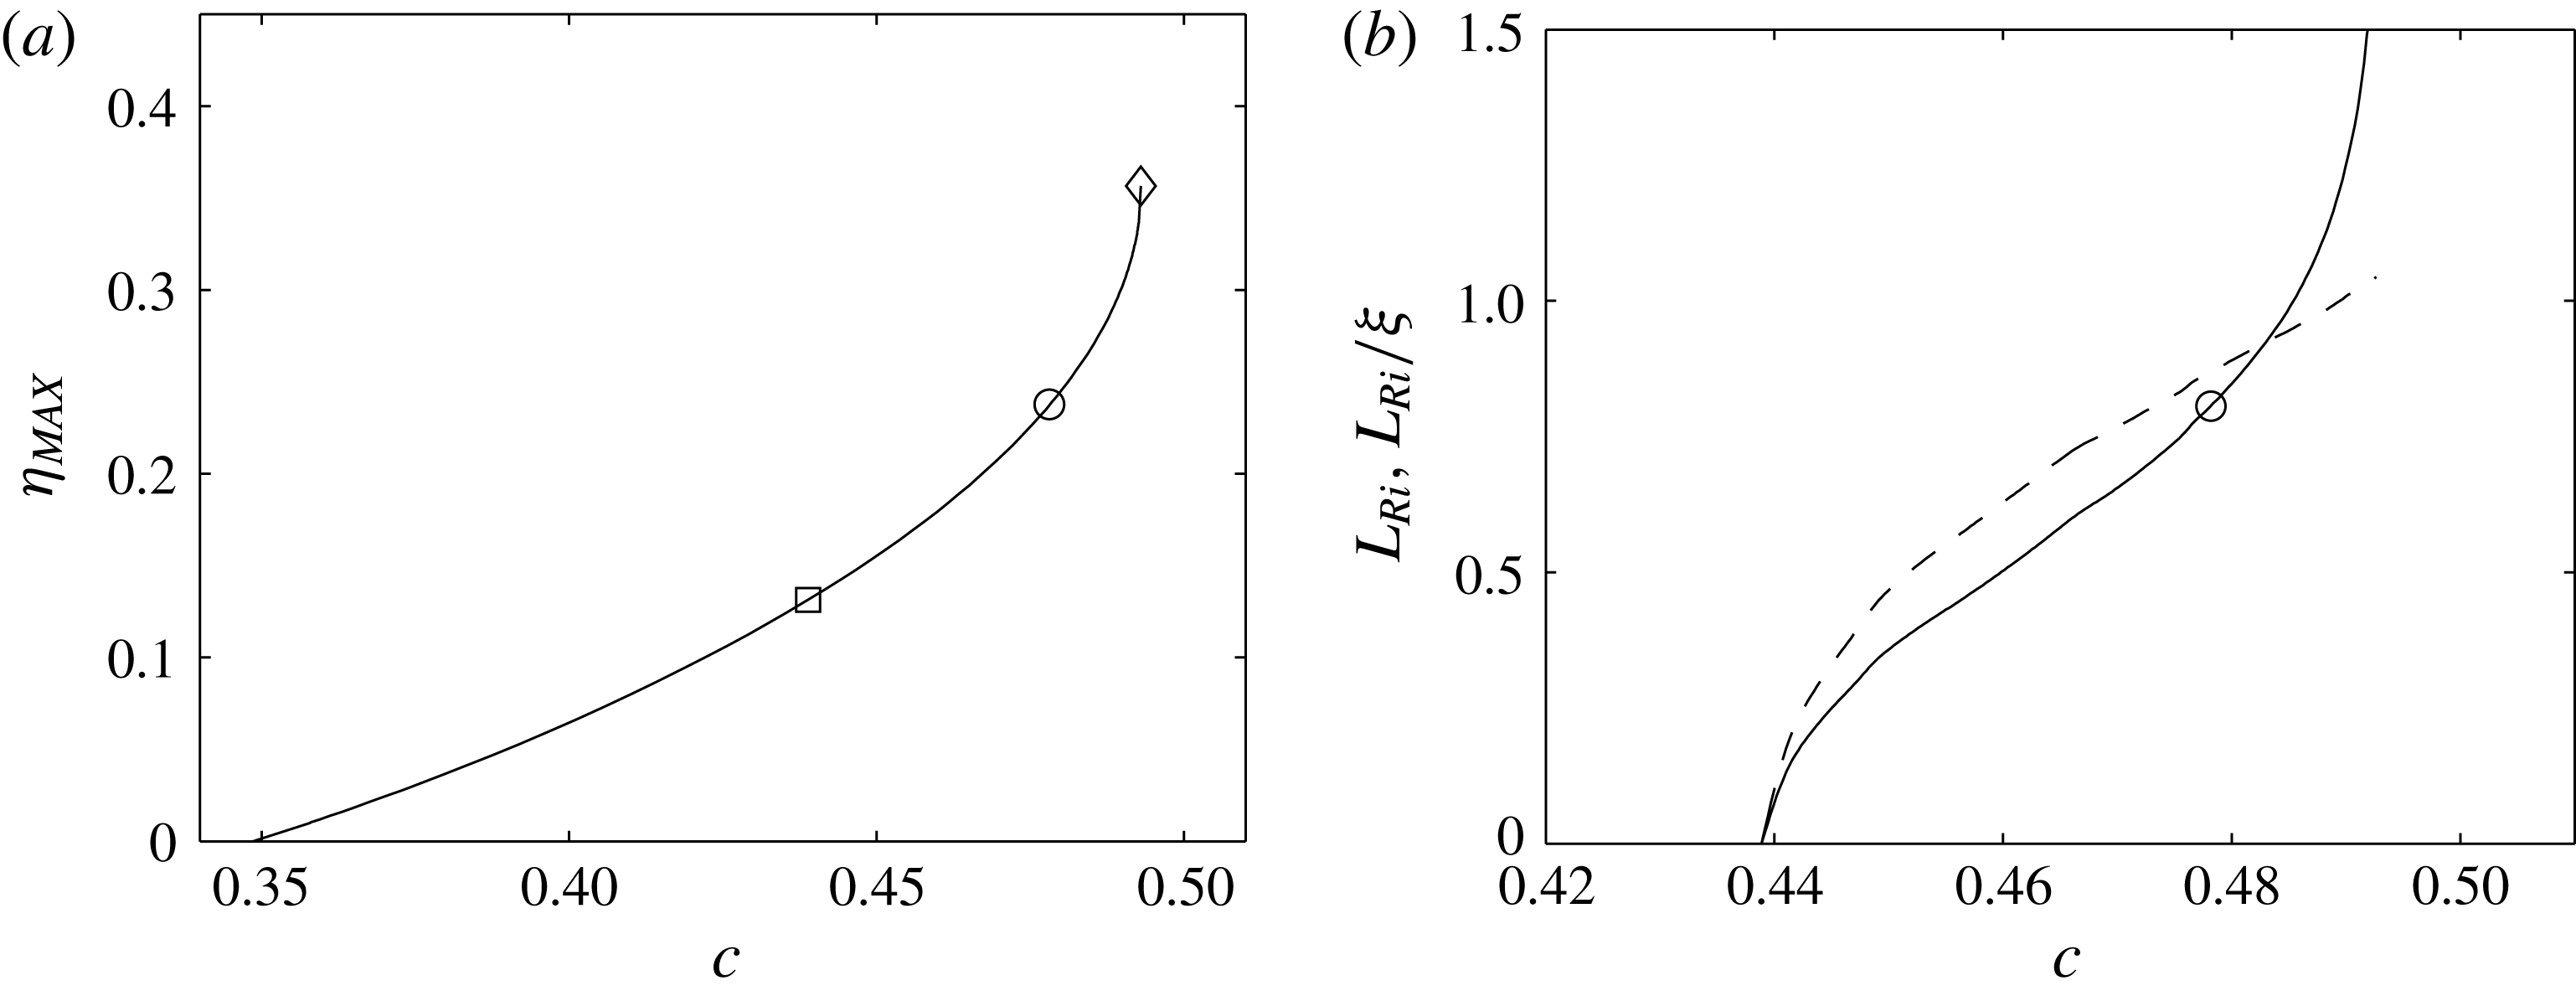
(a)
 $\unicode[STIX]{x1D702}_{MAX}$
and (b)
 $L_{Ri}$
(solid) and
 $L_{Ri}/\unicode[STIX]{x1D709}$
(dashed) versus
 $c$
for the DJL solitary wave solutions with
 $z_{0}=0.85$
and
 $\unicode[STIX]{x1D706}=80$
. The square (circle) indicates
 $Ri_{min}=0.25$
(
 $0.1$
), and the diamond indicates the maximum conjugate state wave.

Three example DJL solutions are shown in figure 1 for increasing
 $c$
. The figures show the isopycnals
 $S(x,z)=[0.1,0.5,0.9]$
and the boundary of the
 $Ri<0.25$
region. Each of these waves has
 $Ri_{min}<0.25$
, which always occurs at the wave crest, and decreases as
 $c$
increases. The half-length of this region,
 $L_{Ri}$
, amplitude
 $\unicode[STIX]{x1D702}_{MAX}$
, and the wave width,
 $\unicode[STIX]{x1D709}$
, all increase with
 $c$
(the latter only for this range of
 $c$
).
The relationship between
 $c$
and
 $\unicode[STIX]{x1D702}_{MAX}$
for the full family of ISWs for this stratification is shown in figure 2(a). The solutions branch from infinitesimal linear long waves at
 $c_{0}=0.3485$
and end at the conjugate state wave (cf. Lamb & Wan Reference Lamb and Wan1998) with
 $c_{cs}=0.4930$
and
 $\unicode[STIX]{x1D702}_{MAX}=0.3565$
. The flat-crested, infinitely broad conjugate state is found from a one-dimensional version of the DJL model following Lamb & Wan (Reference Lamb and Wan1998). Figure 2(b) shows the behaviour of
 $L_{Ri}$
and
 $L_{Ri}/\unicode[STIX]{x1D709}$
with
 $c$
. Waves with
 $Ri_{min}<0.25$
are found for
 $c>0.4389$
and
 $Ri_{min}=0.1$
at
 $c=0.4792$
where
 $L_{Ri}=0.807$
and
 $L_{Ri}/\unicode[STIX]{x1D709}=0.928$
.
In the following, we consider the dynamics of infinitesimal perturbations, governed by (2.1), to ISWs from the family of DJL solutions shown in figures 1 and 2. These waves are representative of internal solitary waves on similar thin-interface background stratifications. The aim here is to compare the most amplified transient dynamics of two-dimensional wave packets and compare their evolution with the amplification provided by a local asymptotic expansion in terms of unstable normal modes where a separation of scales between the DJL wave and the wave packet is assumed following Camassa & Viotti (Reference Camassa and Viotti2012).
2.4 Viscous adjusted steady states
The question naturally arises whether viscosity modifies the DJL waves sufficiently, at least for laboratory scales, such that the transient growth results are significantly affected. However, viscosity does not allow for an equation of the form of (2.4) and viscous DJL waves will be unsteady, although the temporal changes will be slow for large
 $Re$
. See, for example, Grimshaw, Pelinovsky & Talipova (Reference Grimshaw, Pelinovsky and Talipova2003) for an adiabatic approximation for decaying KdV solitary waves. Quasi-steady, viscously adjusted DJL waves can be found using the selective frequency damping (SFD) method (Åkervik et al.
Reference Åkervik, Brandt, Henningson, Hœpffner, Marxen and Schlatter2006) where the Navier–Stokes equations (2.1) are coupled to a low-pass temporal filtered solution
 $\bar{\boldsymbol{q}}$
(a sliding average of the state solution
 $\boldsymbol{q}$
) of the form
 $$\begin{eqnarray}\left.\begin{array}{@{}c@{}}\displaystyle \unicode[STIX]{x2202}_{t}\boldsymbol{q}=\boldsymbol{F}(\boldsymbol{q},Re)-\unicode[STIX]{x1D701}(\boldsymbol{q}-\bar{\boldsymbol{q}})\\ \displaystyle \unicode[STIX]{x2202}_{t}\bar{\boldsymbol{q}}=(\boldsymbol{q}-\bar{\boldsymbol{q}})/\unicode[STIX]{x1D712},\end{array}\right\}\end{eqnarray}$$
where
 $\unicode[STIX]{x1D712}^{-1}$
is the width of the temporal filter, and
 $\unicode[STIX]{x1D701}$
is the amplitude of the damping applied to the Navier–Stokes equations. When initialized with a DJL wave, this approach rapidly relaxes the inviscid wave to a viscously adjusted wave as (2.8) is integrated in time. The optimal cutoff frequency
 $\unicode[STIX]{x1D712}=12.7423$
and damping factor
 $\unicode[STIX]{x1D701}=0.0534$
at
 $Re=10^{5}$
were computed using the approach of Cunha, Passaggia & Lazareff (Reference Cunha, Passaggia and Lazareff2015).
3 The transient growth optimization problem
3.1 Direct and adjoint problem formulation
The solution is now decomposed between a base flow, the solitary wave and a perturbation such that
 $$\begin{eqnarray}\boldsymbol{q}(\boldsymbol{x},t)=\boldsymbol{Q}(\boldsymbol{x})+\boldsymbol{q}^{\prime }(\boldsymbol{x},t),\end{eqnarray}$$
where
 $\boldsymbol{Q}=(\boldsymbol{U},P,S)^{\text{T}}$
is the DJL solution or viscous adjusted DJL wave and
 $\boldsymbol{q}^{\prime }=(\boldsymbol{u}^{\prime },p^{\prime },s^{\prime })^{\text{T}}$
contains the perturbation velocity field
 $\boldsymbol{u}^{\prime }$
, the perturbation pressure
 $p^{\prime }$
and the density
 $s^{\prime }$
.
The evolution of infinitesimal-amplitude perturbations are governed by the linearized Navier–Stokes system, where the second-order nonlinear terms (
 $\boldsymbol{u}^{\prime }\boldsymbol{\cdot }\unicode[STIX]{x1D735}\boldsymbol{u}^{\prime },\boldsymbol{u}^{\prime }\boldsymbol{\cdot }\unicode[STIX]{x1D735}s^{\prime }$
) are negligible,
 $$\begin{eqnarray}\displaystyle & & \displaystyle \boldsymbol{f}(\boldsymbol{Q},\boldsymbol{q}^{\prime },Re,Sc)\equiv \left[\unicode[STIX]{x2202}_{t}\boldsymbol{u}^{\prime }+\unicode[STIX]{x1D6F7}(x)((\boldsymbol{U}\boldsymbol{\cdot }\unicode[STIX]{x1D735})\boldsymbol{u}^{\prime }+(\unicode[STIX]{x1D735}\boldsymbol{U})\boldsymbol{u}^{\prime })+\unicode[STIX]{x1D735}p^{\prime }+s^{\prime }\boldsymbol{e}_{z}-\frac{1}{Re}\unicode[STIX]{x1D6FB}^{2}\boldsymbol{u}^{\prime },\unicode[STIX]{x1D735}\boldsymbol{\cdot }\boldsymbol{u}^{\prime },\right.\nonumber\\ \displaystyle & & \displaystyle \qquad \left.\unicode[STIX]{x2202}_{t}s^{\prime }+\unicode[STIX]{x1D6F7}(x)((\boldsymbol{U}\boldsymbol{\cdot }\unicode[STIX]{x1D735})s^{\prime }+(\unicode[STIX]{x1D735}S)\boldsymbol{u}^{\prime })-\frac{1}{ScRe}\unicode[STIX]{x1D6FB}^{2}s^{\prime }\right]=0.\end{eqnarray}$$
The sponge layer,
 $$\begin{eqnarray}\unicode[STIX]{x1D6F7}(x)={\textstyle \frac{1}{2}}[1+\tanh (10\times (x\pm x_{0}))],\end{eqnarray}$$
is added to the advection and production terms and is closest to zero near the inlet and the outlet. It allows the direct solutions to vanish as they approach the lateral boundaries of the domain far from the shear-induced regions of the ISW and without reflection. The length of the sponge layer,
 $x_{0}=0.73L$
, was chosen such that the maximum distance a perturbation can travel is at least twice as long as the unstable region (
 $Ri<1/4$
) of the larger-amplitude DJL wave.
In the following optimization problem, we seek to maximize an objective function
 $G(\boldsymbol{q}^{\prime }(\boldsymbol{x},T))$
which is a measure of the energy of the perturbation
 $\boldsymbol{q}^{\prime }$
at a finite time
 $T$
, normalized by the initial energy
 $E_{0}$
at time
 $t=0$
and is given by
 $$\begin{eqnarray}G(\boldsymbol{q}^{\prime }(T))=\frac{E(T)}{E_{0}}=\left[\frac{1}{2}\int _{\unicode[STIX]{x1D6FA}}\left.\left(\boldsymbol{u}^{\prime }(T)\boldsymbol{\cdot }\boldsymbol{u}^{\prime }(T)+\frac{(s^{\prime }(T))^{2}}{N_{\ast }^{2}}\right)\,\text{d}\hspace{1.0pt}\boldsymbol{x}\right]\right/E_{0},\end{eqnarray}$$
where
 $\unicode[STIX]{x1D6FA}$
denotes the computational domain. In the present linear analysis
 $E_{0}=1$
. Here
 $N_{\ast }^{2}$
is the maximum Brunt-Väisälä frequency of the base flow
 $S$
, chosen to avoid division by zero in regions where
 $N^{2}(\boldsymbol{x})$
approaches zero.
This optimization problem is constrained by the linearized Navier–Stokes equations (3.2), which can be solved by introducing Lagrange multipliers
 $\boldsymbol{q}^{+}$
for the solution vector,
 $\boldsymbol{q}_{0}^{+}$
for the initial condition and
 $E_{0}^{+}$
for the initial energy. (See Joslin et al. (Reference Joslin, Gunzburger, Nicolaides, Erlebacher and Hussaini1997) for a step by step derivation in the non-stratified case and Passaggia & Ehrenstein (Reference Passaggia and Ehrenstein2013) for guidelines on the present notations.) Hence the Lagrangian is given by
 $$\begin{eqnarray}\displaystyle {\mathcal{L}}(\boldsymbol{q}^{\prime },\boldsymbol{q}^{+}) & = & \displaystyle G-\langle \langle \,\boldsymbol{f}(\boldsymbol{U},S,\boldsymbol{q}^{\prime },Re\,Sc),\boldsymbol{q}^{+}\rangle \rangle -\langle \boldsymbol{g}(\boldsymbol{u}^{\prime },s^{\prime },\boldsymbol{u}_{0}^{\prime },s_{0}^{\prime }),(\boldsymbol{u}_{0}^{+},s_{0}^{+})\rangle \nonumber\\ \displaystyle & & \displaystyle -\,h(\boldsymbol{u}_{0}^{\prime },s_{0}^{\prime },E_{0})E_{0}^{+},\end{eqnarray}$$
and is to be rendered stationary. The scalar product
 $\langle \boldsymbol{a}\boldsymbol{\cdot }\boldsymbol{b}\rangle$
is defined by the spatial integral
 $\int _{\unicode[STIX]{x1D6FA}}\boldsymbol{a}\boldsymbol{\cdot }\boldsymbol{b}\,\text{d}\boldsymbol{x}$
whereas
 $\langle \langle \boldsymbol{a}\boldsymbol{\cdot }\boldsymbol{b}\rangle \rangle$
is defined by the double integral
 $\int _{0}^{T}\int _{\unicode[STIX]{x1D6FA}}\boldsymbol{a}\boldsymbol{\cdot }\boldsymbol{b}\,\text{d}\boldsymbol{x}\,\text{d}t$
where the optimization window is taken in the time interval
 $[0,T]$
. The constraints for the initial state
 $\boldsymbol{g}(\boldsymbol{u}^{\prime },s^{\prime },\boldsymbol{u}_{0}^{\prime },s_{0}^{\prime })$
and the initial amplitude
 $h(\boldsymbol{u}_{0}^{\prime },s_{0}^{\prime },E_{0})$
associated with
 $\boldsymbol{u}_{0}^{\prime }$
and
 $E_{0}$
respectively are
 $$\begin{eqnarray}\displaystyle \left.\begin{array}{@{}c@{}}\displaystyle \boldsymbol{g}(\boldsymbol{u}^{\prime },s^{\prime },\boldsymbol{u}_{0}^{\prime },s_{0}^{\prime })=(\boldsymbol{u}_{0}^{\prime }-\boldsymbol{u}^{\prime }(0),s_{0}^{\prime }-s^{\prime }(0))=0,\\ \displaystyle h(\boldsymbol{u}_{0}^{\prime },s_{0}^{\prime },E_{0})=\frac{1}{2}\int _{\unicode[STIX]{x1D6FA}}\boldsymbol{u}_{0}^{\prime }\boldsymbol{\cdot }\boldsymbol{u}_{0}^{\prime }+s_{0}^{^{\prime }2}/N_{\ast }^{2}\,\text{d}\hspace{1.0pt}\boldsymbol{x}-E_{0}=0.\end{array}\right\} & & \displaystyle\end{eqnarray}$$
Taking variations of the Lagrangian (3.5) with respect to the state variable
 $\boldsymbol{q}$
and setting the result equal to zero, the adjoint system is equivalent to the one derived by Kaminski, Caulfield & Taylor (Reference Kaminski, Caulfield and Taylor2014) and is
 $$\begin{eqnarray}\displaystyle \boldsymbol{f}^{+}(\boldsymbol{Q},\boldsymbol{q}^{+},Re,Sc) & \equiv & \displaystyle \left[-\unicode[STIX]{x2202}_{t}\boldsymbol{u}^{+}-\unicode[STIX]{x1D6F7}(x)((\boldsymbol{U}\boldsymbol{\cdot }\unicode[STIX]{x1D735})\boldsymbol{u}^{+}+(\unicode[STIX]{x1D735}\boldsymbol{U})^{\text{T}}\boldsymbol{u}^{+}+(\unicode[STIX]{x1D735}S)s^{+})\right.\nonumber\\ \displaystyle & & \displaystyle +\,\unicode[STIX]{x1D735}p^{+}-\frac{1}{Re}\unicode[STIX]{x1D6FB}^{2}\boldsymbol{u}^{+},-\unicode[STIX]{x1D735}\boldsymbol{\cdot }\boldsymbol{u}^{+},\nonumber\\ \displaystyle & & \displaystyle \left.-\,\unicode[STIX]{x2202}_{t}s^{+}-\unicode[STIX]{x1D6F7}(x)((\boldsymbol{U}\boldsymbol{\cdot }\unicode[STIX]{x1D735})s^{+}-w^{+})-\frac{1}{ScRe}\unicode[STIX]{x1D6FB}^{2}s^{+}\right]=0.\end{eqnarray}$$
The boundary conditions of the direct–adjoint equations are determined by the boundary terms
 $B$
remaining from the integrations by parts leading to (3.7) and are
 $$\begin{eqnarray}\displaystyle B & = & \displaystyle \int _{0}^{T}\int _{\unicode[STIX]{x2202}\unicode[STIX]{x1D6FA}}\left[\frac{1}{Re}(\unicode[STIX]{x1D735}\boldsymbol{u}^{\prime }\boldsymbol{\cdot }\boldsymbol{n})\boldsymbol{u}^{+}-\frac{1}{Re}(\unicode[STIX]{x1D735}\boldsymbol{u}^{+}\boldsymbol{\cdot }\boldsymbol{n})\boldsymbol{u}^{\prime }-\unicode[STIX]{x1D6F7}(x)(\boldsymbol{U}\boldsymbol{\cdot }\boldsymbol{n})\boldsymbol{u}^{+}\boldsymbol{\cdot }\boldsymbol{u}^{\prime }+(p^{+}\boldsymbol{n})\boldsymbol{\cdot }\boldsymbol{u}^{\prime }\right.\nonumber\\ \displaystyle & & \displaystyle \left.-\,\boldsymbol{u}^{+}\boldsymbol{\cdot }(\hspace{0.5pt}p^{\prime }\boldsymbol{n})+\frac{1}{ReSc}s^{+}(\unicode[STIX]{x1D735}s^{\prime }\boldsymbol{\cdot }\boldsymbol{n})-\frac{1}{ReSc}(\unicode[STIX]{x1D735}s^{+}\boldsymbol{\cdot }\boldsymbol{n})s^{\prime }-\unicode[STIX]{x1D6F7}(x)(\boldsymbol{U}\boldsymbol{\cdot }\boldsymbol{n})s^{+}\boldsymbol{\cdot }s^{\prime }\right]\,\text{d}A\,\text{d}t\nonumber\\ \displaystyle & & \displaystyle +\,\int _{\unicode[STIX]{x1D6FA}}[\boldsymbol{u}^{+}\boldsymbol{\cdot }\boldsymbol{u}^{\prime }]_{0}^{T}+[s^{+}\boldsymbol{\cdot }s^{\prime }]_{0}^{T}\,\text{d}\unicode[STIX]{x1D6FA}\,\text{d}\hspace{1.0pt}\boldsymbol{x},\end{eqnarray}$$
where
 $A$
denotes the boundary part of the computational domain
 $\unicode[STIX]{x1D6FA}$
. These boundary terms have to be cancelled in order to insure compatibility between the direct system and its adjoint (Luchini & Bottaro Reference Luchini and Bottaro2014). Choosing the boundary conditions for the perturbation such that
 $$\begin{eqnarray}\boldsymbol{u}^{\prime }\boldsymbol{\cdot }\boldsymbol{n}|_{x=\pm L}=0,\quad s^{\prime }|_{x=\pm L}=0,\quad \left.\frac{\unicode[STIX]{x2202}\boldsymbol{u}^{\prime }}{\unicode[STIX]{x2202}\boldsymbol{n}}\right|_{z=0,1}=0,\quad \left.\frac{\unicode[STIX]{x2202}s^{\prime }}{\unicode[STIX]{x2202}\boldsymbol{n}}\right|_{z=0,1}=0,\end{eqnarray}$$
leads to the condition
 $B=0$
with
 $B$
defined in (3.8) provided that the adjoint boundary conditions
 $$\begin{eqnarray}\boldsymbol{u}^{+}\boldsymbol{\cdot }\boldsymbol{n}|_{x=\pm L}=0,\quad s^{+}|_{x=\pm L}=0,\quad \left.\frac{\unicode[STIX]{x2202}\boldsymbol{u}^{+}}{\unicode[STIX]{x2202}\boldsymbol{n}}\right|_{z=0,1}=0,\quad \left.\frac{\unicode[STIX]{x2202}s^{+}}{\unicode[STIX]{x2202}\boldsymbol{n}}\right|_{z=0,1}=0,\end{eqnarray}$$
are imposed. The direct flow field
 $(\boldsymbol{u}^{\prime },s^{\prime })$
is obtained through time marching from
 $0$
to
 $T$
and it enters the adjoint system at time
 $T$
with
 $$\begin{eqnarray}\boldsymbol{u}^{+}(T)=\boldsymbol{u}^{\prime }(T)\quad \text{and}\quad s^{+}(T)=N_{\ast }^{2}s^{\prime }(T),\end{eqnarray}$$
which is to be solved backward in time from
 $T$
to
 $0$
in a direct–adjoint-loop (DAL) procedure (Schmid Reference Schmid2007).
Taking variations of the Lagrangian (3.5) with respect to the initial solution
 $\boldsymbol{q}_{0}$
and using the last integral in (3.8), the expression for the gradient of the objective function is
 $$\begin{eqnarray}\unicode[STIX]{x1D735}_{\boldsymbol{q}_{0}}G(\boldsymbol{q}_{0})=(\boldsymbol{u}^{+}(0)-E_{0}^{+}\boldsymbol{u}_{0},0,s^{+}(0)/N_{\ast }^{2}-E_{0}^{+}s_{0}/N_{\ast }^{2}),\end{eqnarray}$$
with
 $$\begin{eqnarray}E_{0}^{+}=\sqrt{\int _{\unicode[STIX]{x1D6FA}}\boldsymbol{u}^{+}(0)\boldsymbol{\cdot }\boldsymbol{u}^{+}(0)+(s^{+}(0))^{2}/N_{\ast }^{2},\text{d}\hspace{1.0pt}\boldsymbol{x}},\end{eqnarray}$$
where the expression for
 $E_{0}^{+}$
is found assuming
 $\unicode[STIX]{x1D735}_{\boldsymbol{q}_{0}}G=0$
.
3.2 Numerical methods
Two different numerical methods were used to compute the optimal perturbations. In the case of the viscous adjusted ISWs, both the base flow, through (2.8), and the optimal perturbation were computed using the same grid which is a mixed spectral/finite differences-type discretization. The streamwise direction (
 $x$
) with
 $L=3$
is discretized using finite differences with
 $2001$
discretization points, the vertical direction (
 $z$
) uses 200 Chebyshev polynomials and the pressure is solved using a pressure projection method. The temporal integration is semi-implicit and is performed using a second-order backward Euler-type scheme for the diffusion part whereas an explicit second-order Adams–Bashforth scheme is used for the advection terms. Further details about the numerical discretization procedure can be found in Marquillie & Ehrenstein (Reference Marquillie and Ehrenstein2002) and Marquillie & Ehrenstein (Reference Marquillie and Ehrenstein2003).
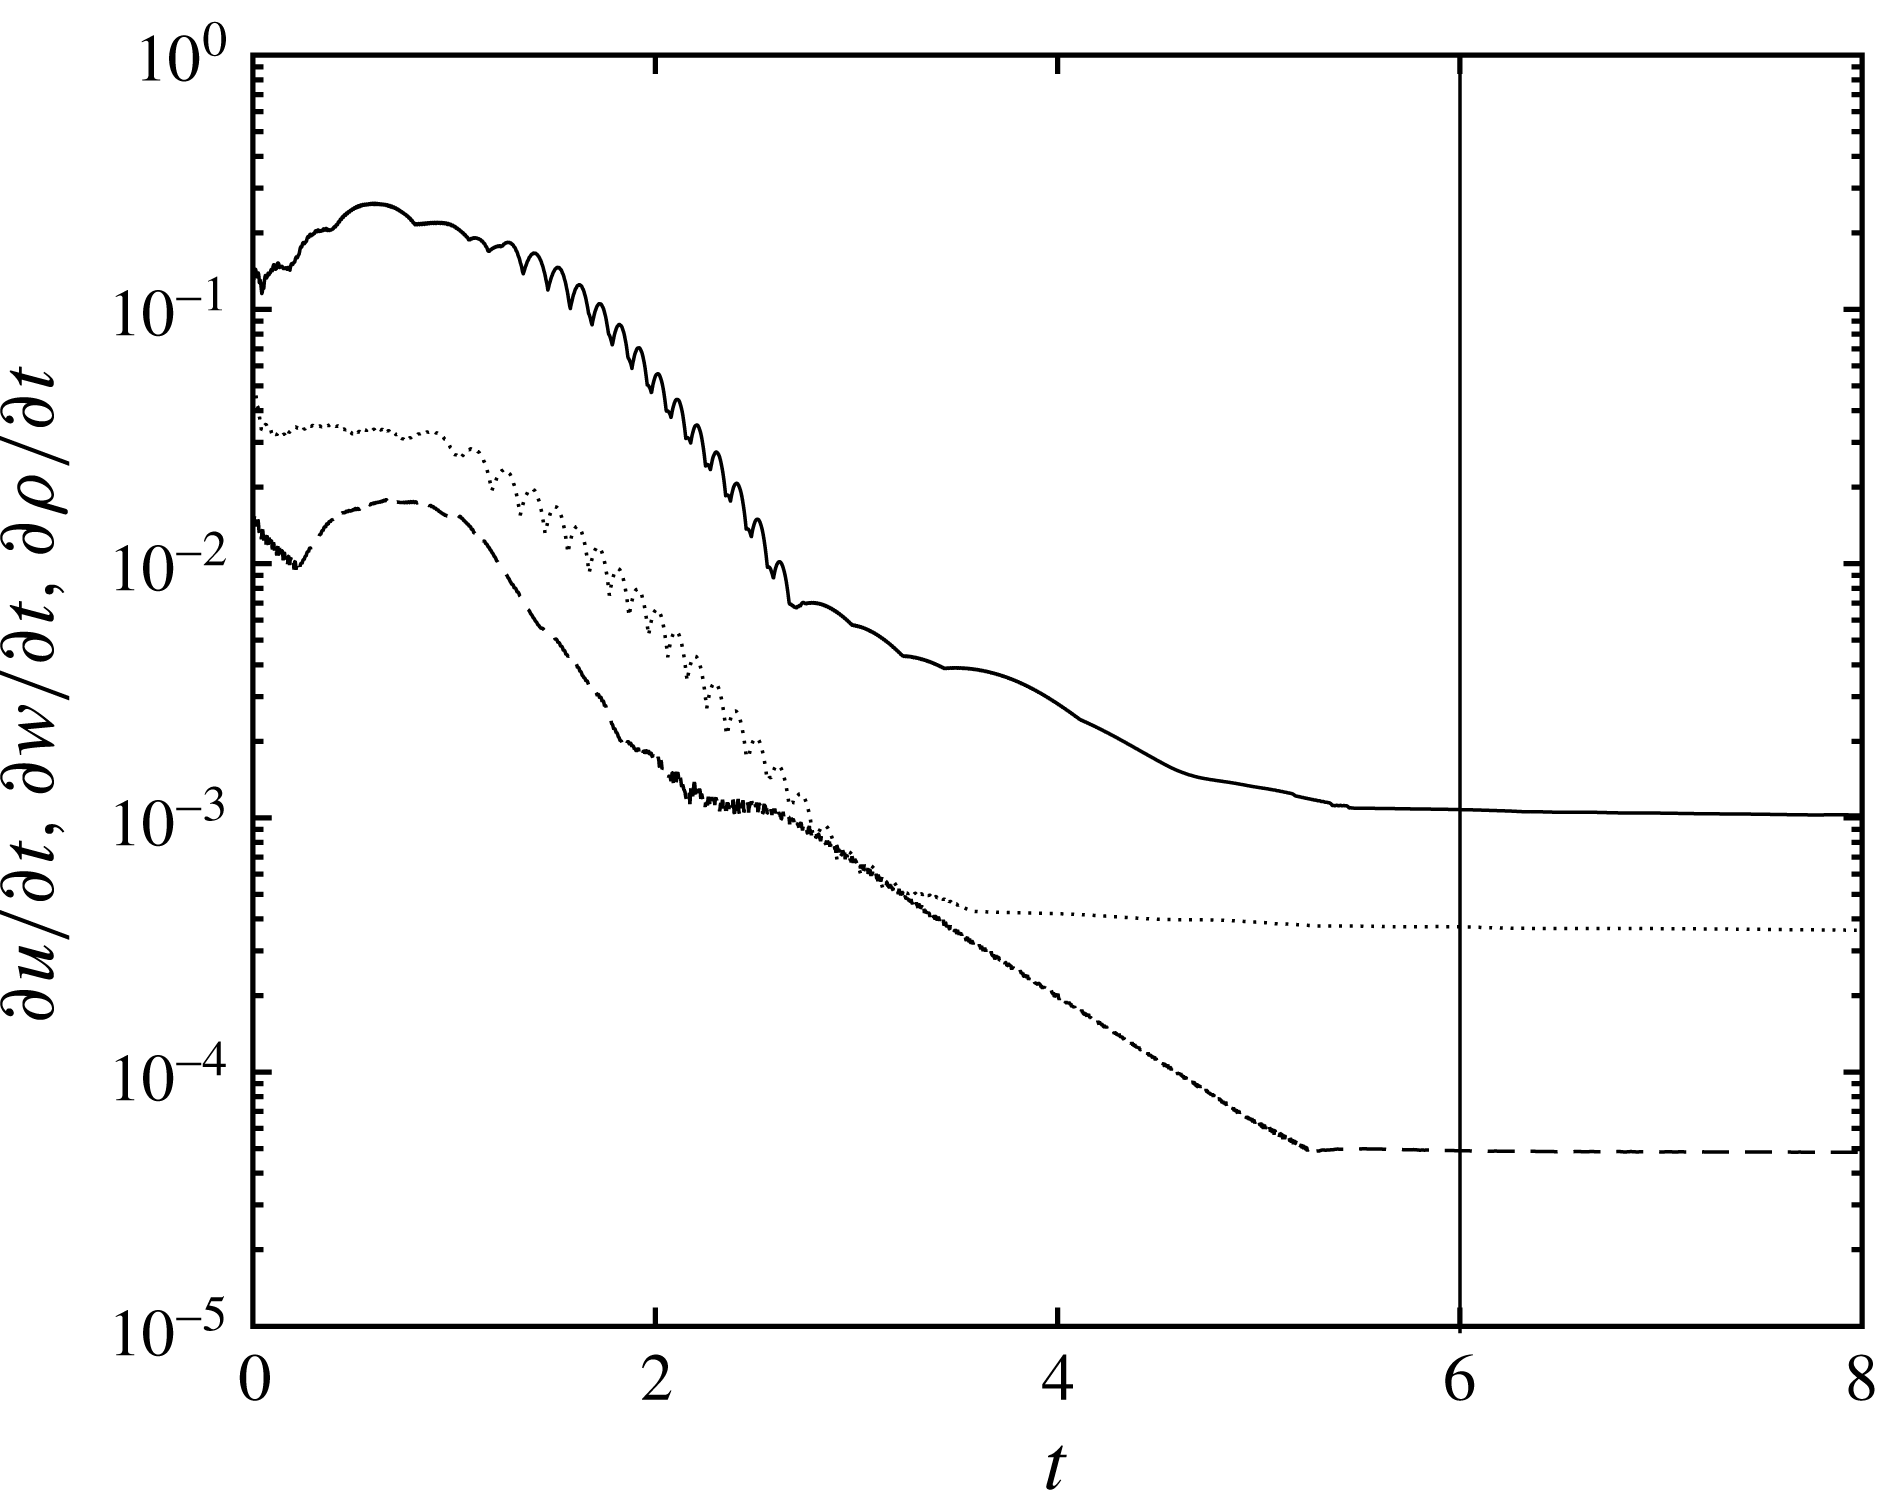
Solutions of the SFD system (2.8) were considered to be converged to a viscous quasi-steady state when the
 $L_{\infty }$
-norm of the temporal derivative of each component for the solution vector became constant (i.e. where the relaxation imposed by the SFD is only due to viscous effects). Initial transients adjustments are rapidly damped by the SFD and within
 $6$
–
 $10$
time units depending on the value of
 $c$
where the viscous stabilized DJL solutions are found to decay at a rate lower than
 $10^{-3}$
for the velocity and the density. The convergence of the algorithm is illustrated in figure 3 for a simulation initialized with a DJL wave computed at
 $c=0.4681$
,
 $Re=10^{5}$
and
 $Sc=1$
. The adjusted wave is then used as a steady base state for an optimal perturbation calculation under the assumption that the time scale for the transient dynamics,
 ${\sim}2L_{Ri}/c$
, is much faster than the subsequent changes to the viscously adjusted DJL wave. An adjusted wave develops only slight asymmetry about its crest and was found to propagate at a speed that is only
 ${\approx}4\,\%$
slower than the inviscid wave. Similar to the procedure used to solve the Navier–Stokes system (2.1) and the stabilized system (2.8), the linearized perturbation dynamics and the adjoint system are solved using the same projection method to recover a divergence-free velocity field.
Example of the convergence of the infinity norm
 $\Vert \unicode[STIX]{x2202}_{t}u\Vert _{\infty }$
(- - -),
 $\Vert \unicode[STIX]{x2202}_{t}w\Vert _{\infty }$
(
 $\cdots$
),
 $\Vert \unicode[STIX]{x2202}_{t}s\Vert _{\infty }$
(——) using the SFD algorithm (2.8), initialized with the DJL ISW computed at
 $c=0.4681$
and for the control parameters
 $Re=10^{5}$
and
 $Pr=1$
. The vertical line shows when the flow was considered to be at a quasi-steady state.

Because of the shorter vertical scale of the interfacial region in an inviscid DJL wave, it proved advantageous to switch to a scheme with a uniform grid of
 $513$
points in the vertical. Additionally, both the forward and adjoint equations were cast in streamfunction-vorticity form. Spatial derivatives in both
 $x$
and
 $z$
were computed with sixth-order compact finite differences (Lele Reference Lele1992) and the temporal integration uses a third-order Runge–Kutta method.
We note that for both the inviscid and viscously adjusted DJL waves the domain with total length
 $2L=6$
was adequate to eliminate effects of the boundaries because of both the use of the windowing function (3.3) and, as shown below, because the optimal disturbances were localized near the
 $Ri<0.25$
zone. As a consequence, many of the inviscid DJL wave cases were conducted with no windowing,
 $\unicode[STIX]{x1D6F7}(x)=1$
, and periodic conditions in
 $x$
with no discernible effect. Tests with
 $L=4$
also showed no influence of the domain length.
Finally, the optimization DAL procedure was considered converged when the
 $L_{2}$
norm of the energy difference between two iterates was smaller than
 $10^{-3}$
and when the
 $L_{2}$
norm between two iterations of the gradient (3.12) was smaller than
 $10^{-2}$
which were typically achieved after
 $12$
–
 $15$
iterations.
3.3 Optimal transient growth results
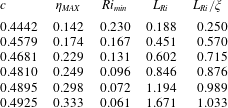
Optimal perturbations were computed from the direct–adjoint system (3.2)–(3.7) for six DJL internal solitary waves from the solution family in figure 2. The wave properties
 $c$
,
 $\unicode[STIX]{x1D702}_{MAX}$
,
 $Ri_{min}$
,
 $L_{Ri}$
and
 $L_{Ri}/\unicode[STIX]{x1D709}$
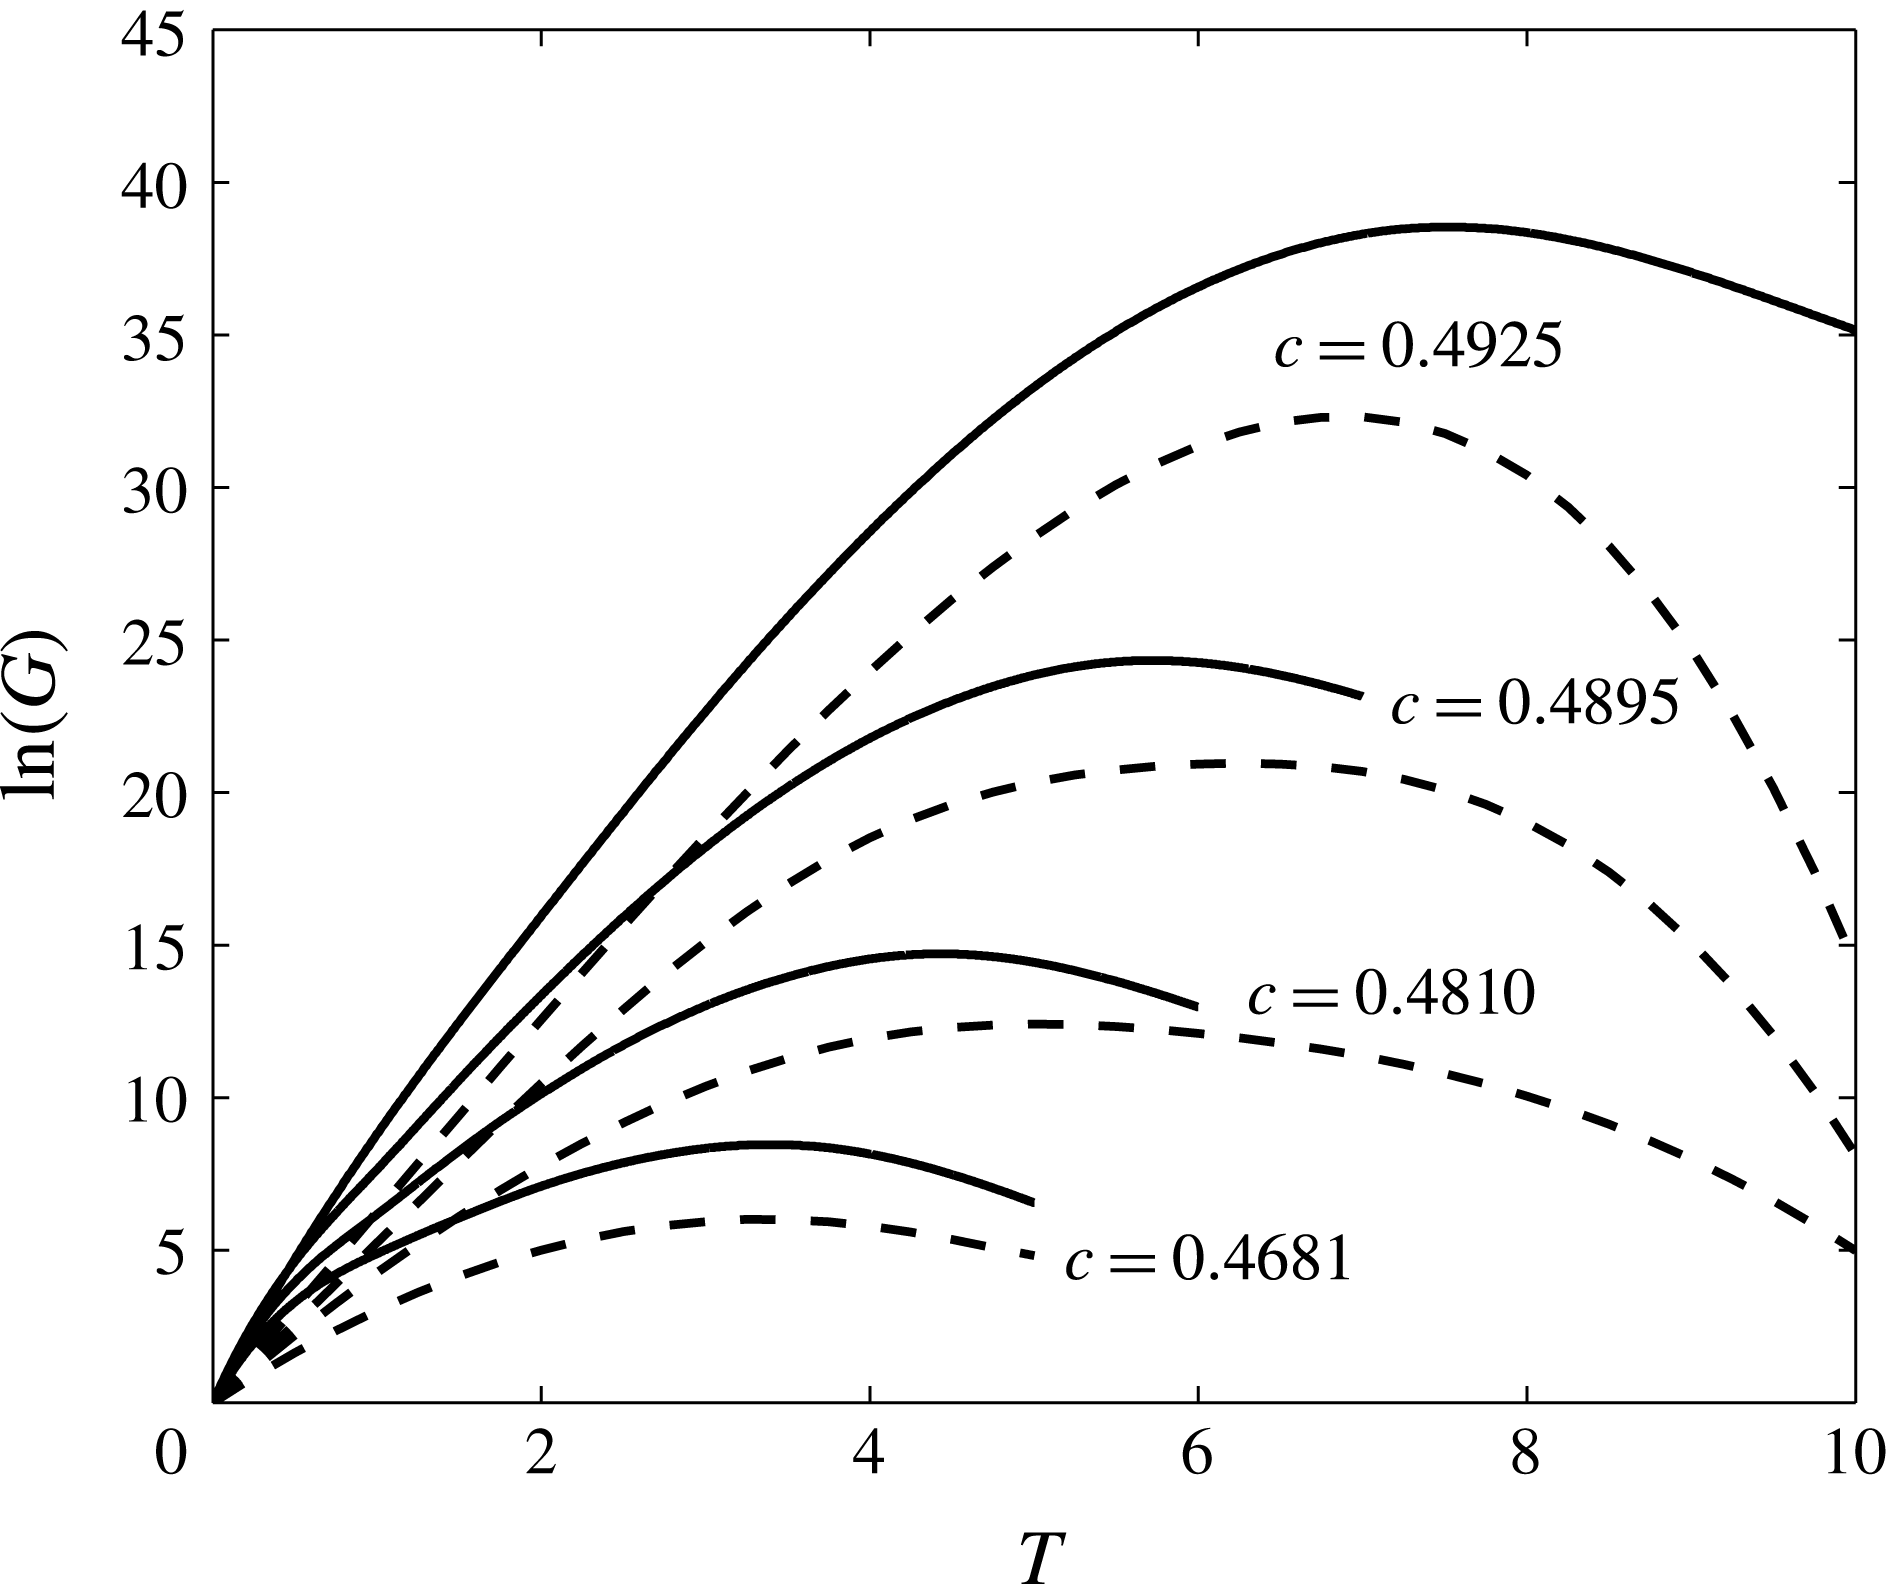
are given in table 1. Figure 4 shows the dependence of the natural logarithm of optimal gain
 $$\begin{eqnarray}\ln [G(T)]=\ln \left[\frac{E(T)}{E(0)}\right]\end{eqnarray}$$
versus the integration period
 $T$
for several of these waves. The perturbations were computed for
 $Re=10^{5}$
and
 $Sc=1$
. This Reynolds number is representative of laboratory experiments in water (
 $\unicode[STIX]{x1D708}\approx 10^{-6}~\text{m}^{2}~\text{s}^{-1}$
,
 $\unicode[STIX]{x0394}\unicode[STIX]{x1D70C}/\unicode[STIX]{x1D70C}_{0}=10^{-2}$
and
 $H\approx 0.5$
m) close to those by Carr et al. (Reference Carr, Fructus, Grue, Jensen and Davies2008, Reference Carr, Franklin, King, Davies, Grue and Dritschel2017). The choice
 $Sc=1$
is not correct, but used for numerical convenience. The figure shows
 $\ln [G(T)]$
for both the inviscid and viscously adjusted ISW base states at the same
 $c$
. In all cases the gain was found to reach a maximal value,
 $\ln (G_{MAX})$
, at a time
 $T_{MAX}$
. While viscous effects on the primary solitary wave lead to reduced gains and slightly different optimal times, the overall behaviour is unchanged. The maximal linear gain grows dramatically with
 $c$
, with
 $\ln (G_{MAX})\approx 40$
at
 $c=0.4925$
for the inviscid DJL wave and
 ${>}30$
for its viscously adjusted counterpart. These correspond to energy gains of up to
 $10^{17}$
, indicating just how unstable these waves can be. It also suggests that the nonlinear evolution of the optimal perturbations needs to be assessed. The optimal time scaled with
 $T_{MAX}\approx 2L_{Ri}/c$
, the time for the perturbation to travel through the potentially unstable zone. This is consistent with Camassa & Viotti (Reference Camassa and Viotti2012) who argued that thin-interface ISWs are convectively, but not globally, unstable.
Linear transient optimal growth gain
 $G$
versus the integration time
 $T$
for
 $c$
as indicated. The gain is found for
 $Re=10^{5}$
and
 $Sc=1$
. The solid (dashed) line is for the inviscid (
 $Re=10^{5}$
adjusted) DJL wave base state.

Properties of DJL solitary waves used in the optimal perturbation calculations.

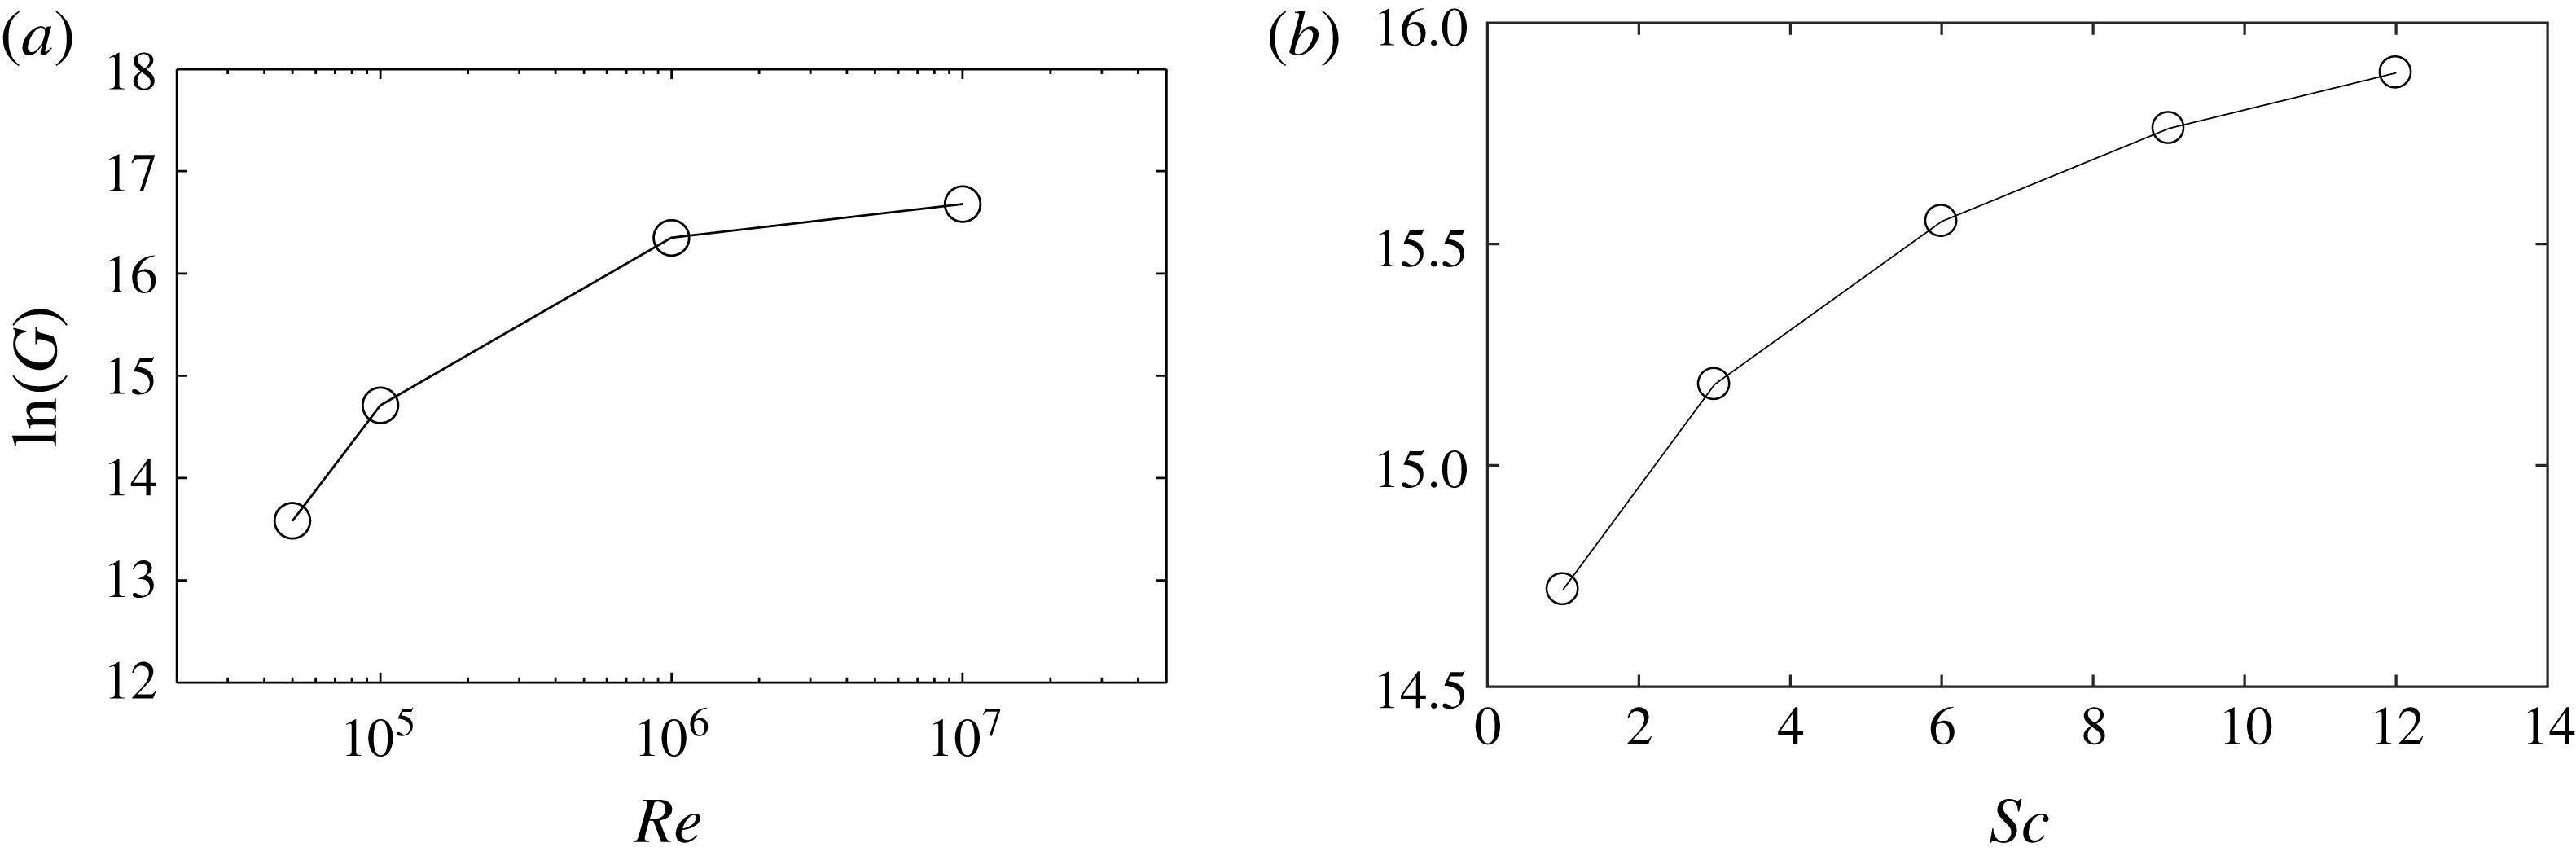
Figure 5 shows the effect of
 $Re$
on the perturbation energy gain,
 $G$
, at
 $T=4.43$
for the
 $c=0.4810$
inviscid DJL. The gain jumps approximately one order of magnitude from
 $Re=10^{5}$
to
 $10^{7}$
, although the change is small for
 $Re>10^{6}$
, suggesting an inviscid asymptote of
 $\ln (G)\sim 17$
. The effect of the varying the Schmidt number in the range
 $Sc=[1,12]$
, appropriate for temperature effects in water, with
 $Re=10^{5}$
, is shown in figure 5(b). Increasing
 $Sc$
also increases the gain, although the growth is modest and slows with increasing
 $Sc$
. In what follows we fix
 $Sc=1$
for computational expediency.
 $G$
at
 $T=4.43$
versus (a)
 $Re$
at
 $Sc=1$
and (b)
 $Sc$
at
 $Re=10^{5}$
for
 $c=0.4810$
and the inviscid DJL wave.

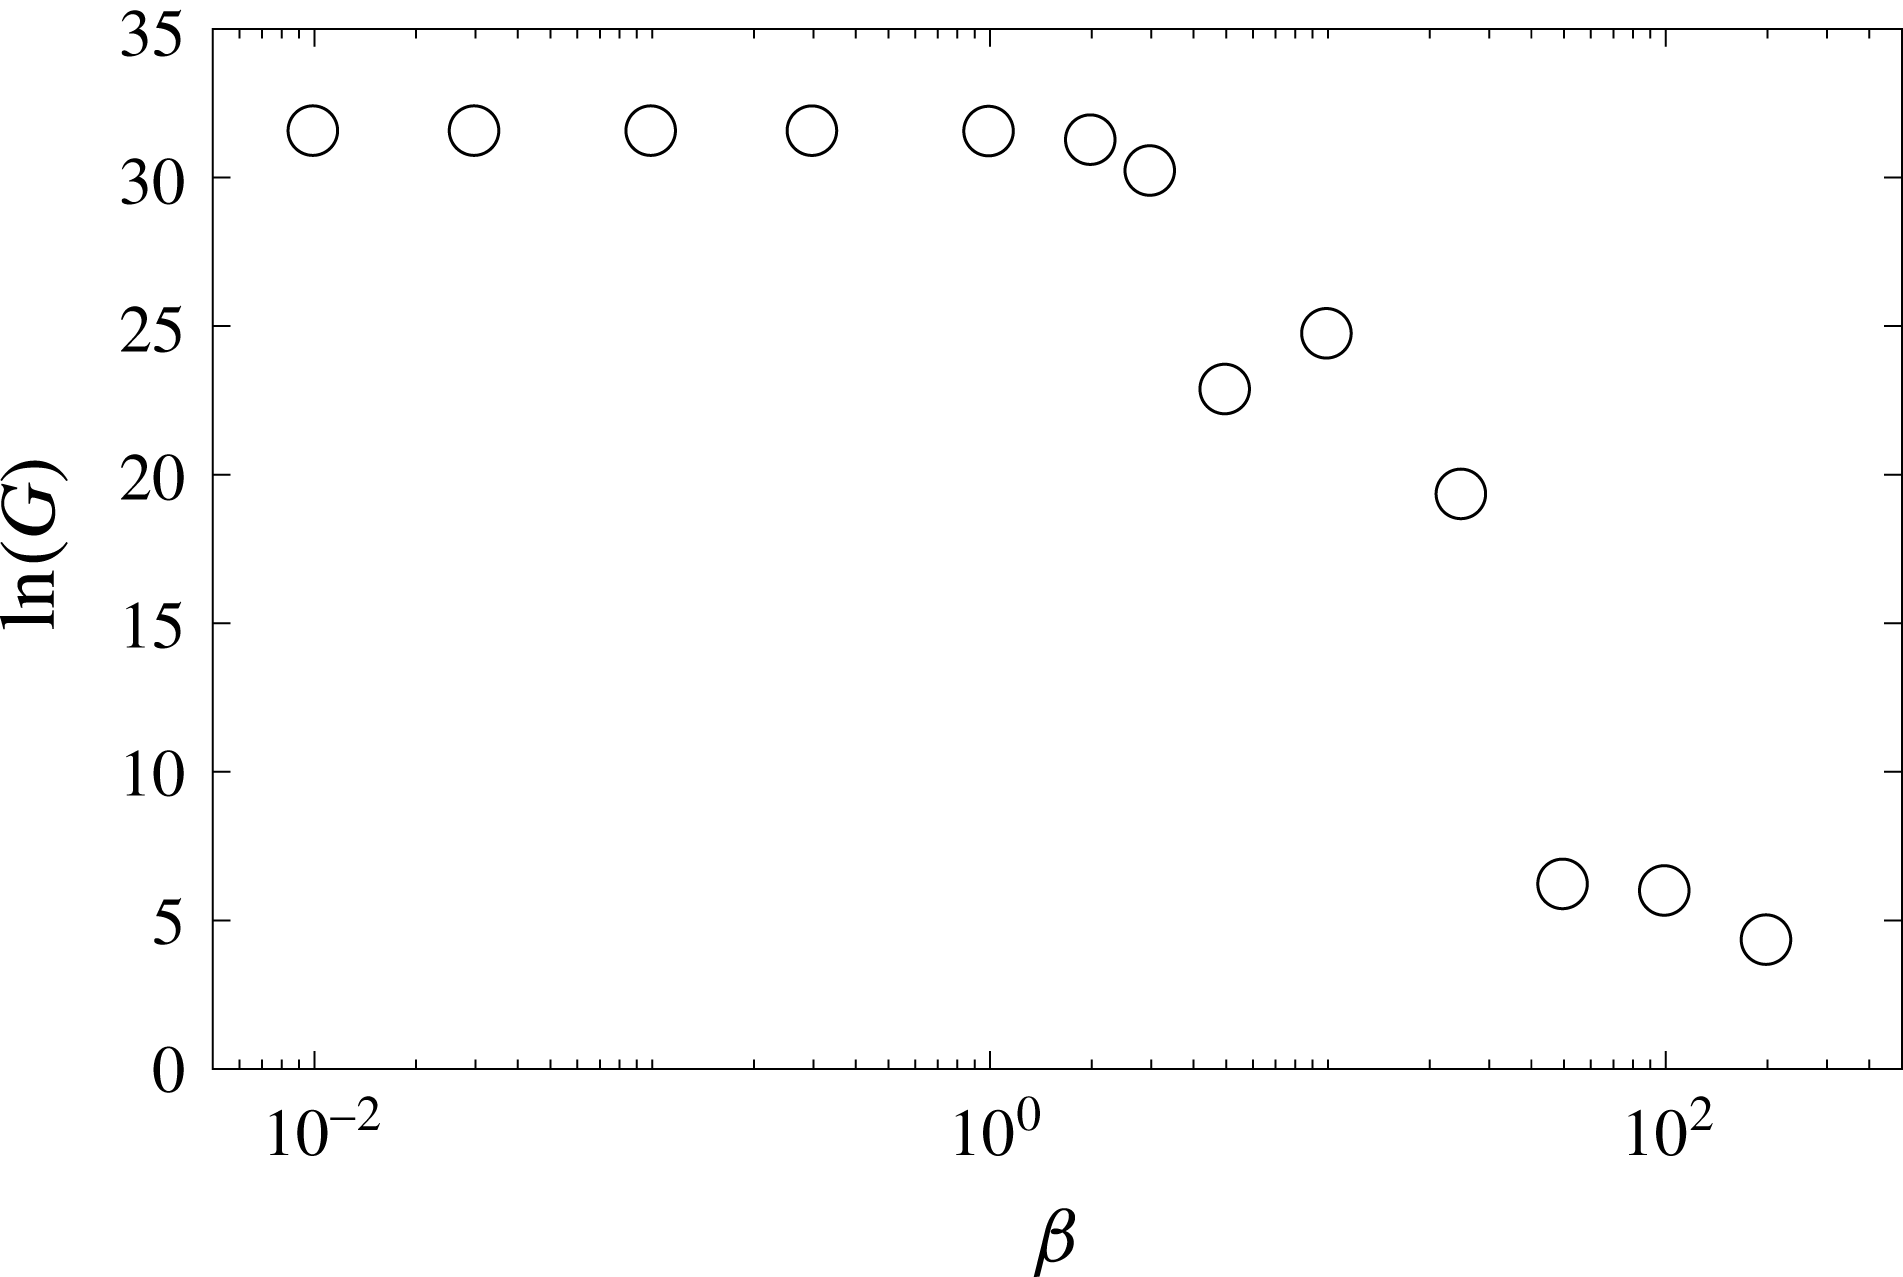
 $G$
at
 $T=6$
versus
 $\unicode[STIX]{x1D6FD}$
, the transverse wavenumber, for the
 $Re=10^{5}$
adjusted DJL wave with
 $c=0.4925$
.

We also investigated the energy growth obtained by two-dimensional against three-dimensional DAL perturbations since there is no equivalent to Squire’s theorem (Squire Reference Squire1933; Schmid & Henningson Reference Schmid and Henningson2001) for stratified shear flows. We employed a Fourier decomposition in the transverse (
 $y$
) direction and three-dimensional perturbation of the form
 $\boldsymbol{q}^{\prime }=\tilde{\boldsymbol{q}}(x,z)\text{e}^{\text{i}\unicode[STIX]{x1D6FD}y}$
, where
 $\unicode[STIX]{x1D6FD}$
is the transverse wavenumber considered. Linear gains were computed for
 $T=6$
with the
 $c=0.4925$
,
 $Re=10^{5}$
adjusted DJL wave (see figure 6). As expected, the optimal gain
 $G$
was maximum at
 $\unicode[STIX]{x1D6FD}=0$
, although the change is minimal for
 $\unicode[STIX]{x1D6FD}\leqslant 2$
. It is worth noting that a large gain,
 $\ln (G)\approx 20$
, can still be achieved for
 $\unicode[STIX]{x1D6FD}\approx 20$
. As shown below, this transverse scale is comparable to the longitudinal scale of the optimal disturbance.
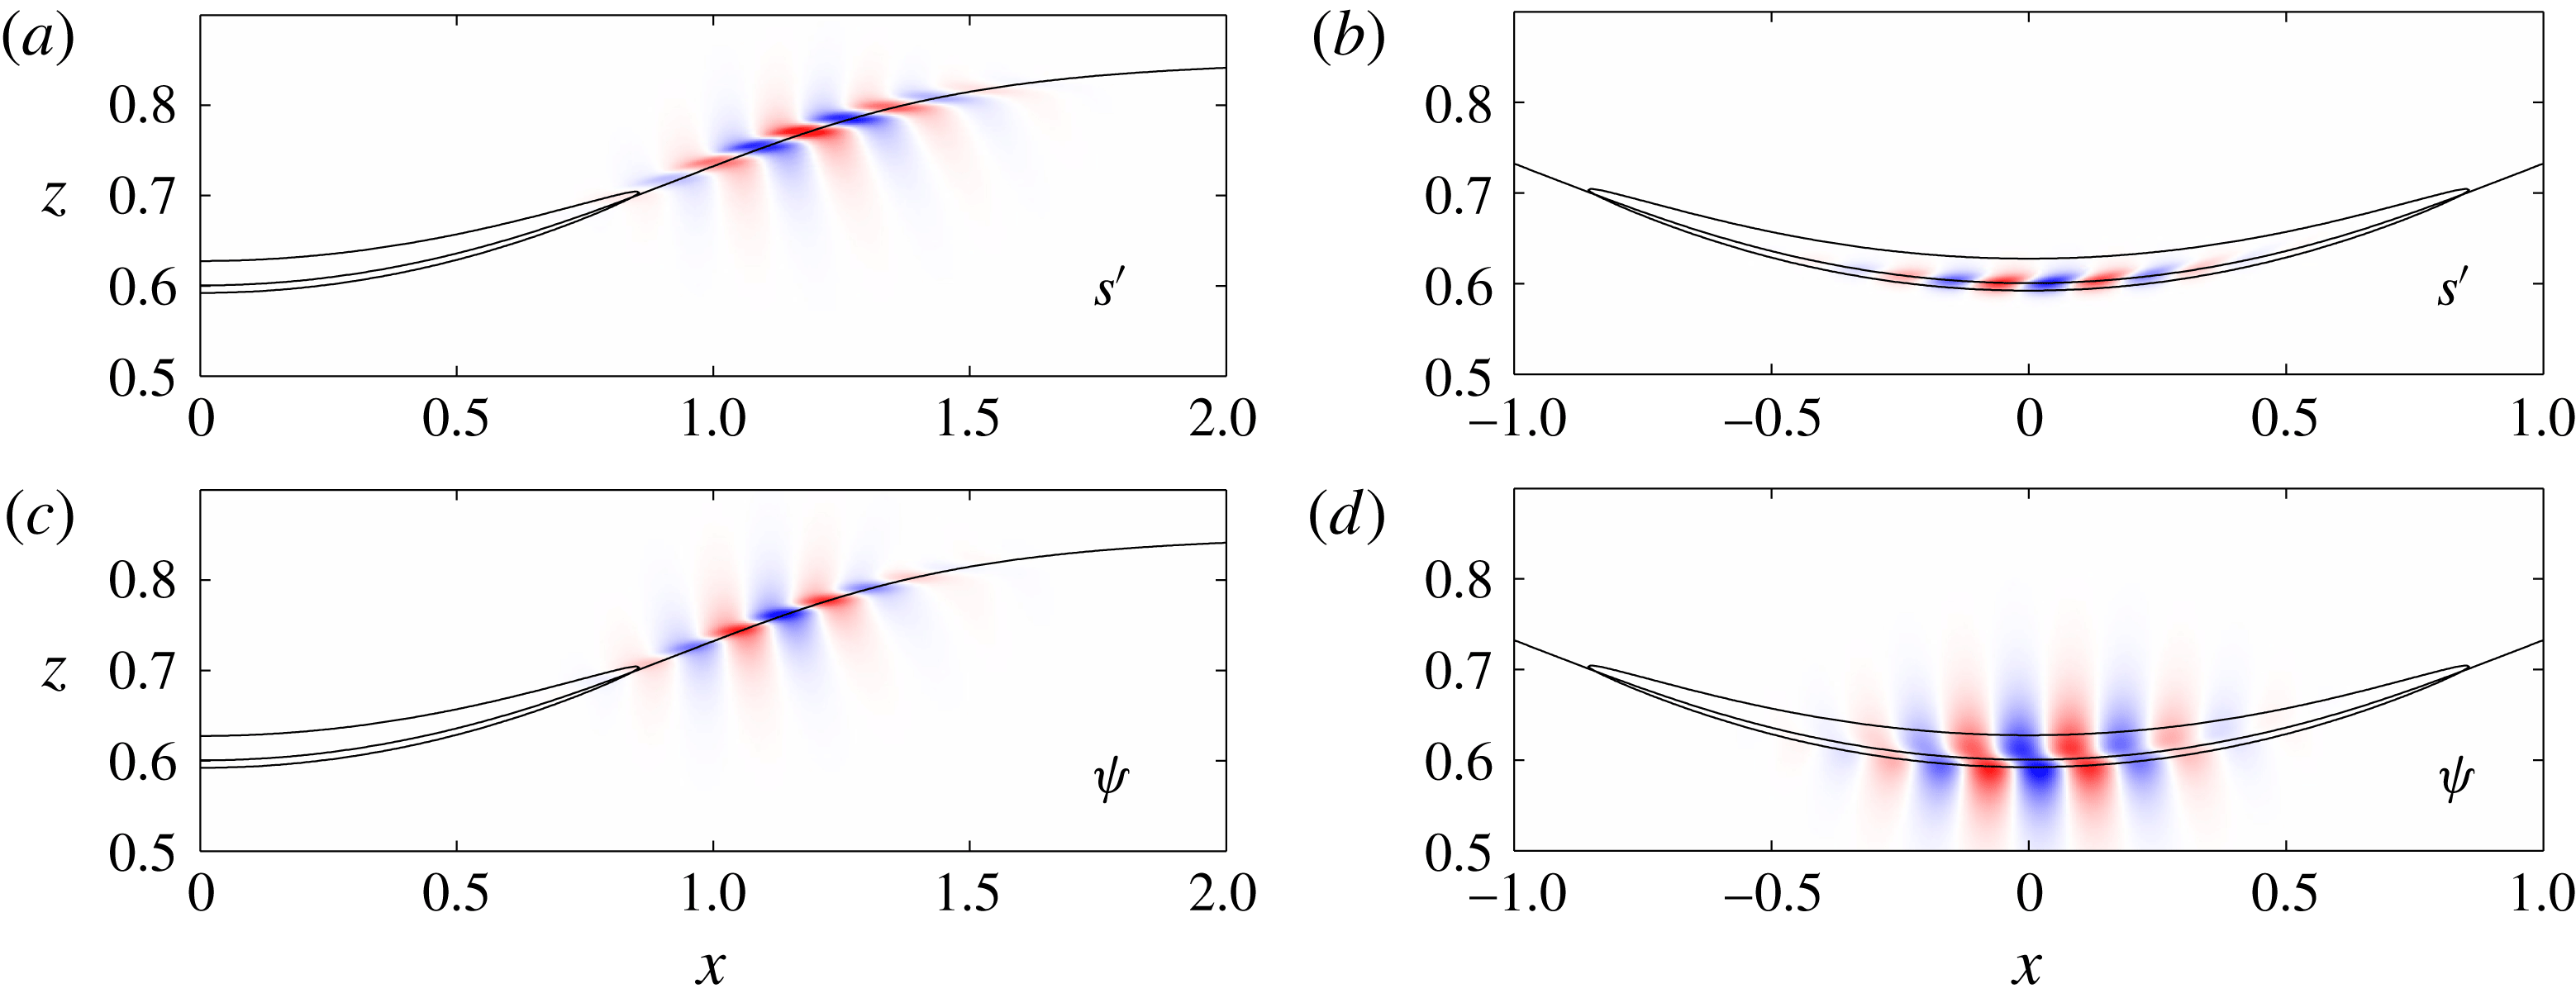
The structure and evolution of the optimal perturbation (
 $T_{MAX}=4.43$
) at
 $Re=10^{5}$
for the
 $c=0.4810$
inviscid DJL wave is illustrated in figure 7. The figure shows the perturbation density
 $s^{\prime }$
and streamfunction
 $\unicode[STIX]{x1D713}$
(defined by
 $\unicode[STIX]{x1D713}_{z}=u^{\prime }$
and
 $\unicode[STIX]{x1D713}_{x}=-w^{\prime }$
) in the frame of a solitary wave that is propagating to the right (
 $c>0$
). The fields have been normalized by their respective maximum values for clarity. The initial (
 $t=0$
) optimal disturbance is a localized wave packet just upstream of the
 $Ri<0.25$
region (see figure 7
a,c). Both
 $s^{\prime }$
and
 $\unicode[STIX]{x1D713}$
are tilted into the ISW-induced shear. The disturbance is dominated by its total kinetic energy which is
 ${\approx}3\times 10^{3}$
times larger than the potential energy. The tilt and dominance of the velocity field over the density field suggests disturbance amplification through the non-normal Orr mechanism (Orr Reference Orr1907). This will be explored further in § 4.3.
As the optimal perturbation travels through the ISW, the wave packet is amplified and its structure changes. Figure 7(b,d) shows the packet at
 $t=2.2$
when it is located at the wave crest. The
 $\unicode[STIX]{x1D713}$
field is still tilted into the shear, but extends further away from the interfacial region. The
 $s^{\prime }$
field is more confined and tilted with the shear. This structure of both fields and the ratio of total potential to kinetic energies,
 $0.238$
, are consistent with a standard unstable K–H normal mode.
(a,c) The structure of the optimal linear perturbation for the
 $c=0.4810$
DJL wave base state with
 $Re=10^{5}$
(at
 $T_{MAX}=4.43$
). (a,b) The structure of the perturbation density field
 $s^{\prime }$
and (c,d) the streamfunction
 $\unicode[STIX]{x1D713}$
. The solid lines are the
 $S=0.5$
and the
 $Ri=0.25$
contours. (b,d) The structure of the optimal linear at
 $t=2.2$
from a forward linear calculation. In both (a,c) and (b,d) the perturbation fields have been normalized by their maximum values.

An
 $x$
–
 $t$
plot of
 $\unicode[STIX]{x1D713}$
, normalized to a maximum of one at each time, on the
 $S=0.5$
contour from the forward linear calculation in figure 7(b,d). The dashed lines are at
 $|x|=L_{Ri}$
.

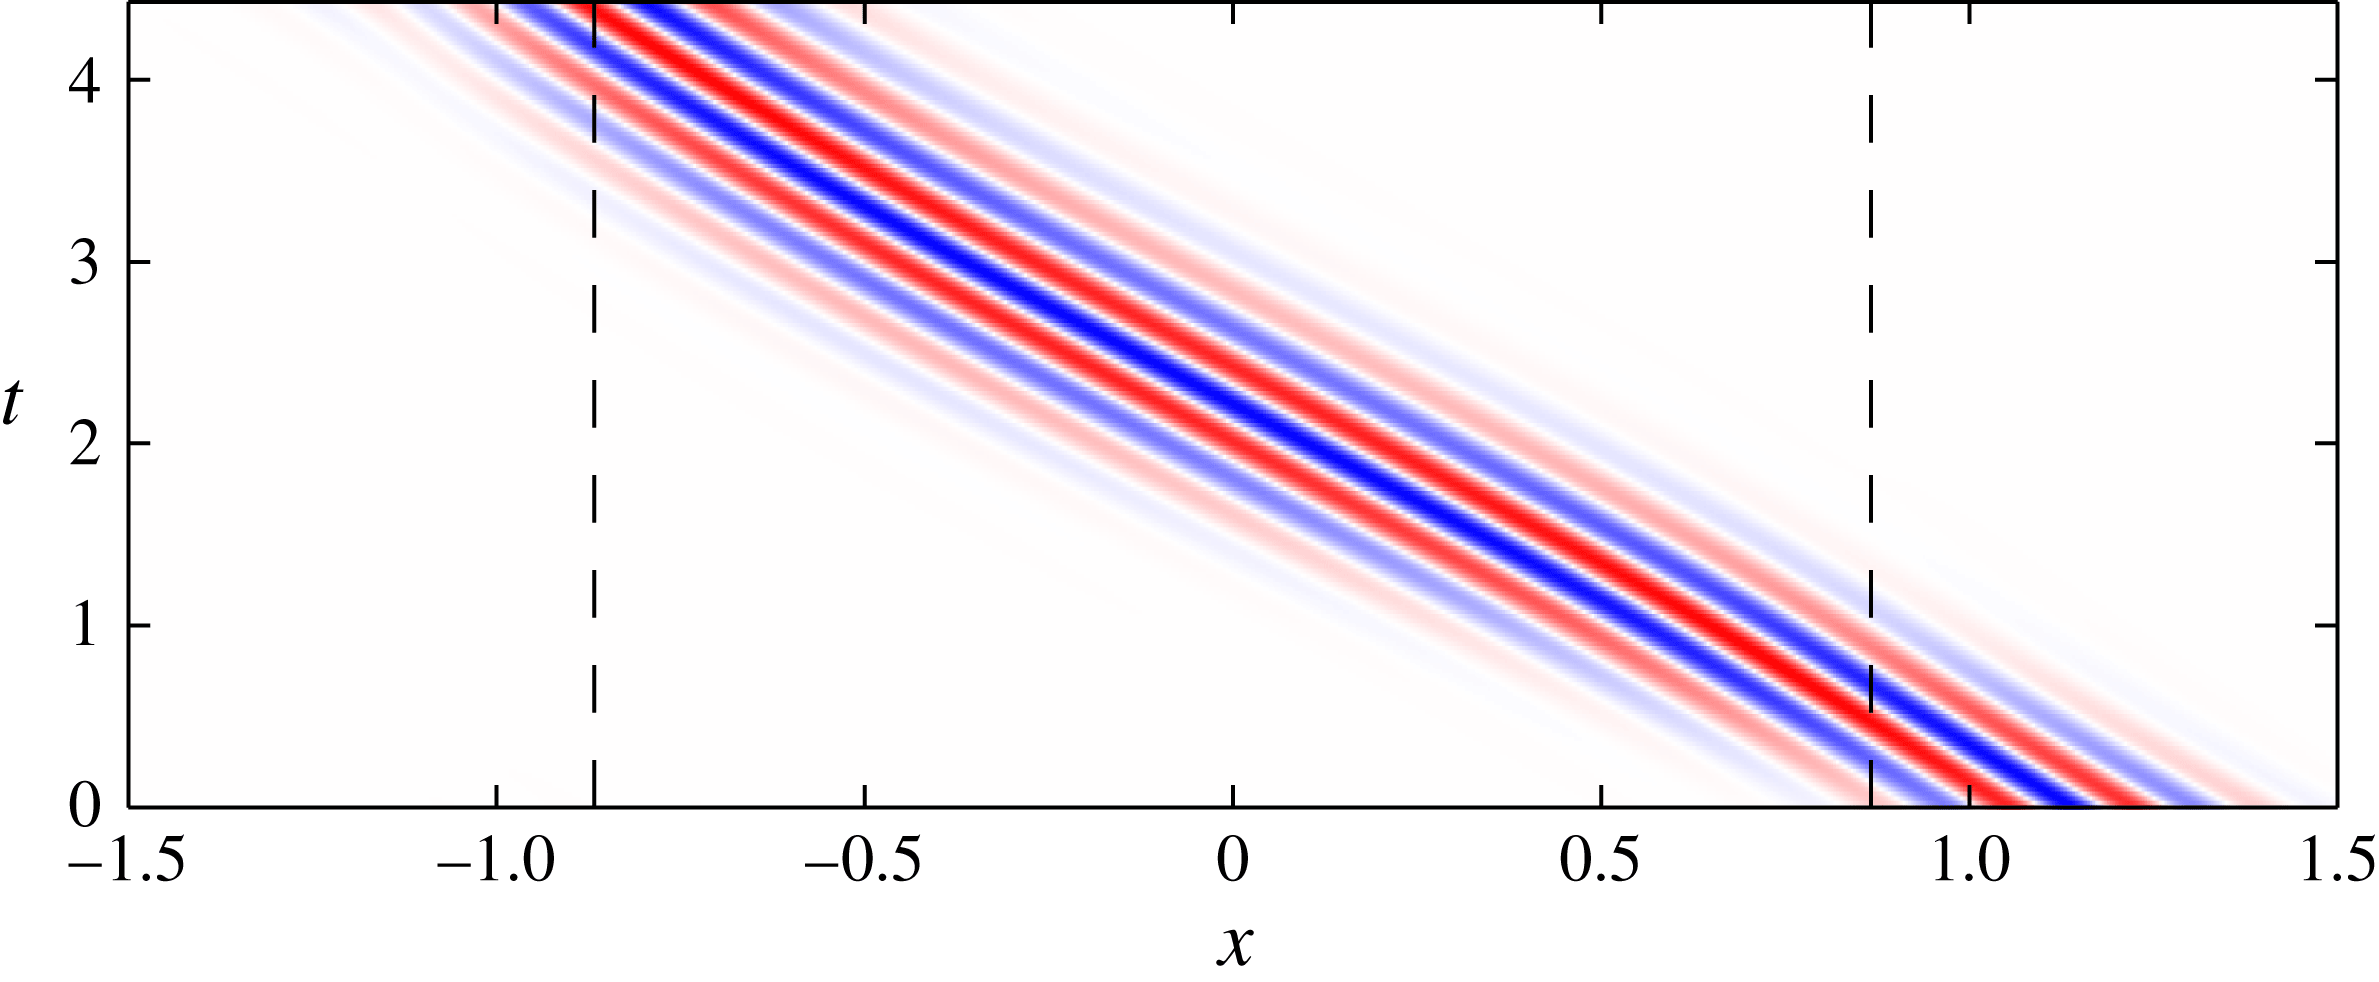
The temporal evolution of the optimal wave packet further illustrated in figure 8 by means of an
 $x-t$
diagram of
 $\unicode[STIX]{x1D713}$
along the
 $S=0.5$
isopycnal. Again,
 $\unicode[STIX]{x1D713}$
is scaled by the maximum value at each time. The wave packet remains localized and travels at a quasi-constant group velocity through the solitary wave. The phase and packet group velocities are nearly identical. The carrier, or central, frequency of the waves in the packet is
 $\unicode[STIX]{x1D714}=-14.85$
. The negative sign is used since
 $\unicode[STIX]{x1D714}$
is a Doppler shifted value in the frame moving with the solitary wave and we will take all real wavenumbers
 $k>0$
. The carrier frequency of the wave packet is found using the discrete Hilbert transform in
 $t$
of
 $\unicode[STIX]{x1D713}(x,t)$
. At fixed
 $x$
, this gives
 $Z(t)=H(\unicode[STIX]{x1D713}(t))=A\exp (\text{i}\unicode[STIX]{x1D703})$
, where
 $H(\cdot )$
is the Hilbert transform. Then
 $A(t)=|Z(t)|$
is the packet envelop and
 $\text{d}\unicode[STIX]{x1D703}/\text{d}t$
is the instantaneous frequency (Oppenheim, Schafer & Buck Reference Oppenheim, Schafer and Buck1999). The carrier frequency is then defined as the average of
 $\text{d}\unicode[STIX]{x1D703}/dt$
for
 $A/A_{0}>0.7$
, where
 $A_{0}=\max (A)$
. These values are then averaged over a range of
 $x$
around
 $x=0$
to obtain the reported frequency,
 $\unicode[STIX]{x1D714}$
. Standard Fourier analysis gives estimates generally within
 $\pm 0.1$
; however, the Hilbert analysis is used since it also gives the envelop characteristics and allows
 $\unicode[STIX]{x1D714}$
to be defined in a way that avoids potential dispersive effects at the edges of a packet. A similar analysis in
 $x$
at fixed
 $t$
gives the central wavenumber of the packet (see the discussion in § 4).
The structure and behaviour of optimal disturbances for all the other ISWs (i.e.
 $c$
) examined are consistent with figures 7 and 8. The optimal packets are initially situated just upstream of the
 $Ri<0.25$
zone, remain coherent and compact as they move through the ISW and have well-defined wavenumbers and frequencies. As a consequence, a local approach to transient growth might be expected to be relevant.
4 Transient growth in the WKB limit
The present flow geometry appears to be an interesting case for a comparison between the optimal perturbation and the amplification rate predicted by the local linear spatial stability properties of the ISW. In the following, we consider steady-state inviscid DJL waves in the same range,
 $c=[0.4442,0.4925]$
, as the transient growth analysis in § 3. Following Lamb & Farmer (Reference Lamb and Farmer2011), spatial stability analyses for locally parallel ISW base flows were performed to extract the maximum spatial growth rate at each position, from which the perturbation growth in
 $x$
could be estimated.
4.1 Local stability analysis
Normal modes are sought of the form
 $$\begin{eqnarray}\unicode[STIX]{x1D713}=\hat{\unicode[STIX]{x1D713}}(z)\,\text{e}^{\text{i}(kx-\unicode[STIX]{x1D714}t)},\end{eqnarray}$$
where the (real) frequency is
 $\unicode[STIX]{x1D714}$
and the (complex) wavenumber
 $k=k_{r}+\text{i}k_{i}$
is the spatial eigenvalue. Here
 $k_{r}$
is the horizontal wavenumber and
 $k_{i}$
is the spatial growth rate. Linearizing the Navier–Stokes system for the parallel flow profiles
 $(U(z),0,S(z))$
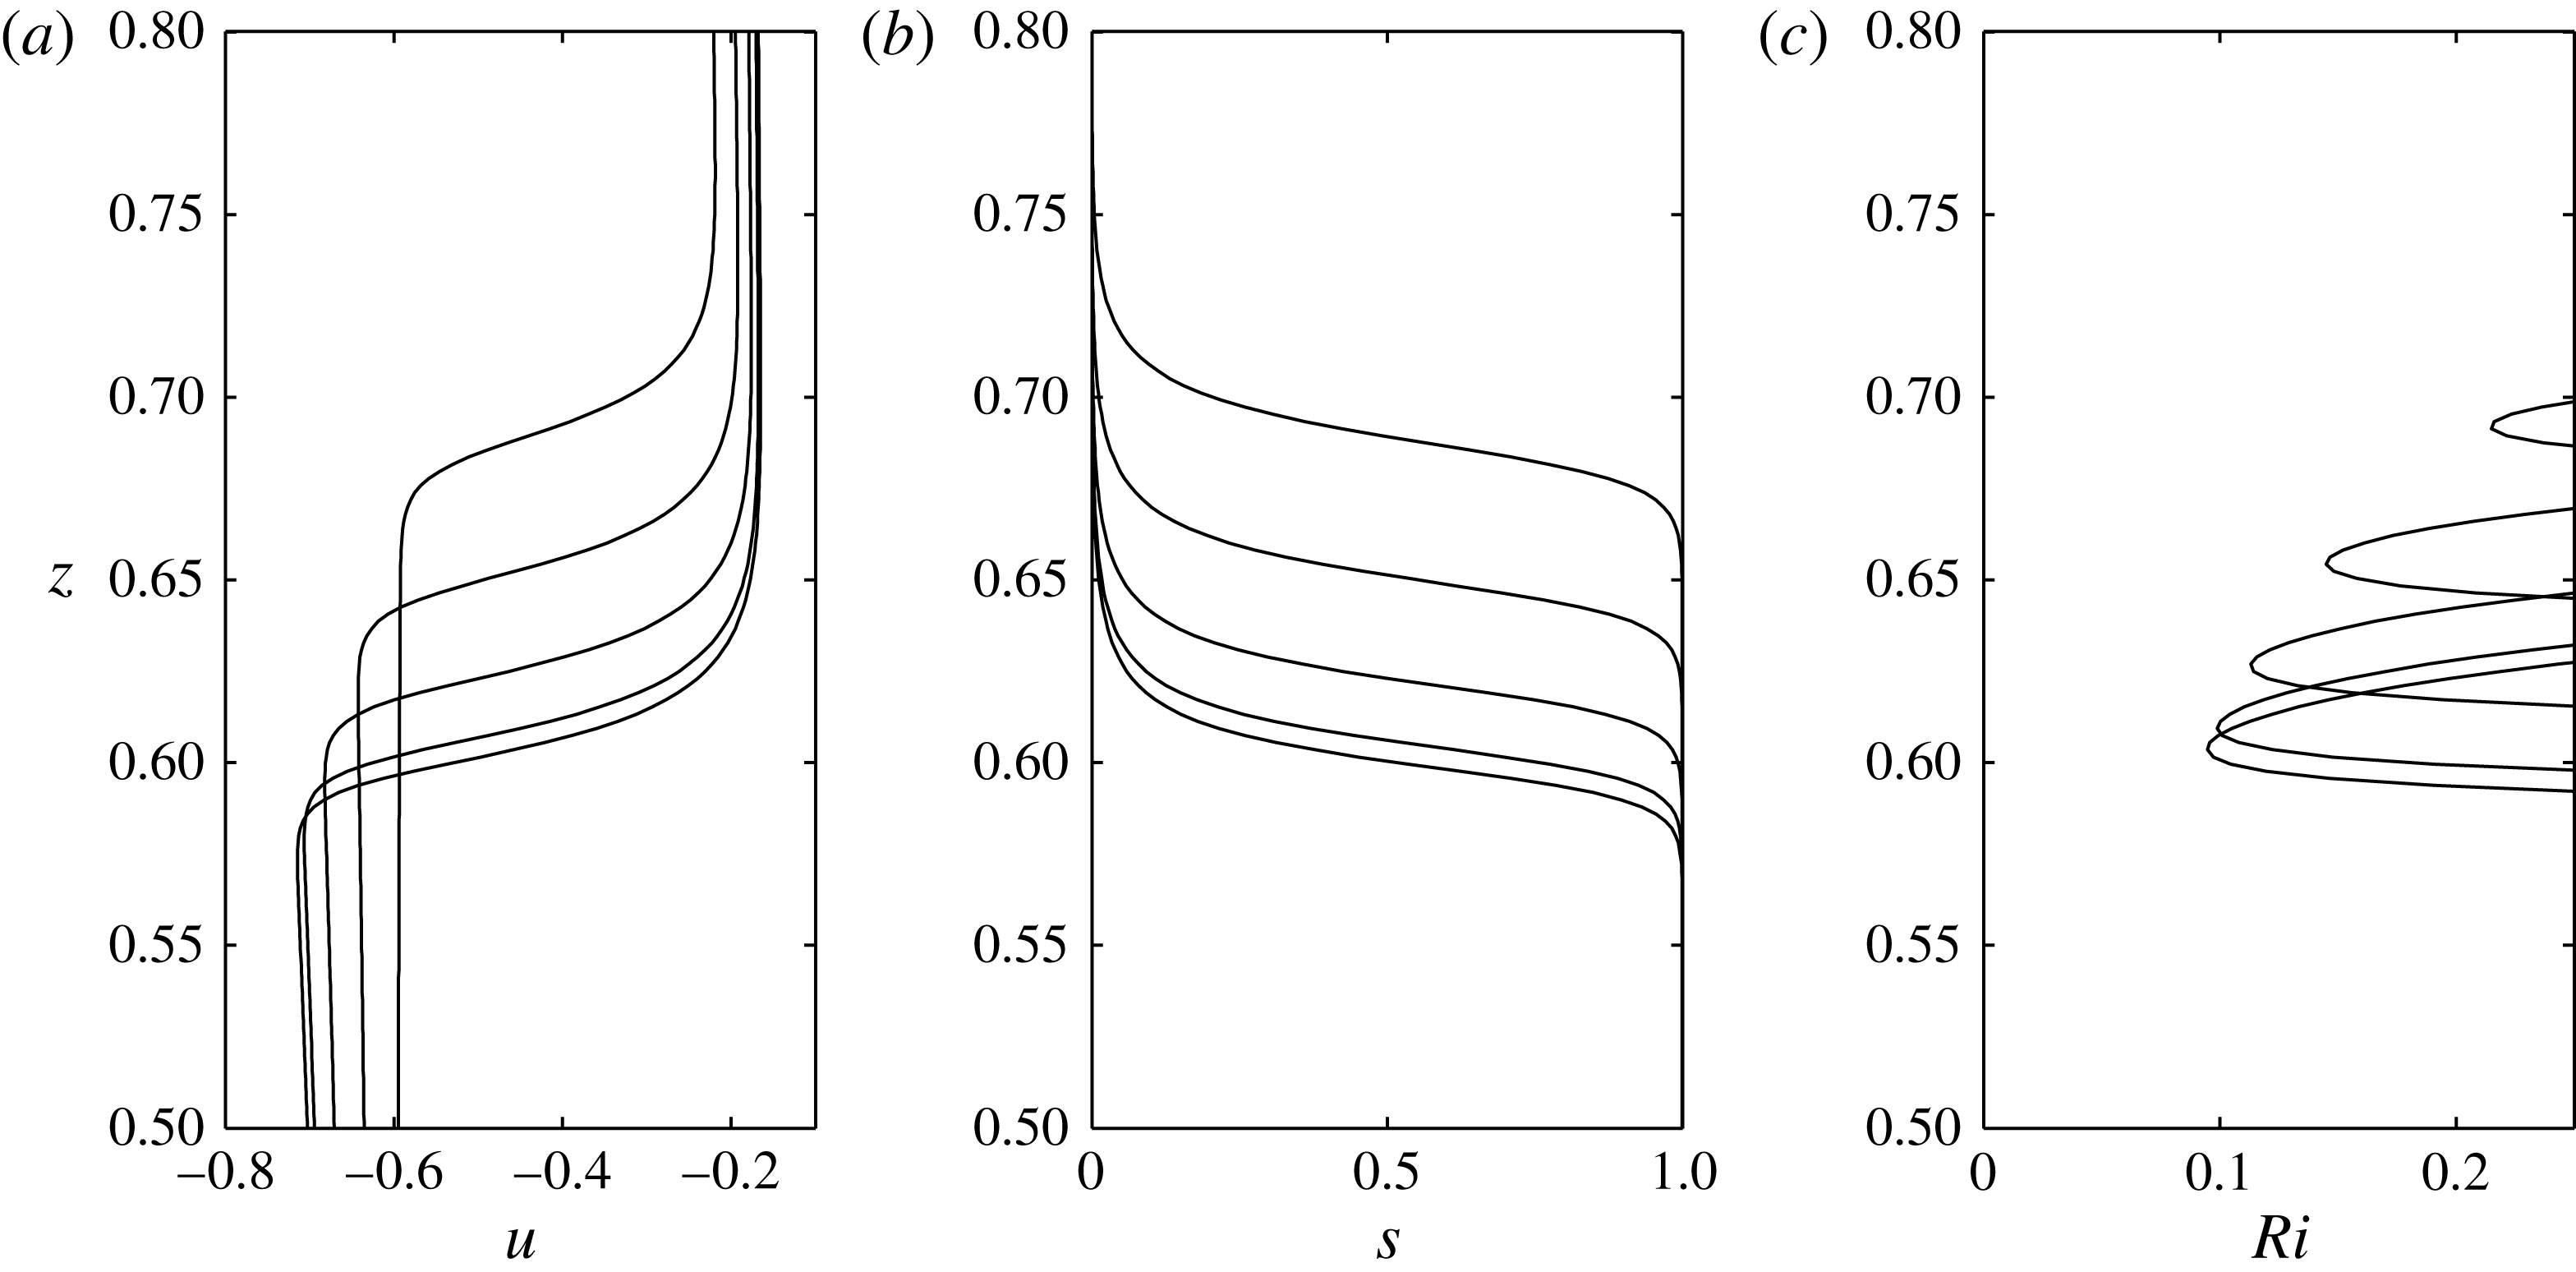
shown in figure 9(a,b), taking the curl of (3.2) in the
 $(x{-}z)$
plane and combining with the density equation, the Taylor–Goldstein (T–G) equation reads
 $$\begin{eqnarray}\left[\left(\frac{\unicode[STIX]{x2202}^{2}}{\unicode[STIX]{x2202}z^{2}}-k^{2}\right)+\frac{k^{2}N^{2}-k(Uk-\unicode[STIX]{x1D714})U^{\prime \prime }}{(Uk-\unicode[STIX]{x1D714})^{2}}\right]\hat{\unicode[STIX]{x1D713}}=0,\quad \text{where}~\hat{\unicode[STIX]{x1D713}}(0)=\hat{\unicode[STIX]{x1D713}}(1)=0,\end{eqnarray}$$
and
 $N^{2}(z)=-S_{z}$
(in non-dimensional variables). The eigenvalue problem (4.2) is solved for specified background state using MATLAB’s bvp5c adaptive boundary value problem solver (Matlab 2014).
Vertical profiles of (a)
 $U(z)$
in the wave frame, (b)
 $S(z)$
and (c)
 $Ri(z)$
for the
 $c=0.4810$
DJL wave at
 $|x|=0,0.2,0.4,0.6$
and
 $0.8$
.

Vertical profiles of velocity, density and Richardson number at several positions within
 $-L_{Ri}<x<L_{Ri}$
are shown in figure 9(a) for the
 $c=0.4810$
ISW. Note that the velocities are in the frame moving with the solitary wave and that the structure is symmetric about
 $x=0$
. As
 $|x|$
decreases, the minimum Richardson number decreases to
 $Ri_{min}=0.096$
at
 $x=0$
. The spatial growth rate
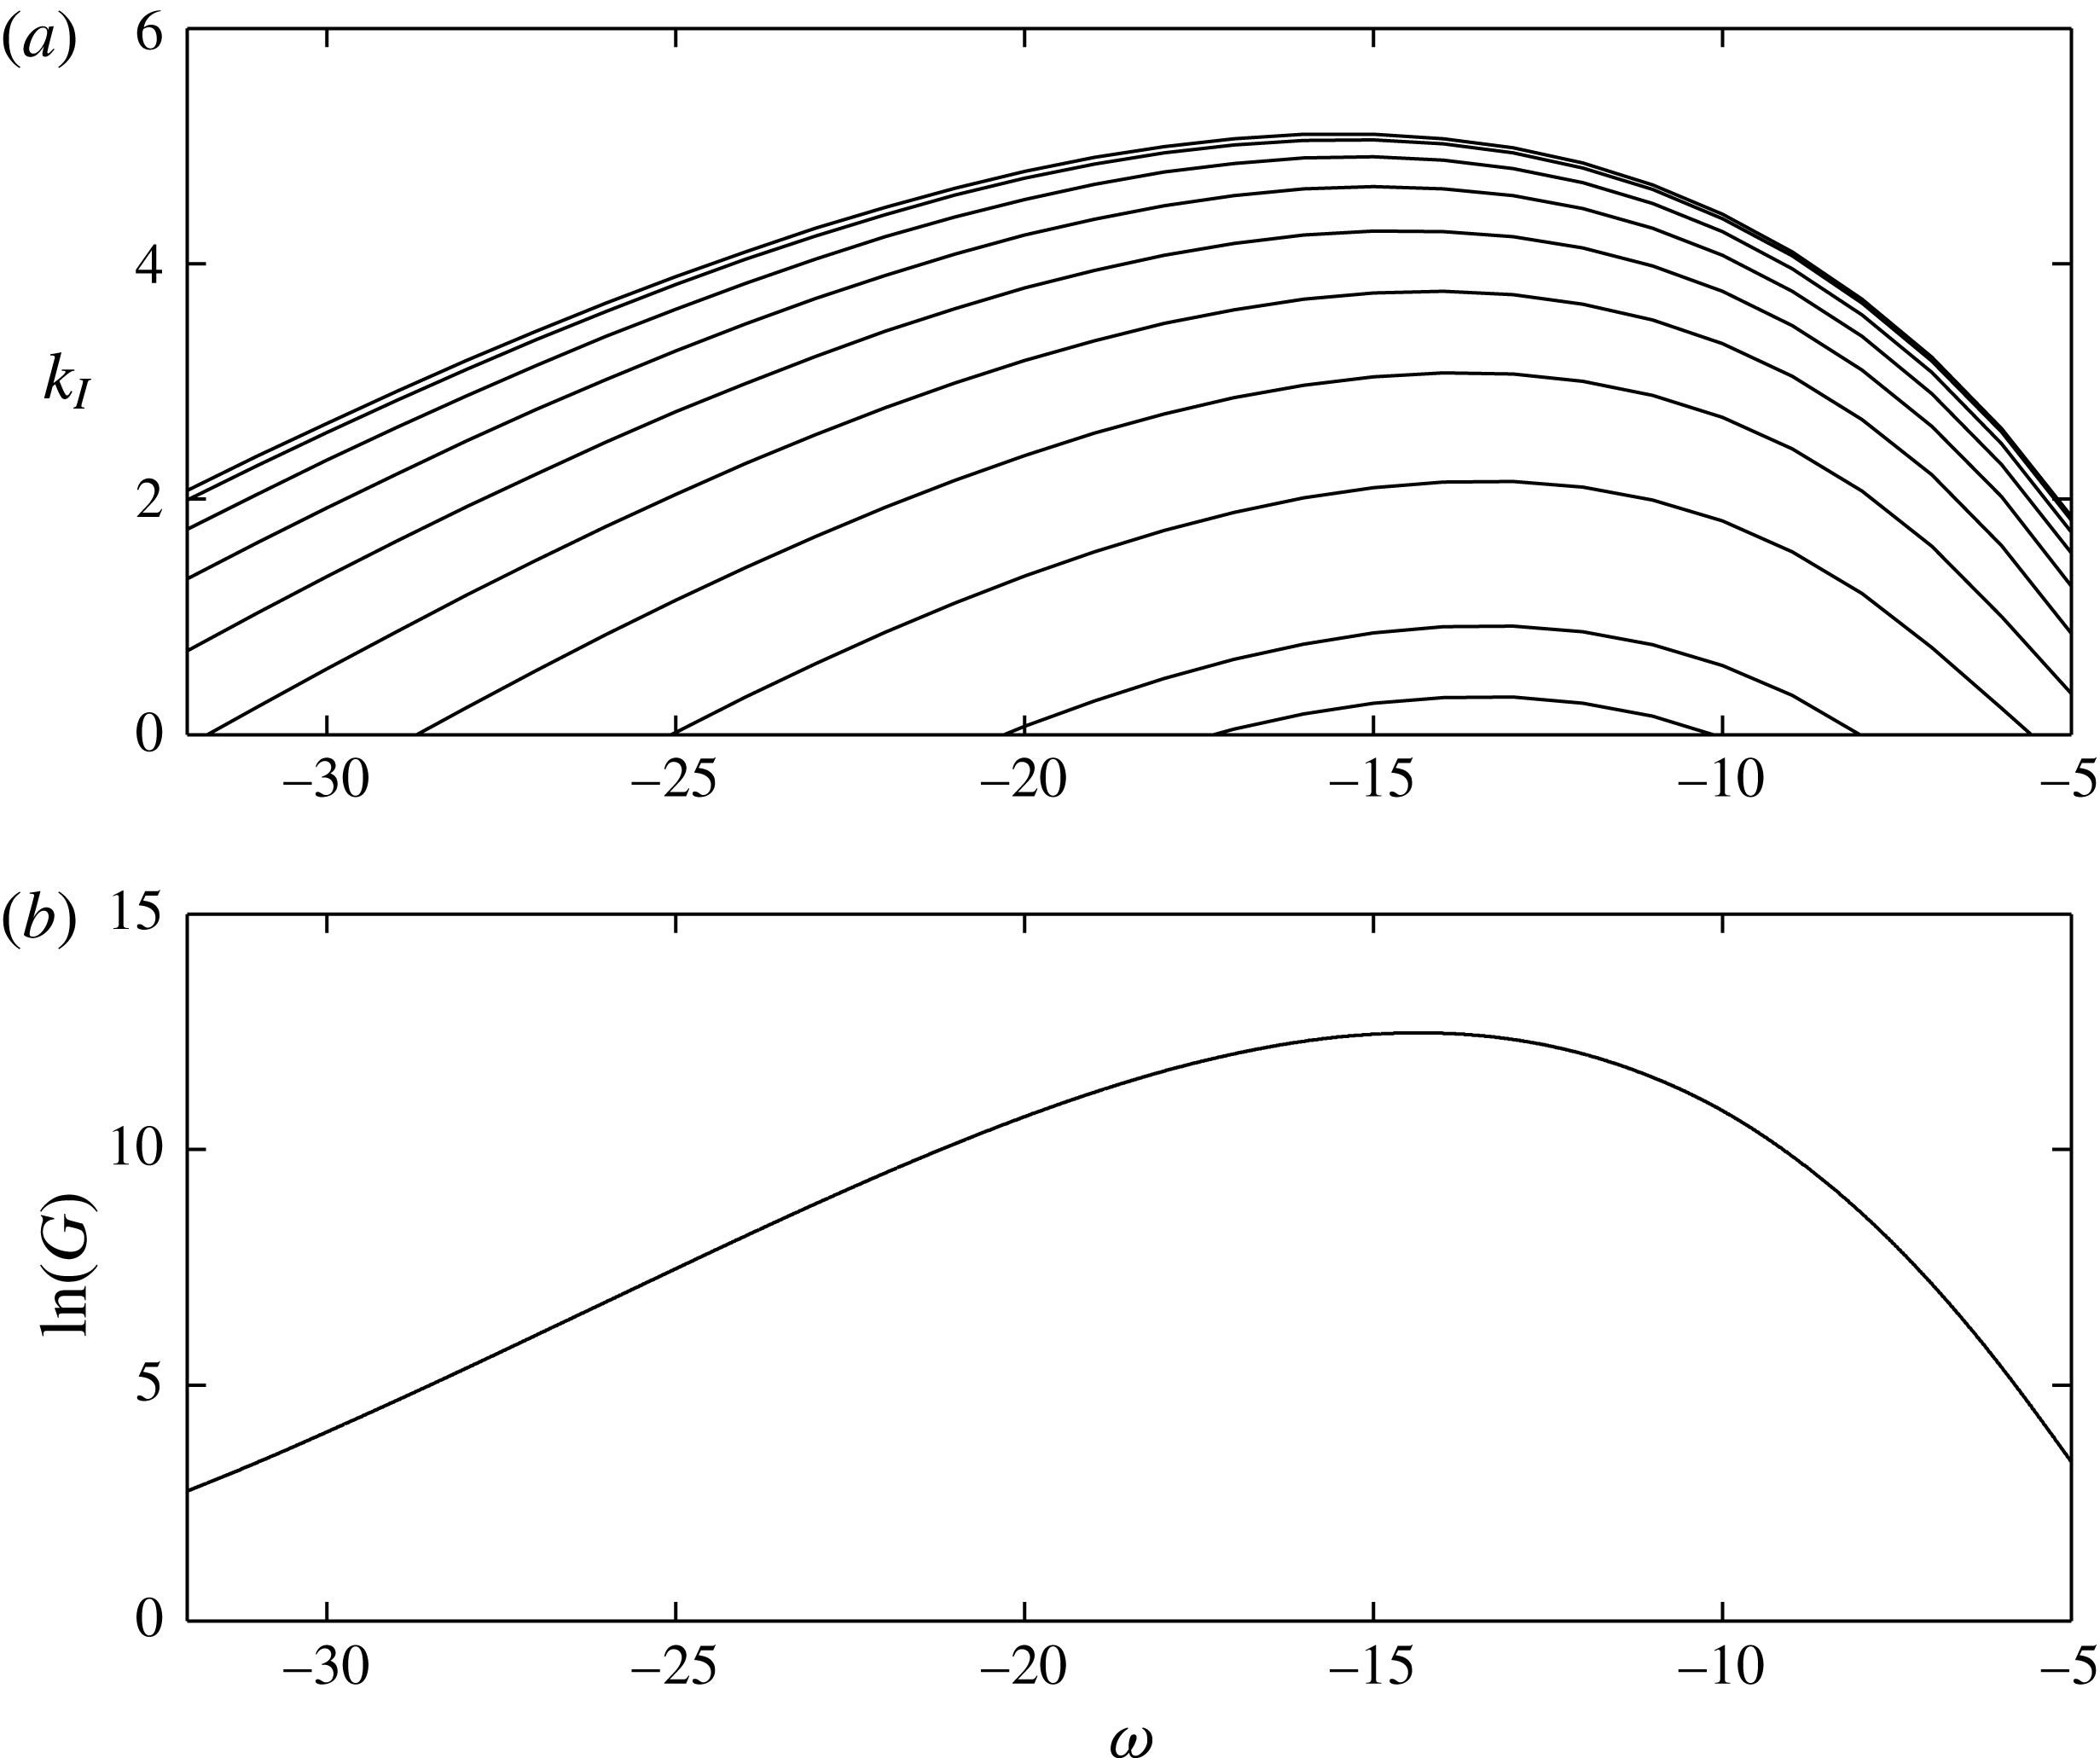
 $k_{i}(x;\unicode[STIX]{x1D714})$
(
 ${>}0$
for left-going disturbances) found from (4.2) with profiles at
 $|x|=[0:0.1:0.8]$
for a range of
 $\unicode[STIX]{x1D714}$
is plotted in figure 10(a). For fixed
 $\unicode[STIX]{x1D714}$
, the growth rates increase smoothly as
 $|x|\rightarrow 0$
and the frequency of maximum growth rate,
 $\unicode[STIX]{x1D714}\approx -15$
, depends only weakly on
 $x$
.
(a) The spatial growth rate
 $k_{i}$
versus frequency
 $\unicode[STIX]{x1D714}$
from the solution of the Taylor–Goldstein equation (4.2) for the
 $c=0.4810$
DJL wave. The curves are shown at
 $|x|=[0:0.1:0.8]$
from top to bottom. (b) The total gain
 $G$
versus
 $\unicode[STIX]{x1D714}$
of an unstable perturbation moving through the
 $Ri<0.25$
zone (
 $L_{Ri}=0.846$
) from (4.6) using
 $k_{i}(x;\unicode[STIX]{x1D714})$
in (a).

4.2 WKB approximation to transient growth
The local stability properties are linked to the spatio-temporal growth of the perturbation by integrating
 $k_{i}(x;\unicode[STIX]{x1D714})$
from
 $x=L_{Ri}$
to
 $x=-L_{Ri}$
. The evolution of the amplitude
 $A(x,t)$
of a small-amplitude perturbation is therefore given by
 $$\begin{eqnarray}A(x,t)\sim A(L_{Ri})\exp \left(\text{i}\int _{L_{Ri}}^{x}(k^{-}(x^{\prime };\unicode[STIX]{x1D714})-\unicode[STIX]{x1D714}t)\,\text{d}x^{\prime }\right),\end{eqnarray}$$
where
 $k^{-}$
indicates the waves that grow while propagating to the left (
 $k_{i}>0$
) and
 $A(L_{Ri})$
is the amplitude at the onset of the region
 $Ri<1/4$
. The spatial growth of a perturbation with fixed
 $\unicode[STIX]{x1D714}$
is given by the real part of (4.3)
 $$\begin{eqnarray}\frac{A(x)}{A(L_{Ri})}\sim \exp \left(-\int _{L_{Ri}}^{x}k_{i}(x^{\prime };\unicode[STIX]{x1D714})\,\text{d}x^{\prime }\right).\end{eqnarray}$$
For these linear disturbances the corresponding energy gain is
 $$\begin{eqnarray}G(x;\unicode[STIX]{x1D714})=\left[\frac{A(x)}{A(L_{Ri})}\right]^{2},\end{eqnarray}$$
and the total gain after passage of the disturbance through the solitary wave is
 $$\begin{eqnarray}G(-L_{Ri};\unicode[STIX]{x1D714})=\left[\frac{A(-L_{Ri})}{A(L_{Ri})}\right]^{2}.\end{eqnarray}$$
The dependence of the total gain
 $G$
from (4.6) as a function of
 $\unicode[STIX]{x1D714}$
is plotted in figure 10(b) for the results in figure 10(a). The maximum gain
 $\ln (G_{MAX})=12.48$
occurs at
 $\unicode[STIX]{x1D714}_{MAX}=-14.74$
. Recall that Troy & Koseff (Reference Troy and Koseff2005) and Barad & Fringer (Reference Barad and Fringer2010) found observable instabilities required
 $\bar{\unicode[STIX]{x1D714}}_{I}T_{W}>5$
which gives
 $\ln (G)>10$
. Similarly, Lamb & Farmer (Reference Lamb and Farmer2011) found
 $2\bar{k}_{i}L_{Ri}>4$
, or
 $\ln (G)>8$
. Figure 10(b) shows that
 $\ln (G)>8$
occurs over a significant frequency range
 $-24<\unicode[STIX]{x1D714}<-7.5$
.
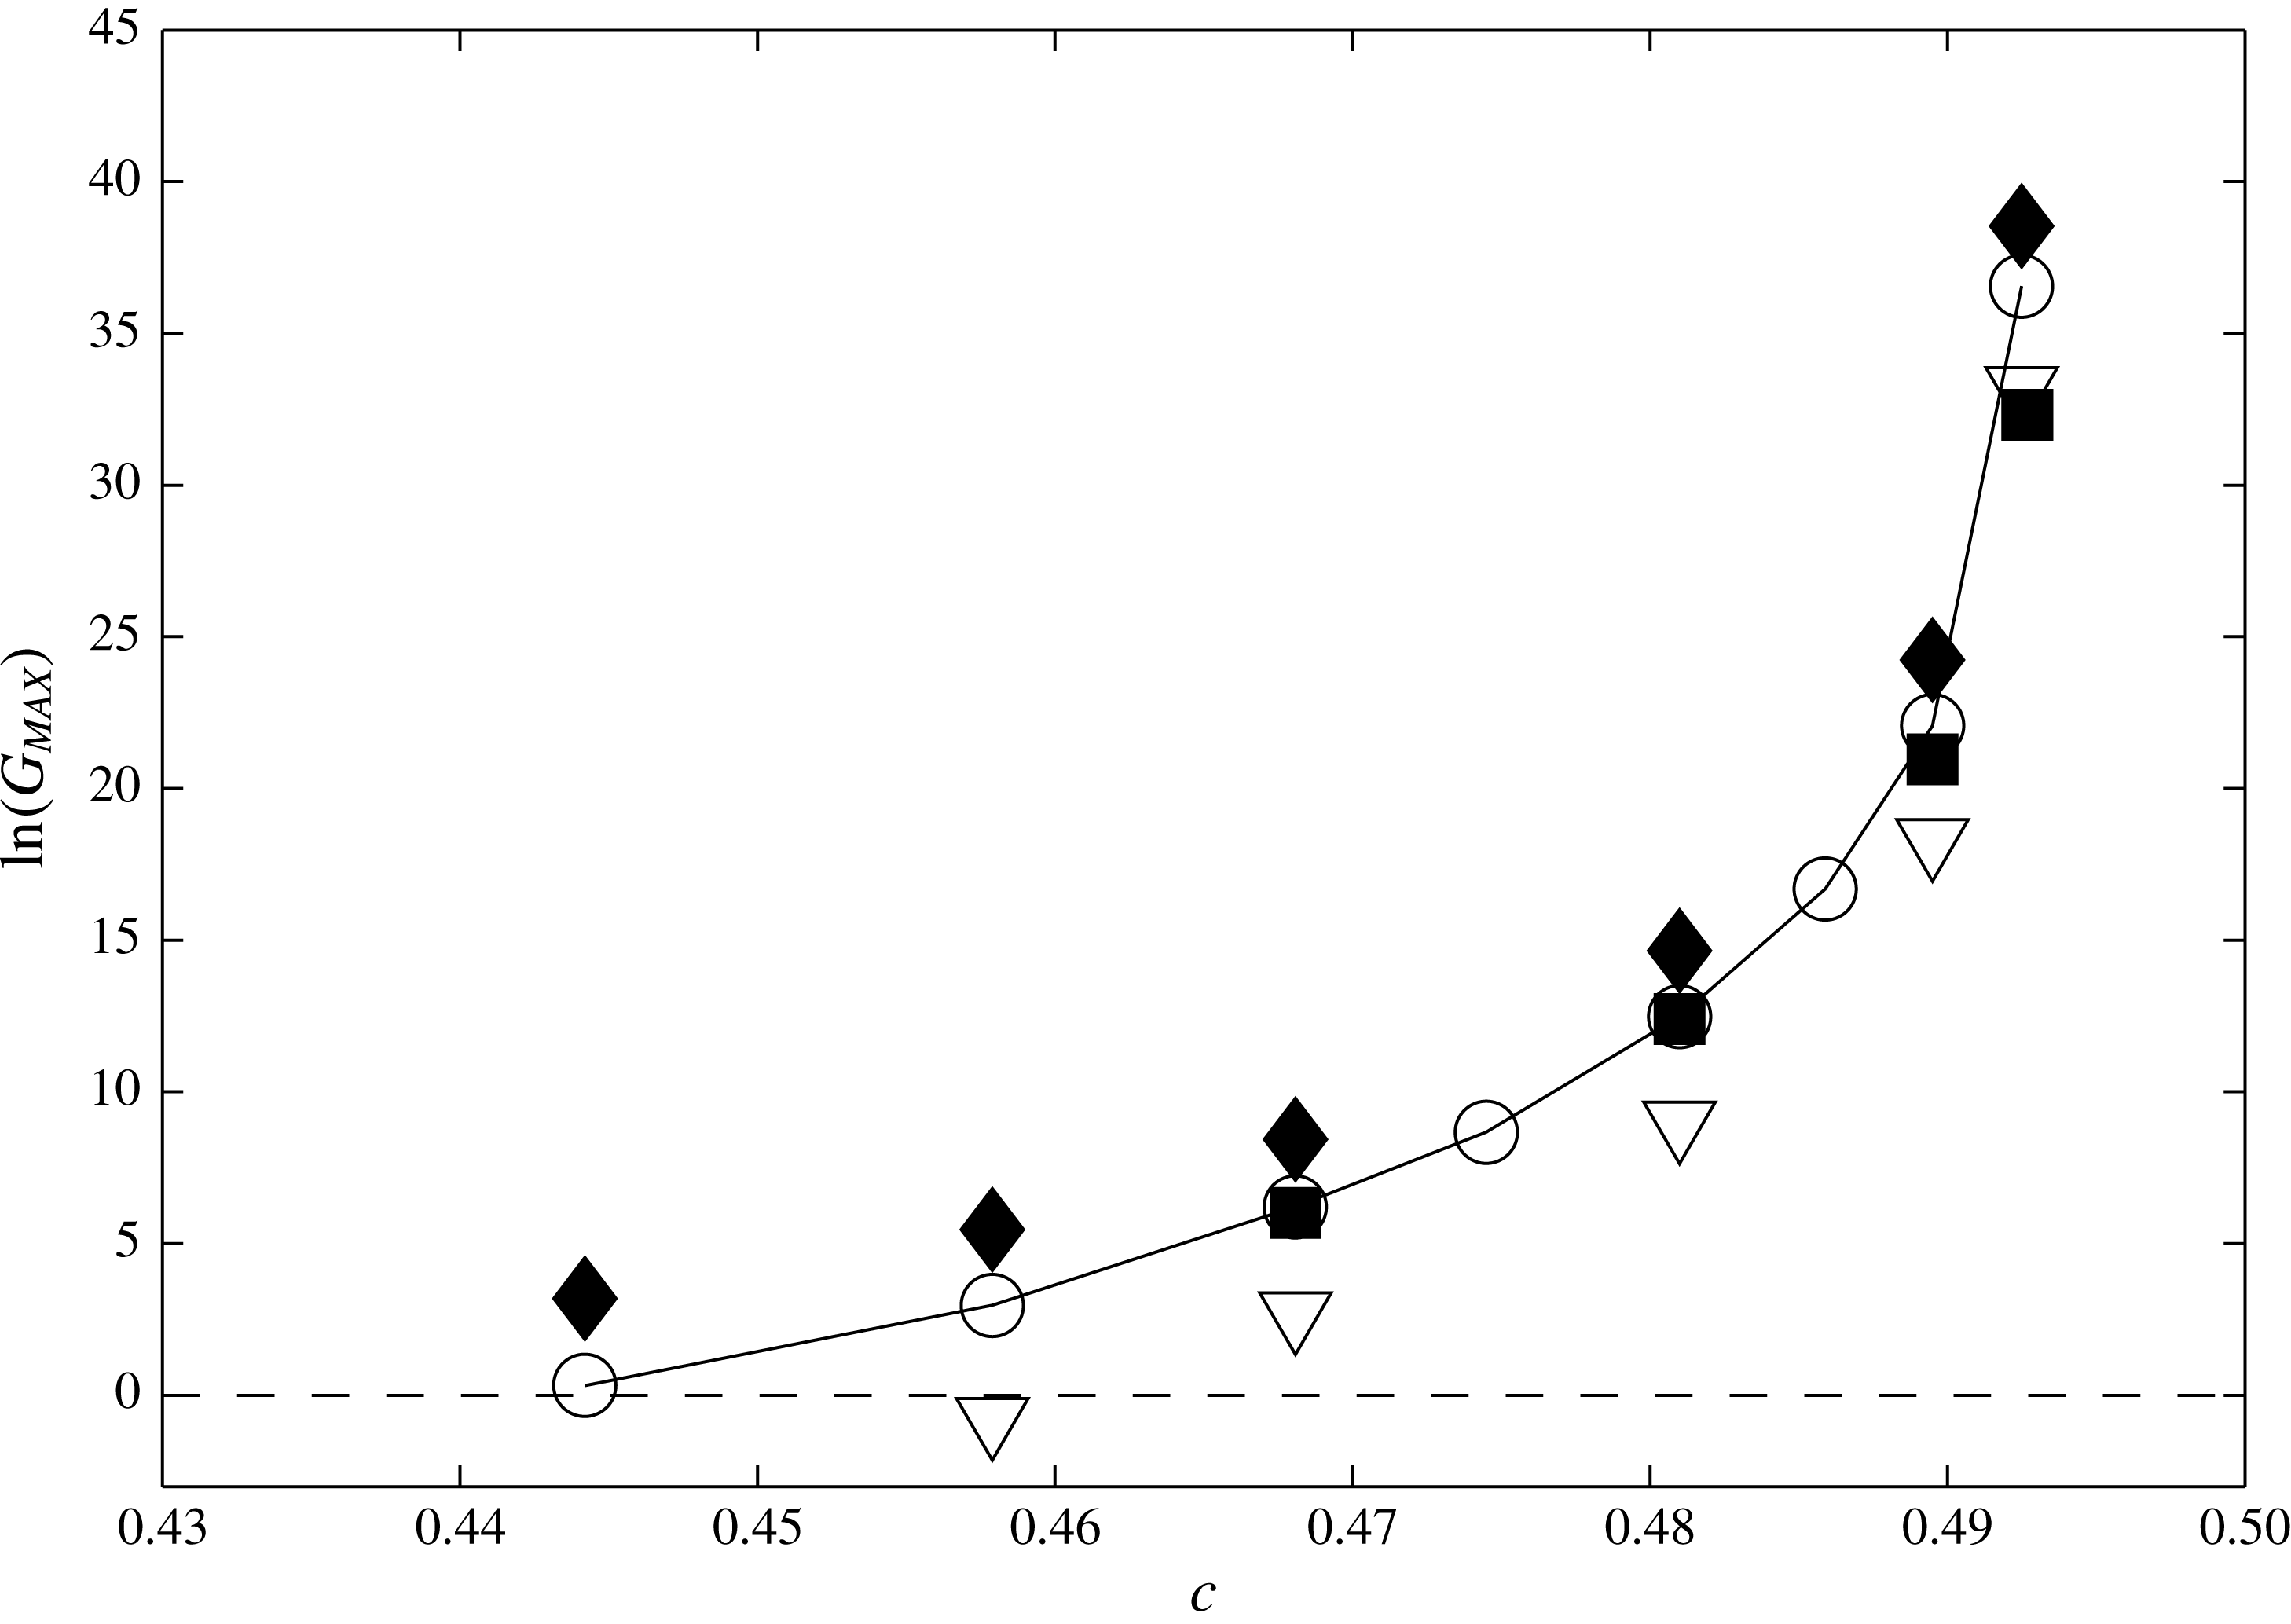
Figure 11 shows a comparison of
 $\ln (G_{MAX})$
as a function of the ISW phase speed
 $c$
for the optimal perturbations from the inviscid DJL waves, the viscously adjusted (
 $Re=10^{5}$
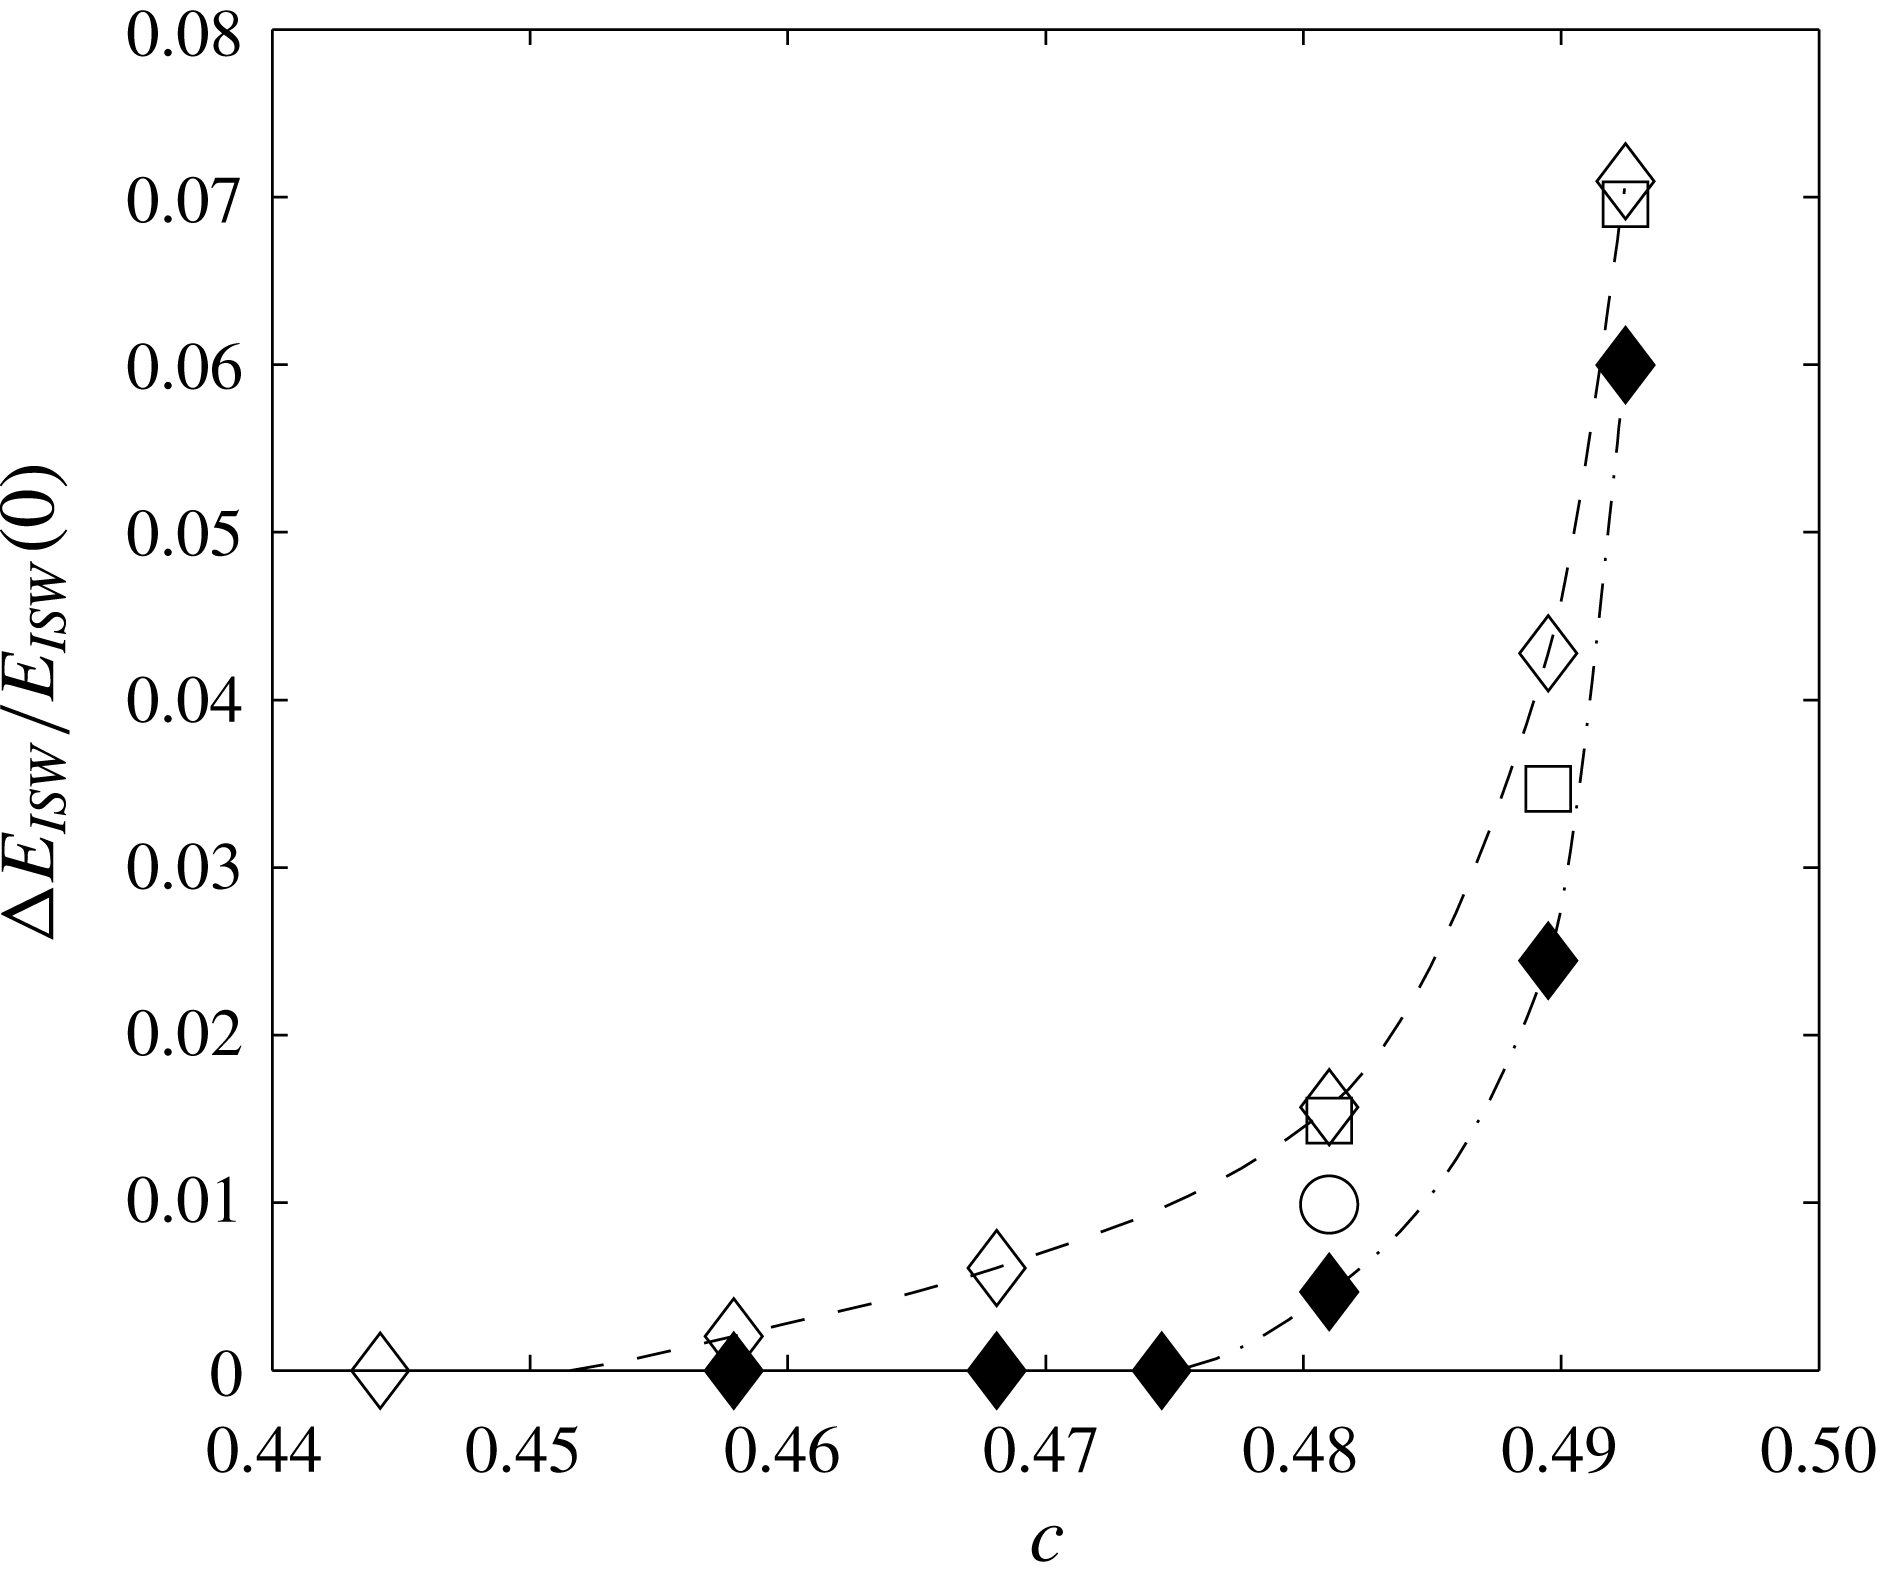
) DJL waves and the WKB analysis described above. The energy gain is always largest for the optimal perturbations on the inviscid DJL wave. Recall that both optimal disturbance calculations were based on
 $Re=10^{5}$
, while the WKB results are for inviscid disturbances. For purely inviscid flows the optimal disturbance growth would be even greater (cf. figure 5
a). The difference between the optimal DAL gain and the WKB estimate becomes more evident as
 $c$
, and therefore
 $L_{Ri}$
, decreases. However, the difference in
 $\ln (G_{MAX})$
is only weakly dependent on
 $c$
, decreasing from
 $2.9$
to
 $2.0$
between
 $c=0.4442$
and
 $0.4925$
.
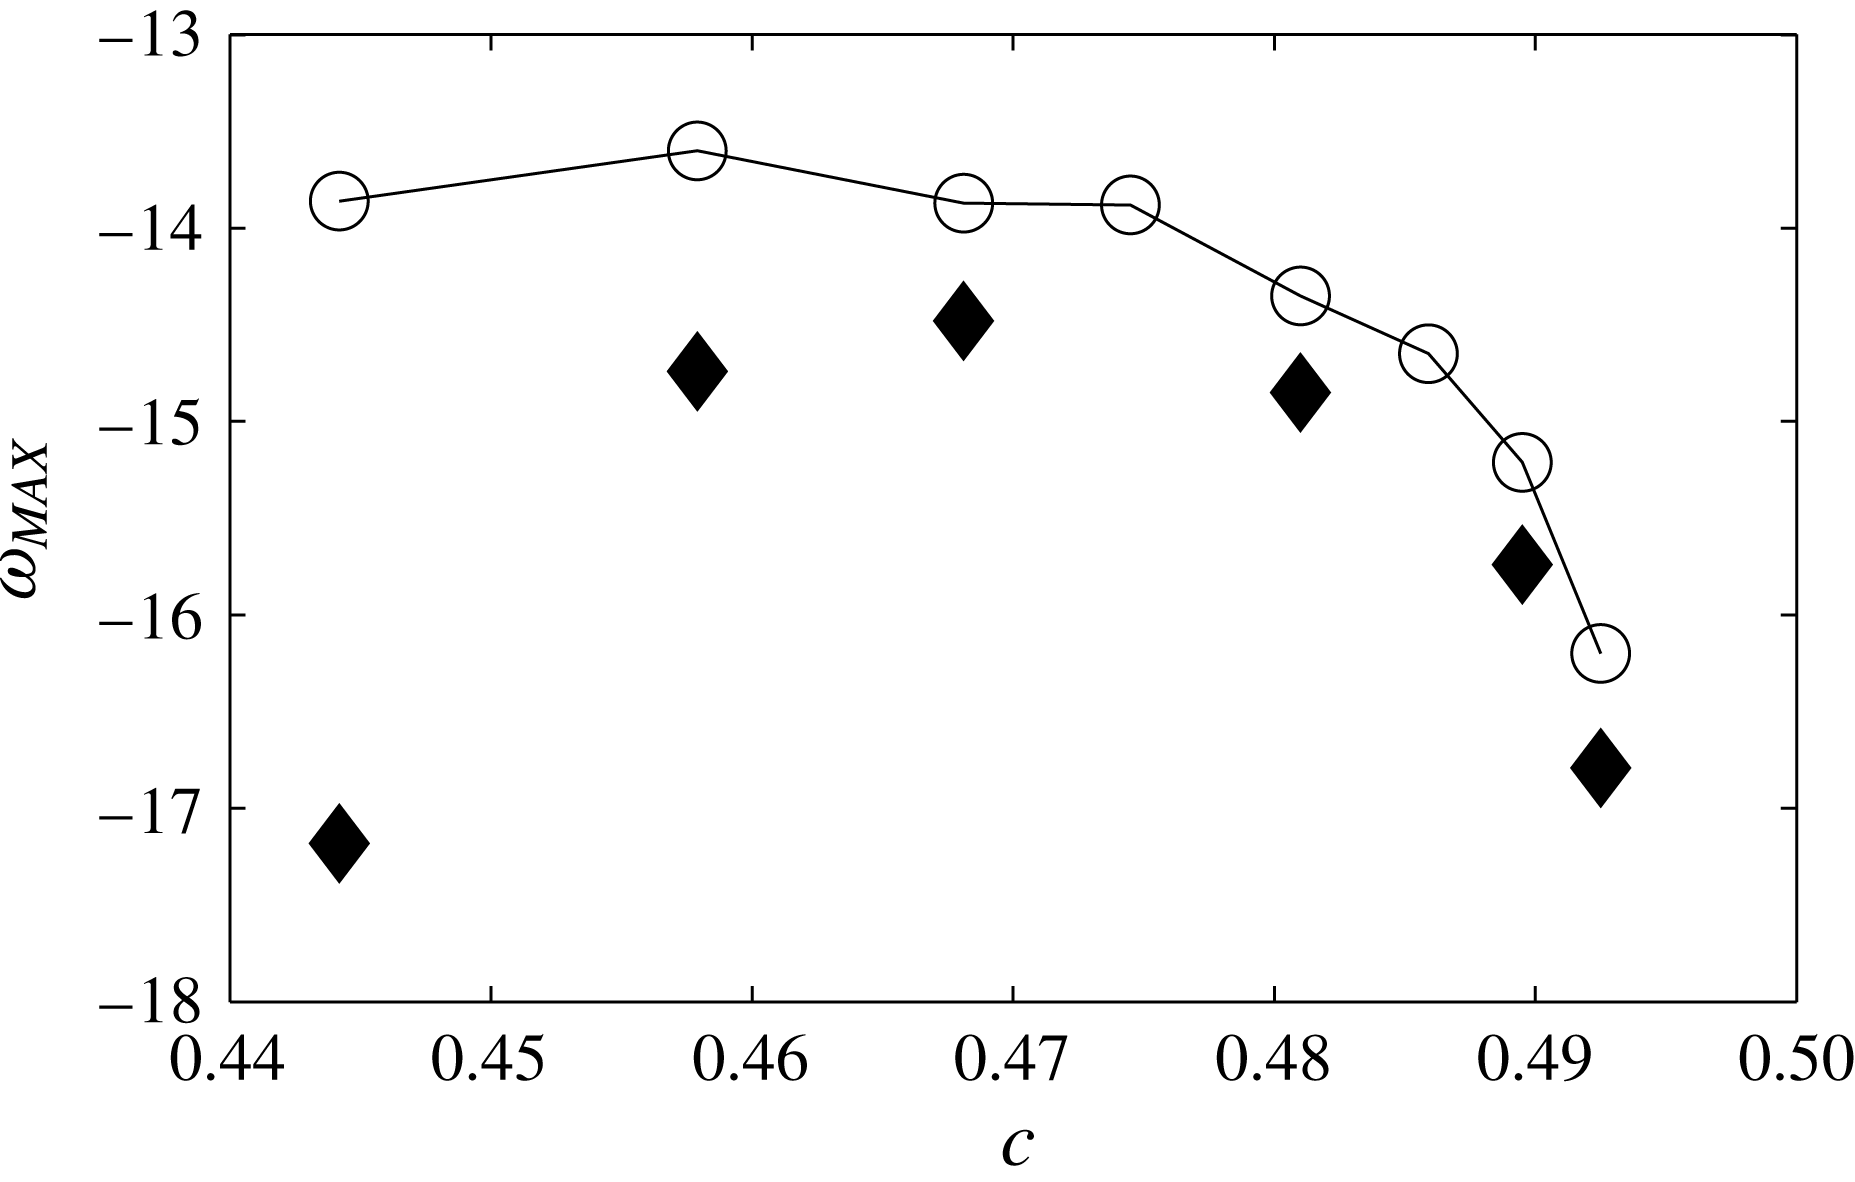
The frequencies for maximal WKB growth and the carrier frequencies of the optimal perturbations from the DAL calculation for the inviscid DJL waves are shown in figure 12. The agreement between the two approaches is similarly quite good, but does degrade as
 $c$
decreases, where the difference in
 $\ln (G_{MAX})$
is also greatest.
The maximum gain,
 $G_{MAX}$
, versus
 $c$
. The solid diamonds (solid squares) are for the DAL optimal perturbations to the inviscid (
 $Re=10^{5}$
adjusted) DJL wave base state. The circles are the maximal gains from the spatial WKB analysis. The triangles are for the
 $k_{+}$
free wave packets with carrier frequencies equal to those of the optimal disturbances (see § 5).

The frequency for maximum gain,
 $\unicode[STIX]{x1D714}_{MAX}$
, from the DAL optimal disturbances (solid diamonds) and the spatial WKB analysis (circles) versus
 $c$
.

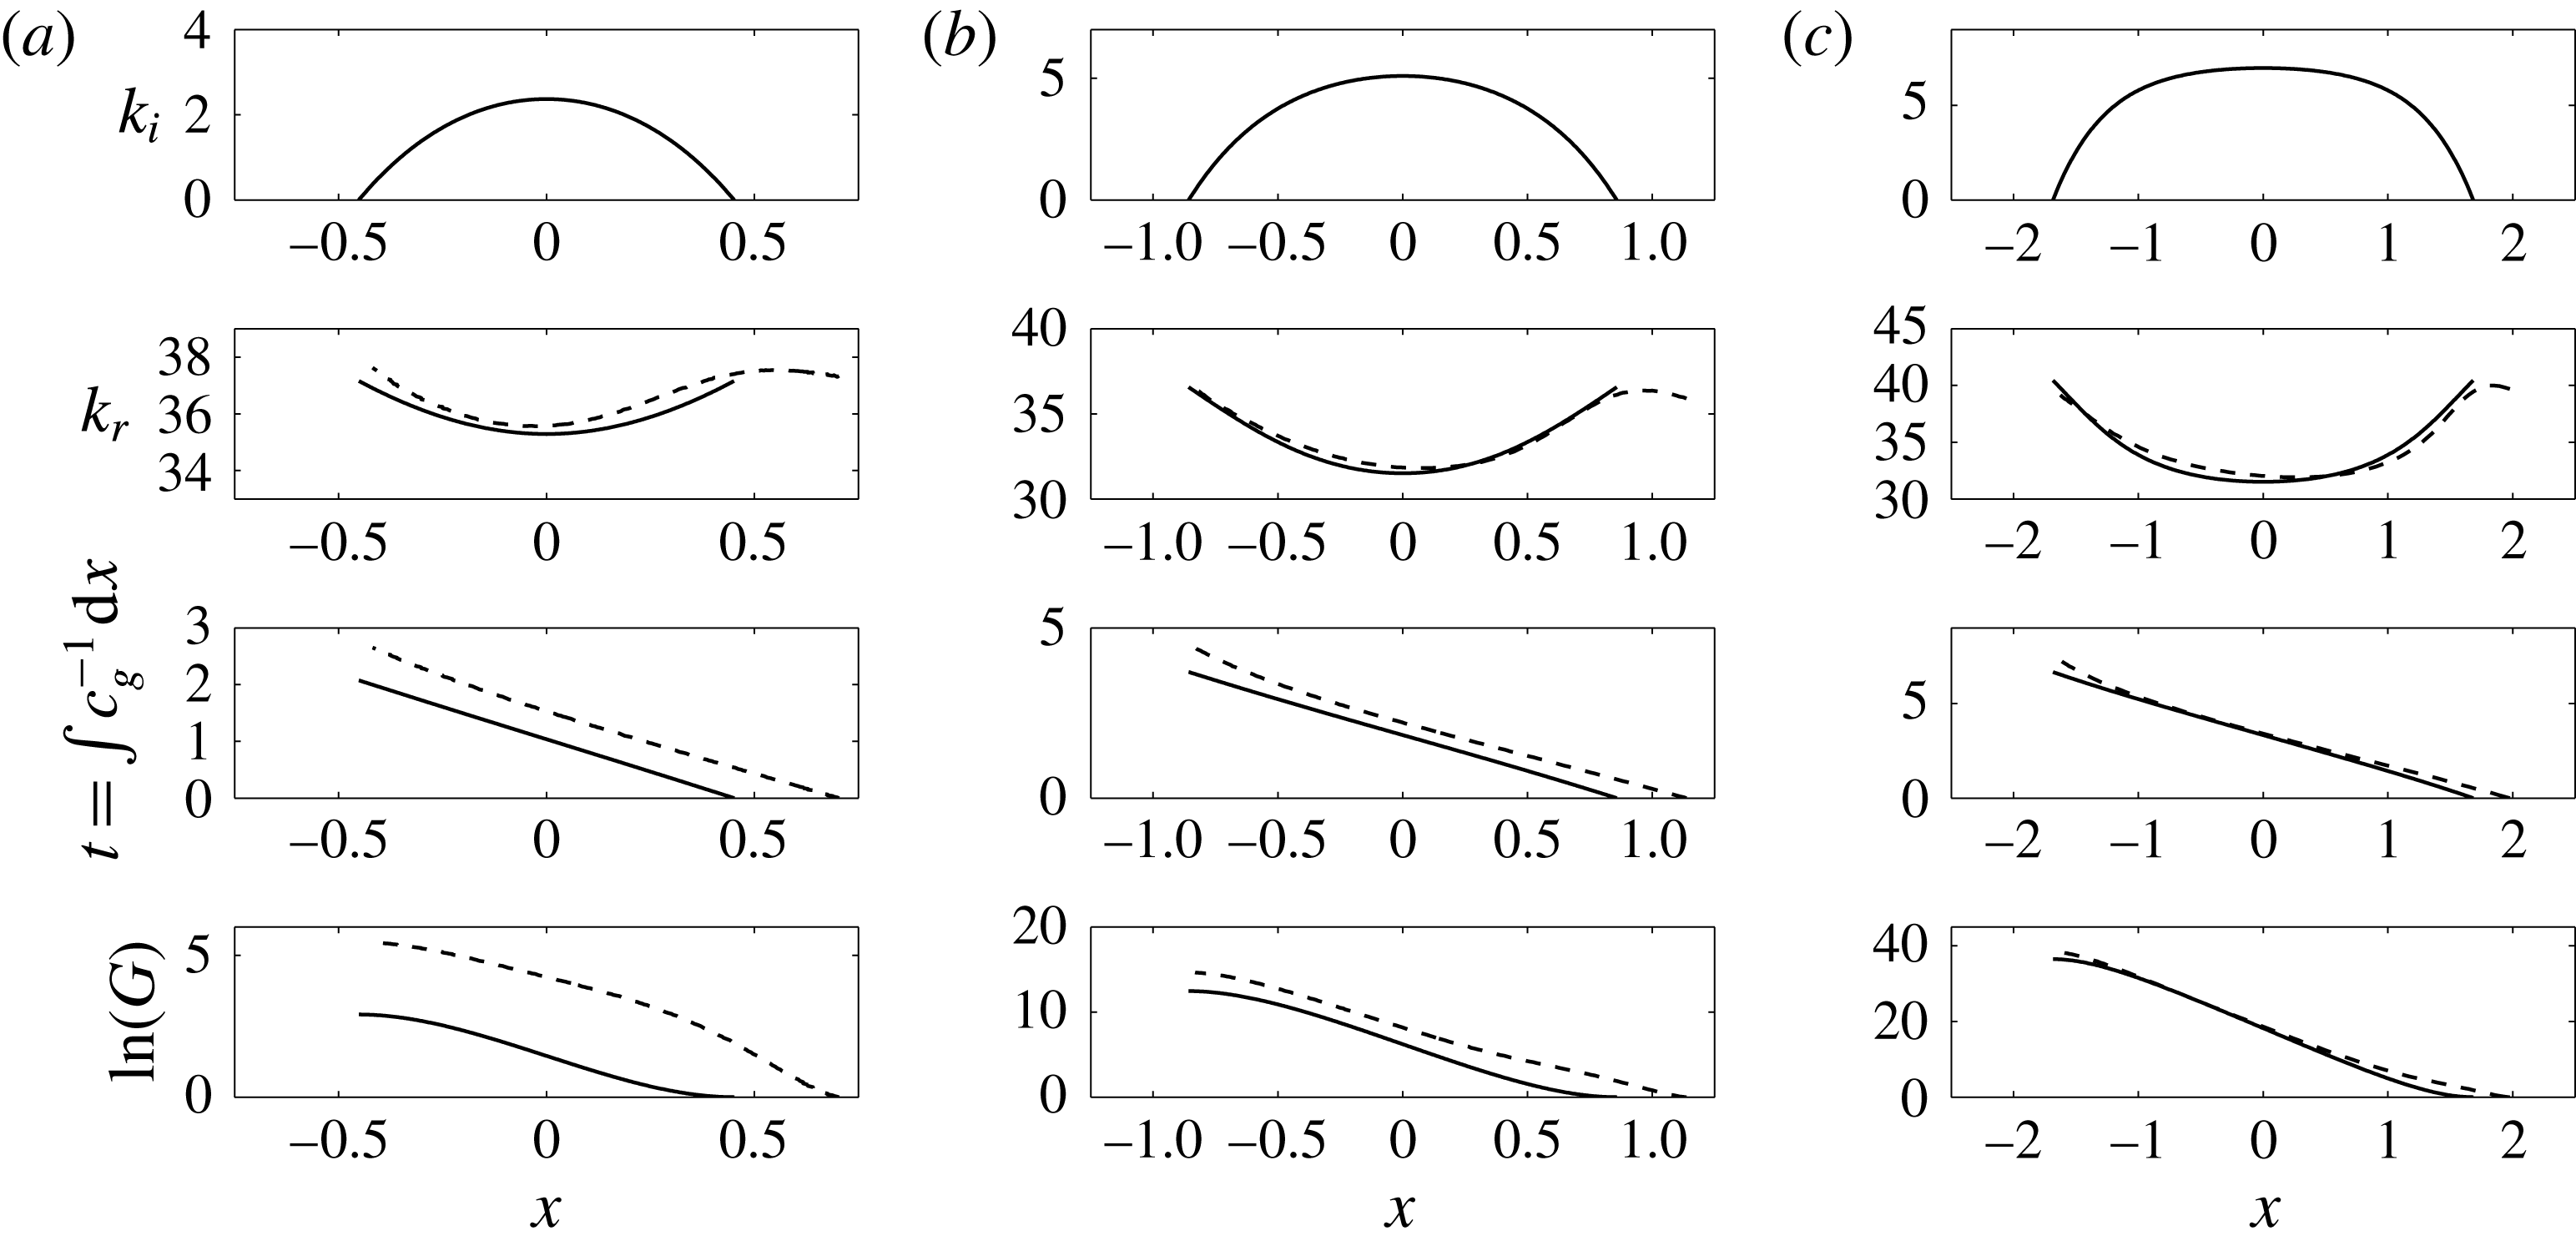
 $k_{i}$
,
 $k_{r}$
,
 $t=\int c_{g}^{-1}\,\text{d}x$
and
 $G$
versus
 $x$
through the
 $Ri<0.25$
zones for inviscid DJL waves with (a)
 $c=0.4579$
, (b)
 $c=0.4810$
and (c)
 $c=0.4925$
. The WKB results (solid) are computed for
 $\unicode[STIX]{x1D714}=-14.74$
,
 $-14.85$
and
 $-16.79$
, respectively, the carrier frequencies of the optimal transient growth wave packets (see figure 12). The dashed curves show the corresponding characteristics from forward linear integrations of the optimal transient growth disturbances with
 $Re=10^{5}$
.

A detailed comparison between the disturbance properties through the unstable zone from the linear optimal perturbations, from the DAL method and those from the WKB approach is given in figure 13. The dashed lines in the lower three panels of each column give the wavenumber in the centre of the packet,
 $k_{r}(x)$
, the packet envelop peak position,
 $x(t)$
(or
 $t(x)$
) and the energy gain,
 $G(x)$
. These were obtained from the forward linear calculations initiated with the optimal DAL disturbances for
 $c=0.4579$
,
 $c=0.4810$
and
 $c=0.4925$
. As discussed earlier, both
 $k_{r}(x)$
and
 $x(t)$
were found using Hilbert transforms in
 $x$
of disturbance
 $\unicode[STIX]{x1D713}(x,t)$
on the
 $S=0.5$
isopycnal (see figure 8). The solid lines show
 $k_{i}(x)$
,
 $k_{r}(x)$
, the disturbance
 $x-t$
relation,
 $$\begin{eqnarray}t(x)=\int _{L_{Ri}}^{x}c_{g}^{-1}(s)\,\text{d}s\quad \text{with }c_{g}(x)=\frac{\unicode[STIX]{x2202}\unicode[STIX]{x1D714}}{\unicode[STIX]{x2202}k_{r}}(x),\end{eqnarray}$$
and
 $G(x)$
from the WKB approach. The frequency of the optimal perturbations from the DAL analysis (figure 12) were used in the WKB calculations. The agreement between the central (real) wavenumbers
 $k_{r}(x)$
is quite good as is the agreement between the WKB group speed
 $c_{g}(x)$
(the slopes of the optimal disturbance trajectories
 $x(t)$
). The differences in the energy growth
 $G(x)$
curves are due almost entirely to an initial growth phase in
 $x>L_{Ri}$
for the optimal disturbance and accounts for the difference in
 $G_{MAX}$
in figure 11. The difference in
 $\ln (G_{MAX})$
is largely independent of the DJL wave speed
 $c$
, only varying from
 $2.9$
to
 $2$
between
 $c=0.4442$
and
 $0.4925$
. Since vertical shear is present for
 $x>L_{Ri}$
where
 $Ri>1/4$
, the inviscid Orr mechanism (Orr Reference Orr1907) may be responsible for this initial transient growth and is addressed next.
4.3 Non-modal transient growth
As mentioned above, the WKB analysis does not account for the non-normality associated with the Taylor–Goldstein operator (4.2). In regions where
 $Ri>1/4$
, shear can still play a destabilizing role. In his original work, Orr (Reference Orr1907) showed that in the case of a simple inviscid parallel shear flow, perturbations with a non-zero streamwise wavenumber
 $k$
could produce transient growth through the kinematic deformation of the perturbation vorticity by the base flow advection and shear. Later, Farrell & Ioannou (Reference Farrell and Ioannou1993a
) derived an analytic solution for the Orr temporal growth rate,
 $$\begin{eqnarray}\unicode[STIX]{x1D70E}_{Orr}=\frac{1}{2\tilde{T}}\text{ ln}\left[1+\frac{U_{c}^{\prime 2}\tilde{T}^{2}}{2}+U_{c}^{\prime }\tilde{T}\sqrt{\left(\frac{U_{c}^{\prime }\tilde{T}}{2}\right)^{2}+1}\right],\end{eqnarray}$$
for two-dimensional perturbations in a constant, unstratified linear shear
 $U_{c}^{\prime }$
over the optimization time
 $\tilde{T}$
. Perturbations with small values of
 $k$
will need more time to accomplish the Orr-induced rotation than perturbations with large values of
 $k$
. Hence the optimization time
 $\tilde{T}$
in (4.8) is rescaled to take into account this such effect and it is linked to the optimization time
 $T$
through the transformation
 $T=2\unicode[STIX]{x03C0}c\tilde{T}/k$
. Farrell & Ioannou (Reference Farrell and Ioannou1993b
) also derived an approximation for the Orr gain in the case of an unbounded stratified shear flow where both the shear and the stratification are linear, but in the large
 $Ri$
limit. Note that in these idealized cases,
 $\unicode[STIX]{x1D70E}_{Orr}$
is independent of the streamwise wavenumber
 $k$
.
In the following we examine the possibilities for Orr-type transient growth in regions of the flow just upstream of the
 $Ri<0.25$
zone using the Taylor–Goldstein equation (4.2) and maximizing the disturbance energy for short times
 $T$
. Therefore we are seeking a non-modal approach to the optimization problem for the gain
 $$\begin{eqnarray}G_{Orr}(T)=\max _{\tilde{\boldsymbol{q}}_{0}\neq 0}\frac{\Vert \tilde{\boldsymbol{q}}(T)\Vert ^{2}}{\Vert \tilde{\boldsymbol{q}}_{0}\Vert ^{2}},\end{eqnarray}$$
with
 $\tilde{\boldsymbol{q}}=[\unicode[STIX]{x1D713},s^{\prime }]$
. The energy norm
 $\Vert \cdot \Vert ^{2}$
is defined equivalently to (3.4) which in matrix form is given by
 $\Vert \tilde{\boldsymbol{q}}(T)\Vert ^{2}=\tilde{\boldsymbol{q}}^{\text{T}}(T)\unicode[STIX]{x1D648}\tilde{\boldsymbol{q}}(T)$
where
 $\unicode[STIX]{x1D648}$
is the matrix containing the weights of integration. Such a problem can be solved considering the initial value problem associated with the parallel flow Taylor–Goldstein equation (4.2) using the local buoyancy and velocity profiles. In streamfunction/density perturbation formulation (4.2) becomes
 $$\begin{eqnarray}\displaystyle & \displaystyle [(\unicode[STIX]{x2202}_{t}+\text{i}kU)\unicode[STIX]{x1D6FB}^{2}-\text{i}kU^{\prime \prime }]\unicode[STIX]{x1D713}=-\text{i}ks^{\prime }, & \displaystyle\end{eqnarray}$$
 $$\begin{eqnarray}\displaystyle & \displaystyle [\unicode[STIX]{x2202}_{t}+\text{i}kU]s^{\prime }=\text{i}kS^{\prime }\unicode[STIX]{x1D713}. & \displaystyle\end{eqnarray}$$
 $$\begin{eqnarray}\boldsymbol{A}\unicode[STIX]{x2202}_{t}\tilde{\boldsymbol{q}}=\boldsymbol{L}\tilde{\boldsymbol{q}},\end{eqnarray}$$
the initial value problem becomes
 $$\begin{eqnarray}\tilde{\boldsymbol{q}}(t)=\text{e}^{\boldsymbol{A}^{-1}\boldsymbol{ L}t}\tilde{\boldsymbol{q}}_{0},\end{eqnarray}$$
where the initial condition
 $\tilde{\boldsymbol{q}}_{0}=[\unicode[STIX]{x1D713}_{0},s_{0}]$
is to be optimized to maximize (4.9) at a given time
 $T$
. The system (4.12) can be solved efficiently by performing a singular value decomposition (Schmid & Henningson Reference Schmid and Henningson2001). The system (4.10) is first recast into a generalized eigenvalue problem of the form
 $$\begin{eqnarray}-\text{i}\unicode[STIX]{x1D726}\boldsymbol{A}\unicode[STIX]{x1D63E}=\boldsymbol{L}\unicode[STIX]{x1D63E},\end{eqnarray}$$
where the matrices
 $\unicode[STIX]{x1D726}$
and
 $\unicode[STIX]{x1D63E}$
contain the eigenvalues and eigenvectors, respectively. The energy norm
 $\Vert \cdot \Vert ^{2}$
is then converted to the
 $L_{2}$
-norm (Euclidian norm)
 $(\cdot )_{2}^{2}$
through the transformation
 $\Vert \unicode[STIX]{x1D63E}\Vert ^{2}=\unicode[STIX]{x1D63E}^{H}\unicode[STIX]{x1D648}\unicode[STIX]{x1D63E}=\boldsymbol{F}^{H}\boldsymbol{F}=(\boldsymbol{F})_{2}^{2}$
, where
 $\boldsymbol{F}^{H}$
denotes the Hermitian conjugate of
 $\boldsymbol{F}$
. The optimal Orr gain is finally given by
 $$\begin{eqnarray}G_{Orr}(t)=(\boldsymbol{F}\text{e}^{-\text{i}t\unicode[STIX]{x1D726}}\boldsymbol{F}^{-1})_{2}^{2}=\unicode[STIX]{x1D70E}_{1}^{2}(\boldsymbol{F}\text{e}^{-\text{i}t\unicode[STIX]{x1D726}}\boldsymbol{F}^{-1}),\end{eqnarray}$$
where
 $\unicode[STIX]{x1D70E}_{1}$
is the first singular value.
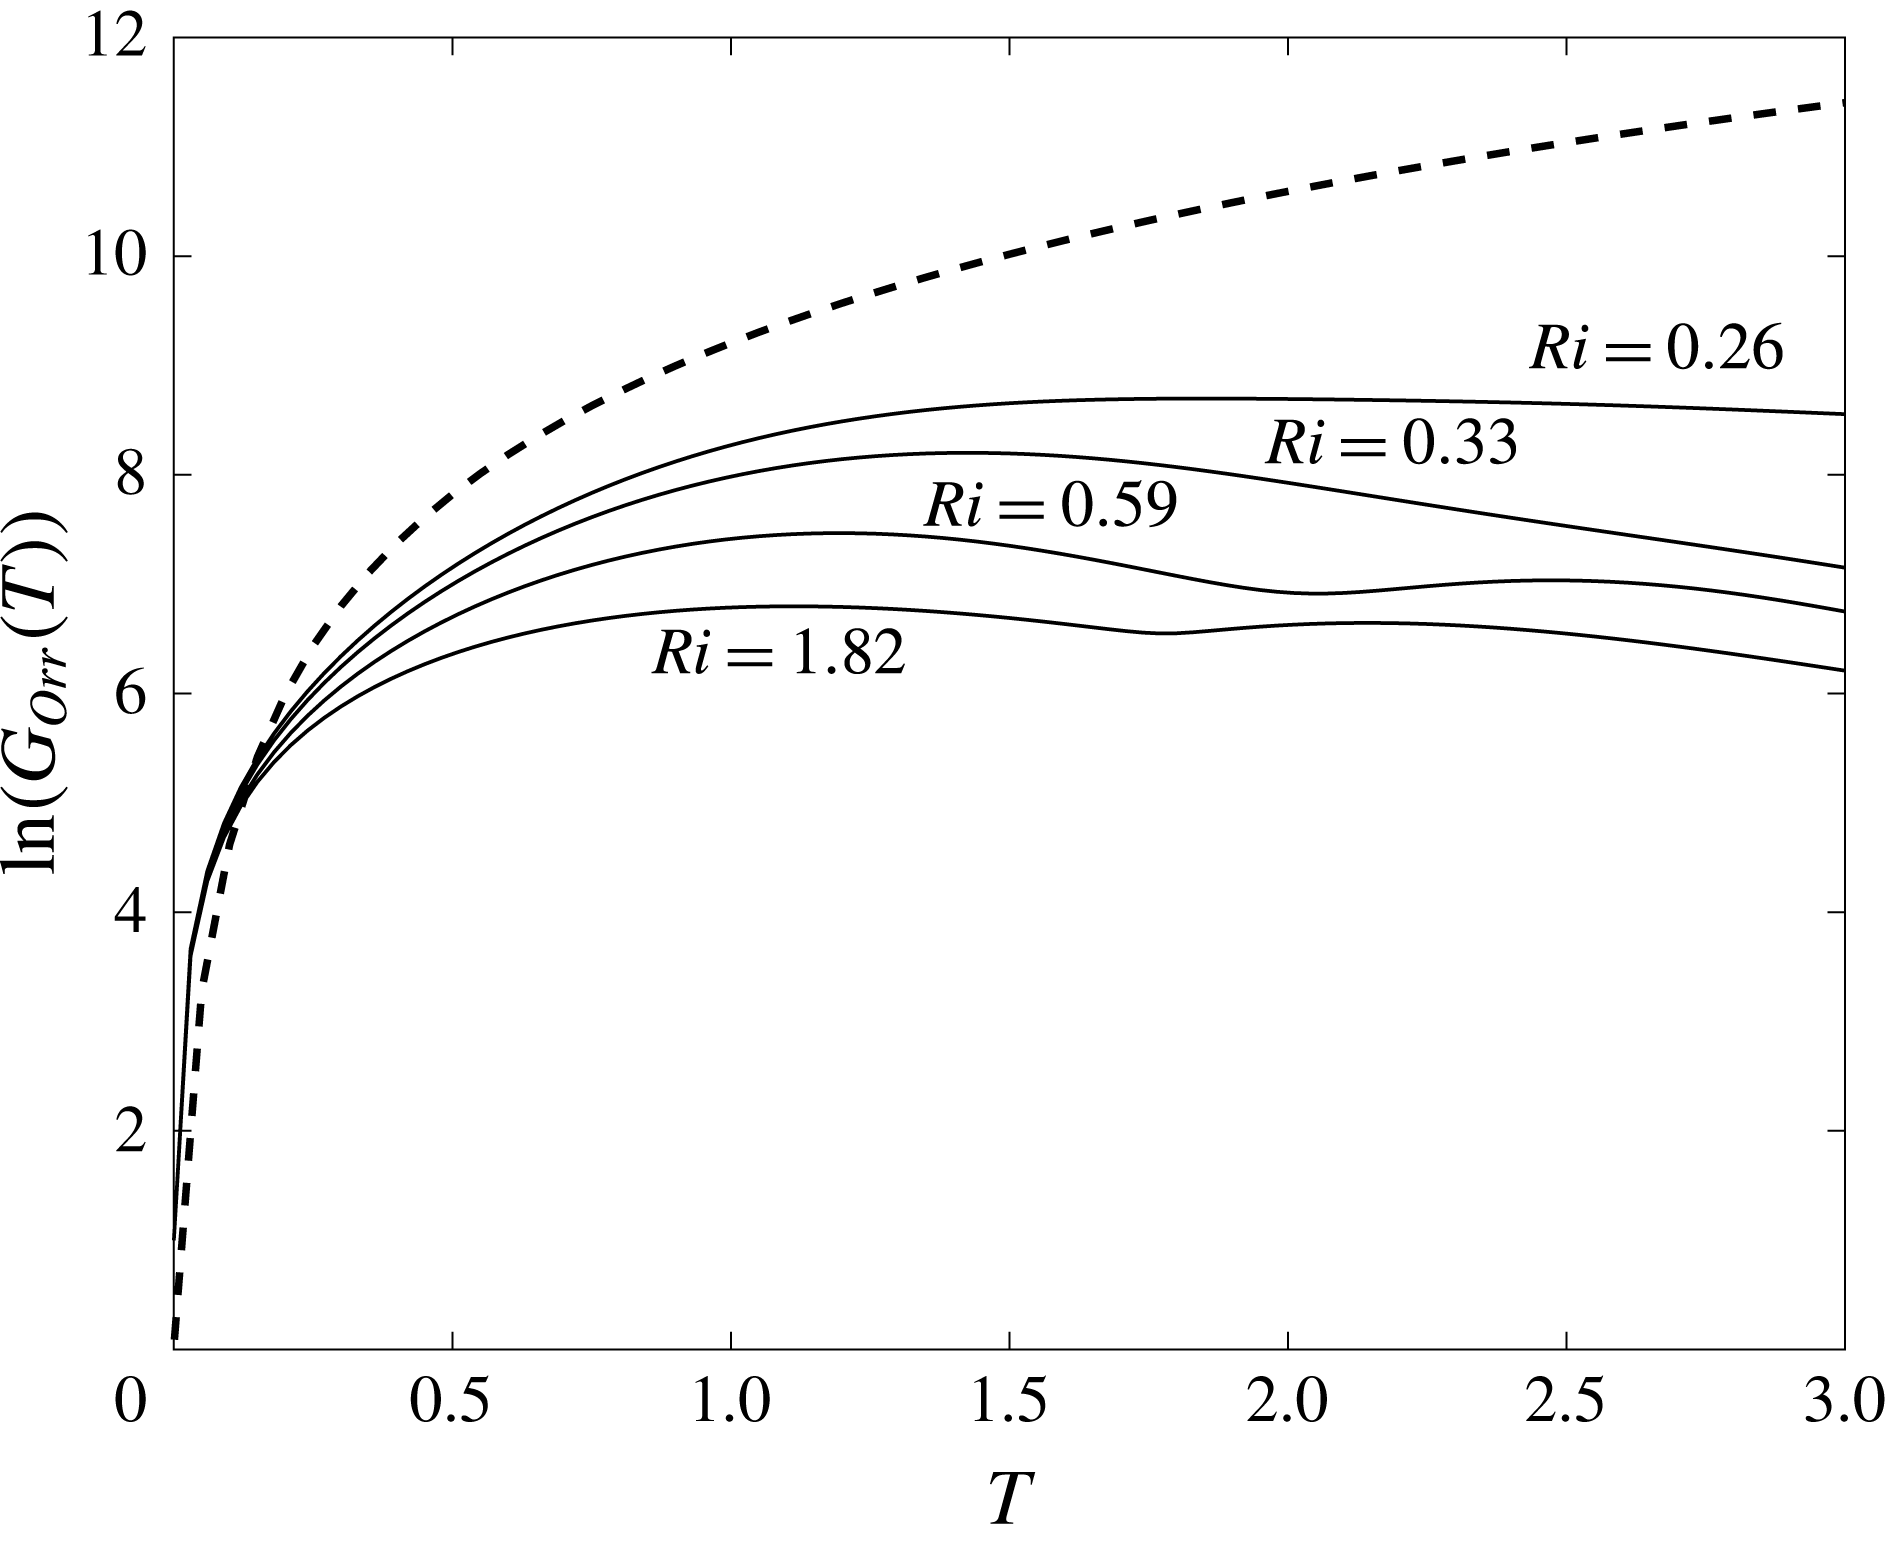
The maximum gain of the Orr mechanism,
 $\ln (G_{Orr})$
, versus the optimization time
 $T$
. The solid lines are the optimal transient growth using the Taylor–Goldstein equation (4.2) for the stable profiles at
 $x=[0.88,0.96,1.12,1.36]$
(
 $Ri_{min}=[0.26,0.33,0.59,1.82]$
) for the inviscid DJL wave at
 $c=0.4810$
. The dashed line is the prediction for homogeneous shear from (4.8) with
 $U_{c}^{\prime }=7.5$
(i.e. the maximum shear for
 $Ri_{min}=0.26$
).

As shown in figures 11 and 13, the WKB approach differs by a shift in the energy gain
 $\ln (G)\approx 2{-}3$
over an initial advection time scale
 $t\approx 0.5$
. Using the
 $c=0.4810$
case as an example, the optimal gain (4.14) is computed for the ISW
 $U(z)$
and
 $S(z)$
profiles at
 $x=[0.88,1.12,1,24,1.36]$
which correspond to
 $Ri_{min}=[0.26,0.33,0.59,1.82]$
respectively. The results for
 $k=36.6$
, the average initial packet wavenumber, are shown in figure 14. The Orr mechanism contributes to the optimal gain
 $\ln (G)$
by amounts of
 $6{-}8.5$
and appears to be only weakly affected by changes in
 $Ri$
. The optimal time
 $T\approx 1$
is twice the time scale in figure 13. However the gain difference between
 $T=0.5$
and
 $T=1$
is minor, and for
 $T>0.5$
the K–H instability provides a faster growth than the Orr mechanism.
Also included in figure 14 is the gain,
 $\exp (2\unicode[STIX]{x1D70E}_{Orr}\tilde{T})$
, found using (4.8) with
 $U_{c}^{\prime }=7.5$
. This value is equal to the maximum shear at
 $x=0.88$
. Over times
 $T<1$
, this simple unstratified model provides a relatively good estimate for
 $\ln (G_{Orr})$
from (4.10) and (4.14) and shows that for small optimization times, stratification does not play a major role in the non-normal growth process (Farrell & Ioannou Reference Farrell and Ioannou1993b
). As expected for longer optimization times
 $T$
, the stratification damps transient growth.
5 Linear free wave disturbances
In the limit of linear dynamics the optimal disturbances found above pose the largest possible danger to the internal solitary waves. In the ocean random noise will project on these states so determining the upper bound for linear growth is important in order to provide bounds on the lifetime of ISWs, as discussed in the following section. ISWs are also subject to encounters with free linear waves propagating on the interface. Indeed disturbances of this sort have been the focus of previous investigations (Lamb & Farmer Reference Lamb and Farmer2011; Camassa & Viotti Reference Camassa and Viotti2012). Thus it is of interest to explore how these disturbances compare to the optimal perturbations. Additionally, the behaviour of these two types of disturbance provides insight into the connections between the optimal perturbation gain, the WKB analysis, the Orr mechanism and absorption of perturbation energy by the ISW (Camassa & Viotti Reference Camassa and Viotti2012).
The characteristics of free linear waves,
 $\unicode[STIX]{x1D713}=\hat{\unicode[STIX]{x1D713}}(z)\exp [\text{i}(kx-\unicode[STIX]{x1D714}t)]$
(for real
 $\unicode[STIX]{x1D714}$
and
 $k$
), are determined from (4.2) for the undisturbed upstream stratification
 $\bar{S}(z)$
from (2.7) and no background flow
 $U=0$
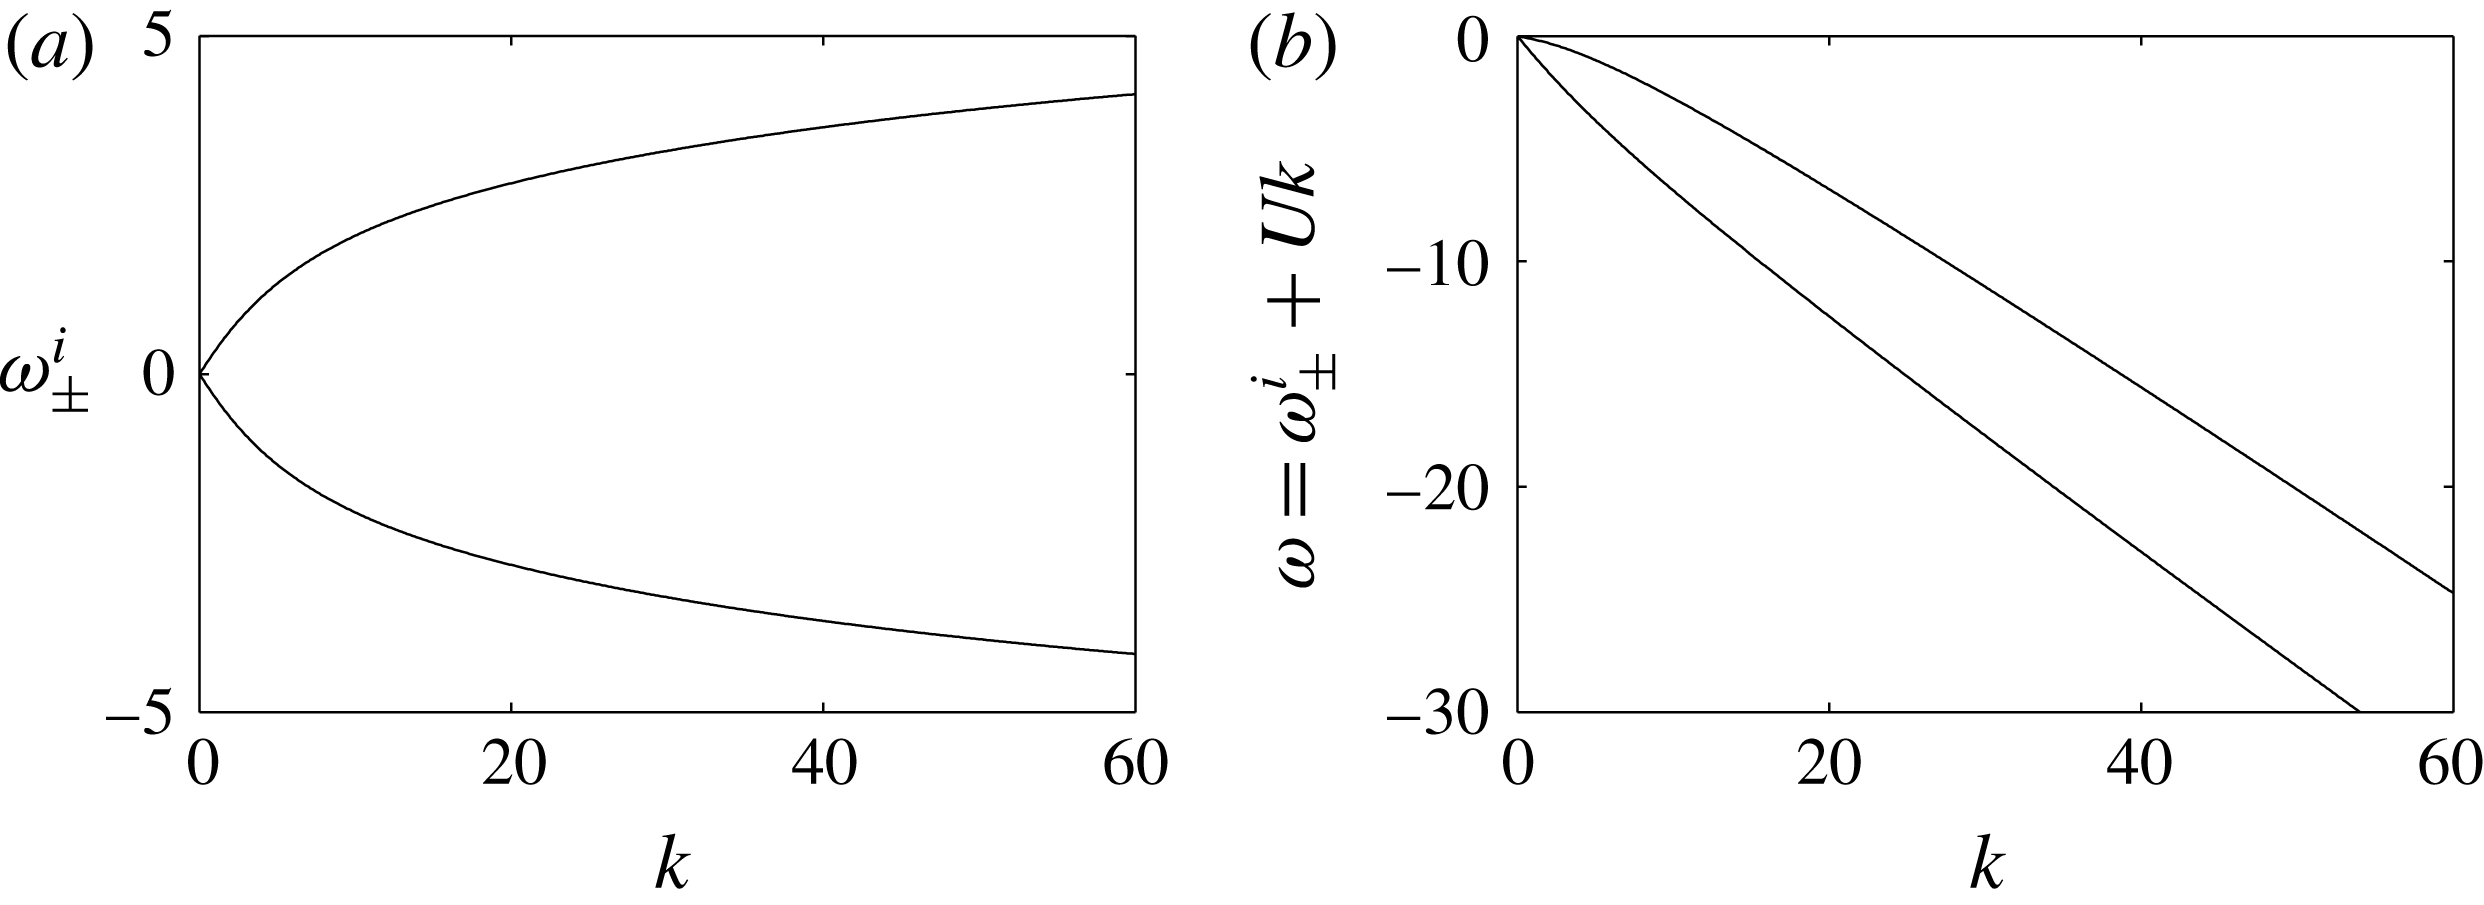
. Numerical solution for the first vertical mode wave gives the intrinsic dispersion relation,
 $\unicode[STIX]{x1D714}_{\pm }^{i}(k)$
, shown in figure 15(a) for
 $z_{0}=0.85$
and
 $\unicode[STIX]{x1D706}=80$
, and the corresponding eigenfunctions
 $\hat{\unicode[STIX]{x1D713}}(z)$
. The roots correspond to right- and left-going waves propagating toward
 $\pm x$
, respectively. In the ISW frame the frequency,
 $\unicode[STIX]{x1D714}=\unicode[STIX]{x1D714}_{\pm }^{i}+Uk$
, is Doppler shifted by
 $U=-c$
. Figure 15(b) shows
 $\unicode[STIX]{x1D714}$
for
 $c=0.4810$
. For a given
 $\unicode[STIX]{x1D714}$
in the ISW frame there are two waves, designated
 $k_{\pm }(\unicode[STIX]{x1D714})$
, corresponding to the right- and left-going roots, respectively. All linear waves have negative phase and group speeds relative to any ISW since
 $c>c_{0}$
.
An example of the linear evolution of a Gaussian packet of waves propagating through an ISW is shown in figure 16. The initial condition is
 $$\begin{eqnarray}\unicode[STIX]{x1D713}(x,z,0)=a_{0}\text{e}^{-\unicode[STIX]{x1D707}^{2}(x-x_{0})^{2}}\hat{\unicode[STIX]{x1D713}}(z)\cos (kx),\end{eqnarray}$$
and the companion relation for
 $s^{\prime }(x,z,0)$
. The group is initially centred at
 $x_{0}=3$
and the packet width scale
 $\unicode[STIX]{x1D707}^{-1}=5$
gives a packet length approximately equal to an optimal disturbance (see figure 7). The amplitude
 $a_{0}$
is arbitrary for these linear calculations. In this example the ISW speed
 $c=0.4810$
and
 $k_{+}=38.4$
at
 $\unicode[STIX]{x1D714}=-14.85$
, the frequency for the DAL optimal disturbance (see figure 12). All the linear wave disturbance calculations that follow were made with
 $Re=10^{5}$
and
 $Sc=1$
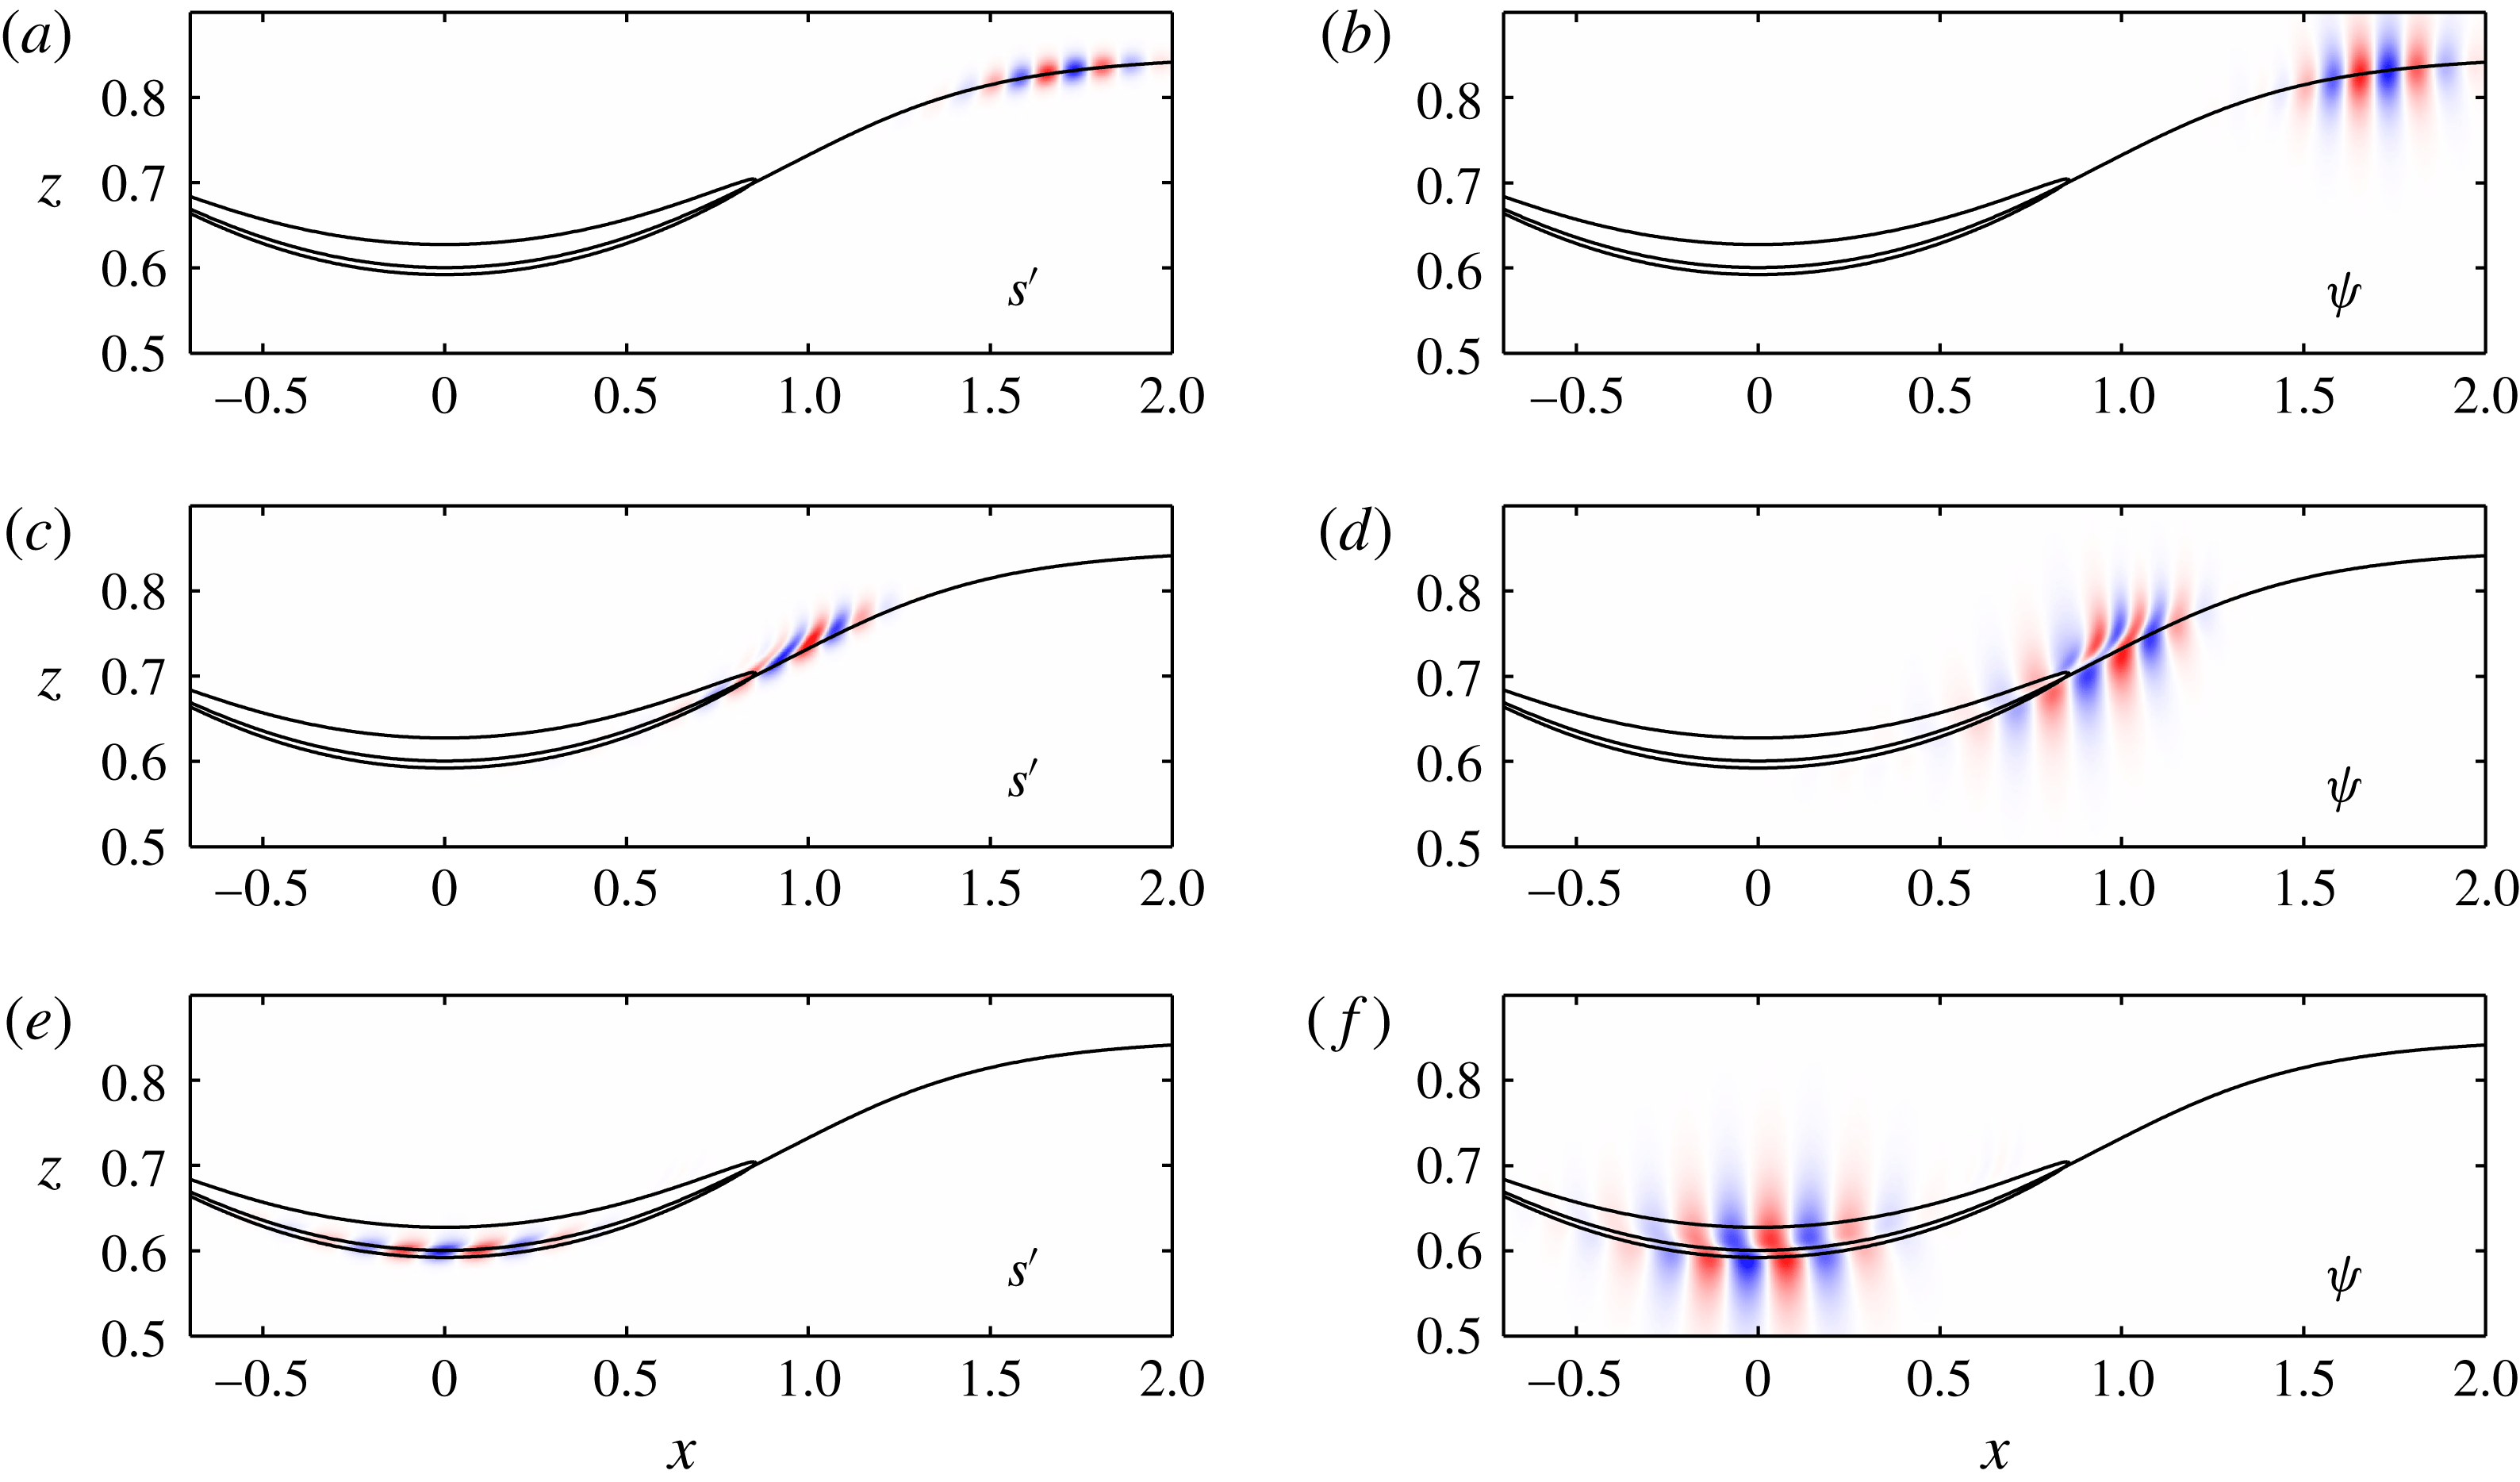
and are the same as used for most of the previous calculations. The packet remains compact and coherent as it enters the ISW (figure 16
a,b), but just before the unstable zone (figure 16
c,d) the packet is distorted by the ISW strain field. Once in the unstable zone (figure 16
e,f) the structure of
 $s^{\prime }$
and
 $\unicode[STIX]{x1D713}$
again closely matches that of an unstable K–H mode.
(a) Intrinsic dispersion relation
 $\unicode[STIX]{x1D714}_{\pm }^{i}(k)$
for the stationary background stratification. (b) Doppler shifted dispersion relation in the ISW frame
 $U=-c$
and
 $c=0.4810$
.

The linear evolution of a Gaussian packet of the right-going waves,
 $k_{+}=38.4$
, at
 $\unicode[STIX]{x1D714}=-14.85$
through the
 $c=0.4810$
DJL wave. (a,c,e)
 $s^{\prime }$
and (b,d,f)
 $\unicode[STIX]{x1D713}$
. The solid lines are the
 $S=0.5$
and the
 $Ri=0.25$
contours. The fields are shown at (a,b)
 $t=2.95$
, (c,d)
 $4.9$
and (e,f)
 $6.55$
. Each field has been normalized by its maximum value at that time.

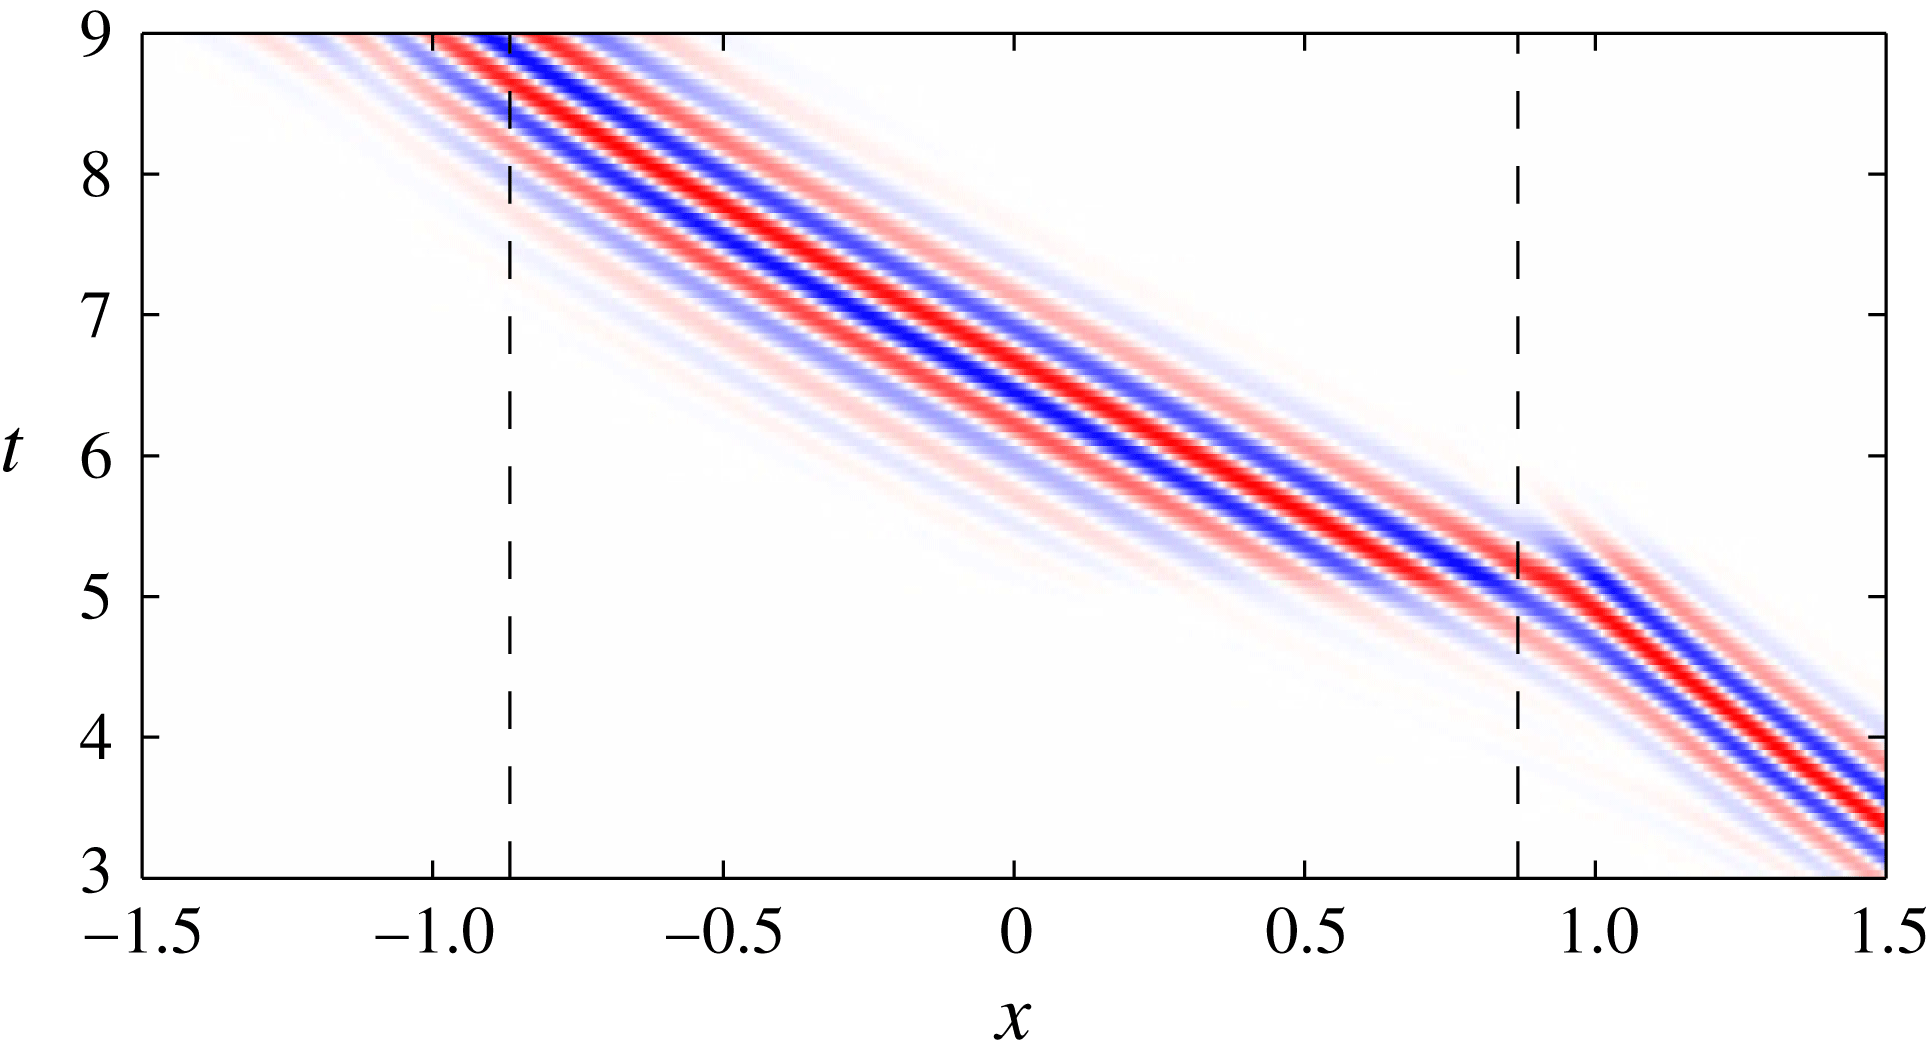
 $\unicode[STIX]{x1D713}(x,t)$
on the ISW
 $S=0.5$
contour normalized to a maximum of one at instant from the run in figure 16. The dashed lines are at
 $|x|=L_{Ri}$
.

The evolution of
 $\unicode[STIX]{x1D713}(x,t)$
on the ISW
 $S=0.5$
isopycnal (figure 17) further illustrates this scattering and rapid evolution as the packet encounters the leading edge of the unstable zone. In their experimental investigation, Fructus et al. (Reference Fructus, Carr, Grue, Jensen and Davies2009) noted effects of the ISW strain field on disturbances entering the waves. The tilting with the shear of both
 $s^{\prime }$
and
 $\unicode[STIX]{x1D713}$
in figure 7(b,d) is indicative of transfer of energy from the perturbation field to the ISW (Camassa & Viotti Reference Camassa and Viotti2012). It is in contrast to the forward tilt of the DAL optimal disturbance packet in the same region (cf. figure 7
a,c).
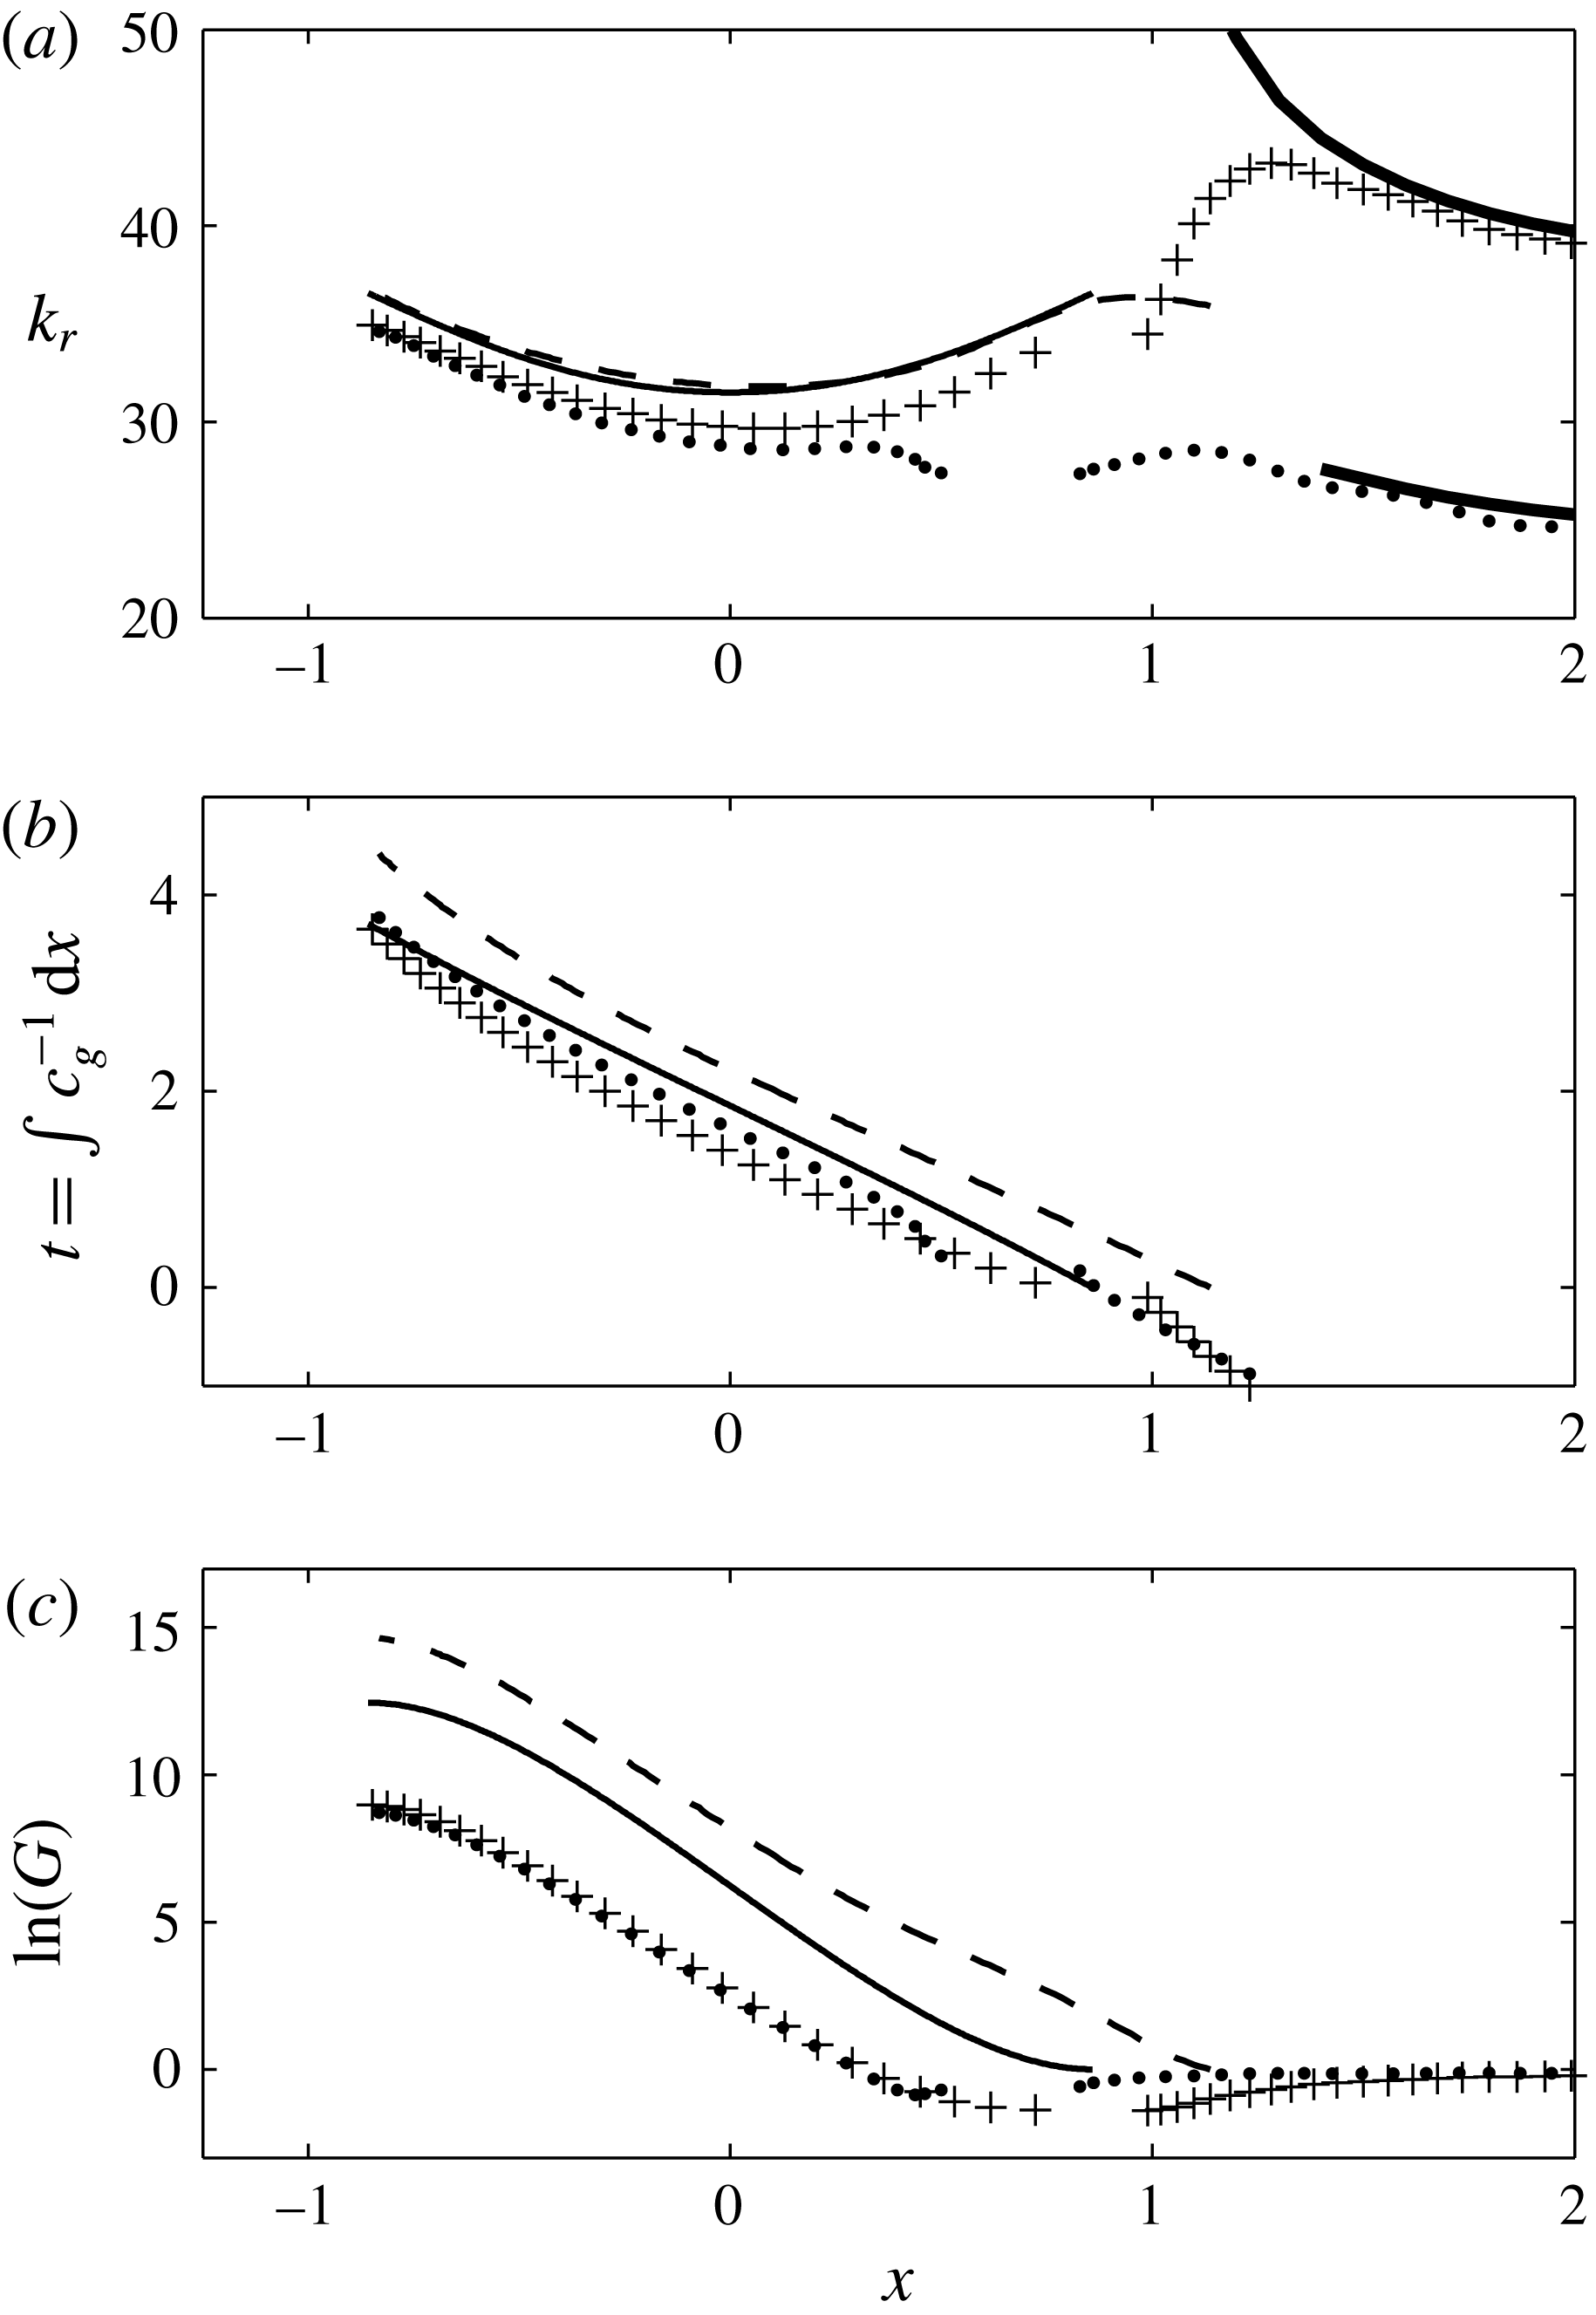
The spatial evolution of the packet central wavenumber
 $k_{+}(x)$
, peak location
 $x(t)$
and energy gain
 $G(x)$
are shown (
 $+$
symbols) in figure 18 along with the results from the DAL optimal disturbance and the WKB analysis (repeated from figure 13
b). Also shown by the thick solid line is
 $k_{+}(x)$
found from local, parallel solutions of (4.2) using the
 $U$
and
 $S$
fields from the
 $c=0.4810$
ISW. As the linear waves approach
 $x=L_{Ri}$
(
 $=0.867$
),
 $k_{+}(x)$
increases rapidly and is discontinuous with
 $k_{r}(x)$
at
 $x=L_{Ri}$
. The wave packet in the forward linear calculation closely follows this prediction as it first enters the ISW, but the rapid variation of the background flow and the resultant strong distortion of the packet causes the curves to diverge. Once in the unstable zone the central wavenumber of the linear packet is slightly smaller than the WKB and DAL optimal results, but does evolve similarly. The packet peak location
 $x(t)$
decelerates on entering the
 $Ri<0.25$
region, then accelerates (jumps) as the packet reforms in the unstable zone to approximately the same group speed as the WKB and DAL optimal cases. Note that the time origin has been shifted to
 $t=0$
when the packet peak is at
 $x=L_{Ri}$
. The evolution of the gain
 $G(x)$
shows an initial loss phase as the packet enters the ISW and then a rapid growth just as found by Camassa & Viotti (Reference Camassa and Viotti2012). While still large, the total gain,
 $\ln (G)=8.75$
is well below the values of
 $12.44$
and
 $14.68$
from the WKB analysis and DAL optimal disturbances, respectively.
The
 $k_{r}(x)$
,
 $t(x)$
and
 $\ln (G(x))$
panels of figure 13(b) with the addition of results from the forward linear calculations initiated with Gaussian-shaped wave packets at
 $x=3$
with
 $\unicode[STIX]{x1D714}=-14.85$
and
 $k_{+}=38.4$
(
 $+$
) and
 $k_{-}=24.6$
(●). The heavy solid lines in (a) show
 $k_{\pm }(x)$
calculated from (4.2) with the stable upstream ISW background flow.

Both Lamb & Farmer (Reference Lamb and Farmer2011) and Camassa & Viotti (Reference Camassa and Viotti2012) found the shorter
 $k_{+}$
wave to have the larger growth through the
 $Ri<0.25$
zone. However, the left-going wave with
 $k_{-}=24.6$
(
 $\unicode[STIX]{x1D714}=-14.85$
), included in figure 18 (the ● symbols), experiences slightly more total growth,
 $\ln (G)=8.99$
, than the
 $k_{+}$
wave. This wave packet does not experience as much initial energy loss entering the ISW as the
 $k_{+}$
wave. Once in the unstable zone, the packet central wavenumber approaches the result of the
 $k_{+}$
packet (a). The calculation for
 $k_{-}(x)$
is stopped at
 $x\approx 1.4$
after a critical layer,
 $U(z)-c=0$
, at
 $z=0$
appears. Additional calculations for ISWs with
 $c=0.4895$
and
 $0.4925$
at
 $\unicode[STIX]{x1D714}_{MAX}$
from the DAL optimal perturbations and for
 $c=0.4810$
with
 $-24<\unicode[STIX]{x1D714}<-7.5$
produced nearly the same total energy gain for the
 $k_{-}$
and
 $k_{+}$
packets. The reasons for this difference from the previous investigations are not clear. However, these calculations were done for perturbation dynamics linearized about an internal solitary wave, while Lamb & Farmer (Reference Lamb and Farmer2011) explored finite-amplitude growth in a fully nonlinear model. Camassa & Viotti (Reference Camassa and Viotti2012) also employed a nonlinear model, but did try to insure that their disturbances remained in the linear regime. The finite viscosity could be important since more damping of the shorter
 $k_{+}$
wave is to be expected. However, calculations at
 $Re=5\times 10^{7}$
give identical behaviour to that shown in figure 18 with the exception of more total energy growth (
 $\ln (G)=9.98/9.77$
for
 $k_{+}/k_{-}$
).
The total gain of the
 $k_{+}$
wave packets with frequencies equal to optimal disturbance
 $\unicode[STIX]{x1D714}_{MAX}$
and
 $Re=10^{5}$
are shown as the open triangles in figure 11. Growing disturbances require
 $c\gtrsim 0.46$
and the total energy gain is always below both the WKB and DAL optimal disturbance values. Interestingly, the difference in gain between the optimal disturbances and the free wave packets,
 $\ln (G_{opt})-\ln (G_{fwp})$
, is almost constant, varying only from
 $6.25$
at
 $c=0.4579$
, where the linear packet experiences a net loss of energy, to
 $5.35$
at
 $c=0.4925$
. (The difference
 $\ln (G_{opt})-\ln (G_{WKB})$
varied from
 $2.9$
to
 $2$
over the same range.) This difference is comparable to the gain attributable to the Orr mechanism. Recall that for
 $c=0.4810$
growth of
 $\ln (G)\approx 6{-}7$
is possible over a time period of
 $t\leqslant 0.5$
when a disturbance is in the strongly sheared, but stable, region just upstream of
 $x=L_{Ri}$
(see figure 14). The time for a free wave packet to propagate the same distance is
 $t\approx 0.6$
. This implies that the difference between the linear growth of a free wave packet and the DAL optimal disturbance is almost entirely due to the non-normal effects. The optimal disturbances are structured to utilize the Orr mechanism, while the free waves first loose energy to the ISW, also through non-normal dynamics (Camassa & Viotti Reference Camassa and Viotti2012), before the absorption is reversed through the K–H mechanism. The WKB result falls between these two and does not involve either of these non-normal influences.
We attempted to quantify the contribution of both the Orr and the absorption mechanism and performed a similar energy budget to Camassa & Viotti (Reference Camassa and Viotti2012) during the early development of the DAL optimal perturbation. However, such an analysis does not allow for splitting the contributions of each mechanism in the energy budget. Nevertheless, it is interesting to note that the Orr gain
 $\ln (G_{Orr})$
roughly corresponds to the difference between the DAL optimal perturbation gain
 $\ln (G_{opt})$
and the gain produced by the packet of linear free waves
 $\ln (G_{fwp})$
, at least for the DJL waves considered in the present study.
6 Nonlinear evolution
Several previous investigations have explored the nonlinear evolution of disturbances on thin-interface internal solitary waves, with Almgren et al. (Reference Almgren, Camassa and Tiron2012) and Lamb & Farmer (Reference Lamb and Farmer2011) being the most relevant to this discussion. However, both of these studies focussed on free wave disturbances, while here the finite-amplitude evolution of DAL optimal disturbances is of interest. To maintain consistency with these earlier studies the finite-volume, incompressible Navier–Stokes code, IAMR (Almgren et al. Reference Almgren, Bell, Colella, Howell and Welcome1998), is used. This model is an adaptive-grid version of the VARDEN code used in Almgren et al. (Reference Almgren, Camassa and Tiron2012) and Camassa & Viotti (Reference Camassa and Viotti2012) and the models in Barad & Fringer (Reference Barad and Fringer2010) and Lamb & Farmer (Reference Lamb and Farmer2011) are built on the same underlying second-order advection and projection algorithm.
The present calculations are made for two-dimensional flow on a fixed, isotropic grid with cells sizes
 $\unicode[STIX]{x0394}x=\unicode[STIX]{x0394}z=1/512$
and a rigid lid. The runs were initiated with a DJL solitary wave centred in the domain of half-length
 $L\geqslant 6$
along with any initial perturbations. The upstream boundary,
 $x=L$
, was an inflow boundary with
 $s=\bar{S}(z)$
from (2.7) and
 $U=-c$
. Since
 $c>c_{0}$
, disturbances are advected out of the open boundary at
 $x=-L$
. The open boundaries require that IAMR be run in a non-Boussinesq mode, therefore all the results presented below use
 $\unicode[STIX]{x0394}\unicode[STIX]{x1D70C}/\unicode[STIX]{x1D70C}_{0}=0.01$
so that the flow will be close to Boussinesq and analysed as such. The calculations have zero explicit viscosity and diffusivity. The Godunov-based advection scheme produces an implicit numerical diffusion, but it only becomes significant when gradients at the grid scale are large.
An important diagnostic is the (non-dimensional) domain integrated Boussinesq ISW energy per unit width
 $E_{ISW}=E_{KE}+E_{APE}$
, where
 $$\begin{eqnarray}E_{KE}=\frac{1}{2}\int _{\unicode[STIX]{x1D6FA}}|\boldsymbol{u}(\boldsymbol{x},t)|^{2}\,\text{d}\unicode[STIX]{x1D6FA}\end{eqnarray}$$
and
 $$\begin{eqnarray}E_{APE}=\int _{\unicode[STIX]{x1D6FA}}\int _{\bar{S}(z)}^{s(\boldsymbol{x},t)}(z-\bar{z}(s^{\prime }))\,\text{d}s^{\prime }\,\text{d}\unicode[STIX]{x1D6FA},\end{eqnarray}$$
are the total kinetic and the available potential energies, respectively. The
 $E_{APE}$
is found using the background density field
 $\bar{S}(z)$
appropriate for ISWs (Scotti, Beardsley & Butman Reference Scotti, Beardsley and Butman2006; Lamb Reference Lamb2008) and
 $\bar{z}$
is the inverse mapping of
 $\bar{S}(z)$
such that
 $\bar{z}(\bar{S}(z,t))=z$
.
(a–e) The nonlinear evolution of the optimal disturbance for the
 $c=0.4810$
DJL wave. (f–j) Same as (a–e) except the initial disturbance is a Gaussian packet of linear internal waves with
 $\unicode[STIX]{x1D714}=-14.85$
and
 $k_{+}=38.4$
initially centred at
 $x=3$
. In both cases
 $E_{0}/E_{ISW}(0)=10^{-5}$
. The panels show contours of the density
 $S=[0.1:0.1:0.9]$
at the indicated times. Note that only part of the model domain is shown.

As an example of the model fidelity, a run initialized with the
 $c=0.4810$
DJL wave and no disturbance was integrated for
 $25$
time units after which the change in domain integrated energy of the solitary wave,
 $\unicode[STIX]{x0394}E_{ISW}(25)/E_{ISW}(0)=2.3\times 10^{-4}$
. The loss is nearly constant in time and not a consequence of a rapid initial adjustment of the Boussinesq solitary wave to the non-Boussinesq numerical model. The integration time is relatively short. However, in the calculations presented next, comparable integrations time are sufficient for disturbances to be swept from the domain.
The evolution of the
 $c=0.4810$
ISW seeded with the DAL optimal disturbance is shown in figure 19(a–e). This disturbance is the same as shown in figure 7. The panels show contours of the density field,
 $s(x,z,t)$
, at the indicated times. The initial optimal disturbance in this and subsequent calculations has
 $Re=10^{5}$
since the structure of the optimal disturbances was found to be only weakly dependent on
 $Re$
in this range. The ratio of the initial energy of the perturbation,
 $E_{0}$
from (3.4), to the ISW energy,
 $E_{0}/E_{ISW}(0)=10^{-5}$
. In calculating
 $E_{0}$
,
 $N_{\ast }^{2}$
is replaced with the local buoyancy frequency field of the ISW,
 $N^{2}=-S_{z}$
. The energy of the perturbation corresponds to
 $\max |u^{\prime }|/c=7.4\times 10^{-2}$
and thus is a relatively large perturbation chosen to produce a large response. However, the maximum perturbation isopycnal displacement
 $\max (|\unicode[STIX]{x1D702}^{\prime }|)=6.1\times 10^{-5}$
, is very small and the disturbance is not apparent in a plot of the density field at
 $t=0$
(not shown). As with previous nonlinear calculations of this type, the disturbance grows to finite-amplitude K–H billows that breakdown into turbulence as the packet leaves the unstable zone. The turbulence and mixing in the packet evident for
 $t\geqslant 4$
are certainly not captured correctly in these two-dimensional calculations; however, Barad & Fringer (Reference Barad and Fringer2010) found that three-dimensional effects did not become important until after the disturbances exits the primary ISW. Thus these calculations should give reliable estimates of energy loss from the ISW, but not capture the ultimate fate of the turbulent billows and resulting vertical mixing. Note also that after the disturbance packet leaves the wave, internal waves are radiated behind the ISW (
 $t=20$
) as the ISW adjusts. The total energy loss at
 $T=25$
, after the turbulent patch and the radiated waves have exited the domain, is
 $\unicode[STIX]{x0394}E_{ISW}(25)/E_{ISW}(0)=1.6\times 10^{-2}$
. This is two orders of magnitude larger than the loss associated with the numerical scheme over the same period.
For comparison, figure 19(f–j) shows the same ISW initiated with a free linear wave packet with frequency
 $\unicode[STIX]{x1D714}=-14.85$
and
 $k_{+}=38.4$
(see figure 16) centred at
 $x=3$
. The disturbance also has
 $E_{0}/E_{ISW}(0)=10^{-5}$
, although
 $\max |u^{\prime }|/c=1.5\times 10^{-2}$
and
 $\max (|\unicode[STIX]{x1D702}^{\prime }|)=3.1\times 10^{-3}$
are different. The larger initial isopycnal displace reflects the equipartition of kinetic and potential energy in the free wave packet. Again, the disturbance grows to produce large billows and turbulence, although they are clearly weaker than in figure 19(a–e). The energy loss
 $\unicode[STIX]{x0394}E_{ISW}(25)/E_{ISW}(0)=5.0\times 10^{-3}$
is only approximately one third of the loss due to the optimal disturbance.
The consequences of non-normality are clearly evident in the comparison. The optimal disturbance achieves finite amplitude, i.e. overturning isopycnals, before reaching the mid-point of the wave (panels a and b) while this only occurs after the mid-point of the ISW for the linear wave packet (panel h). This might be attributed to the relatively large size of the initial optimal disturbance. However, the Gaussian wave packet is initially equally energetic. Furthermore, an optimal disturbance with
 $E_{0}/E_{ISW}(0)=10^{-7}$
also produces overturning billows on the leading face of the ISW, while equivalent energy free wave packet does not produce a measurable energy loss.
The ISW energy losses from single optimal disturbance packet as a function of
 $c$
and
 $E_{0}/E_{ISW}(0)$
are shown in figure 20. Finite energy loss for
 $E_{0}/E_{ISW}(0)=10^{-5}$
is found for
 $c\gtrsim 0.45$
, where
 $Ri_{min}\approx 0.2$
,
 $L_{Ri}/\unicode[STIX]{x1D709}\approx 0.43$
and from figure 11
 $\ln (G_{MAX})\approx 4$
. The loss increases to
 ${\approx}7\,\%$
for
 $c=0.4925$
, the largest ISW considered. Although not exhaustive, the results indicate that the energy loss saturates for
 $E_{0}/E_{ISW}(0)\approx 10^{-5}$
. The corresponding results for the Gaussian free wave packets with
 $E_{0}/E_{ISW}(0)\approx 10^{-5}$
are also shown. For these disturbances, finite energy loss occurs for
 $c\gtrsim 0.475$
, where
 $Ri_{min}\approx 0.11$
 $L_{Ri}/\unicode[STIX]{x1D709}\approx 0.81$
and
 $\ln (G_{MAX})\approx 6$
, and reaches approximately 6 % for
 $c=0.4925$
. Note that the values of
 $L_{Ri}/\unicode[STIX]{x1D709}$
and
 $Ri_{min}$
reported for the packet of free waves are consistent with the parametric study of Carr et al. (Reference Carr, King and Dritschel2011) (see their figures
 $12$
–
 $14$
). The difference between the optimal and free wave disturbances increases as
 $c$
decreases, reflecting the increased significance of non-normal effects in this range (cf. figure 11). From these data maximal loss functions,
 $\unicode[STIX]{x1D6FE}(c)$
, are found by fitting to the
 $E_{0}/E_{ISW}(0)=10^{-5}$
data for both the optimal and free wave disturbances. These are shown in figure 20 by the dashed (dash-dot) line for the optimal (free wave) disturbance. Attempts to distinguish between losses due to K–H instability and the radiated waves proved unreliable. The calculations do show that the wave radiation becomes increasingly significant as
 $c$
increases.
Fractional ISW energy loss as a function of
 $c$
from one disturbance packet. The initial amplitude of perturbation
 $E_{0}/E_{ISW}=10^{-7}$
(circles),
 $10^{-6}$
(squares) and
 $10^{-5}$
(diamonds). The open symbols are for DAL optimal disturbances and the closed symbols are for Gaussian free linear wave packets. The dashed (dash-dot) line shows
 $\unicode[STIX]{x1D6FE}(c)$
fit to the
 $E_{0}/E_{ISW}=10^{-5}$
data for the optimal (free wave) packet.

6.1 Long-time evolution of ISWs forced by optimal perturbations
The evolution of base states subjected to continuous, periodic forcing with spatial structure given by the optimal perturbation has been considered by Brandt et al. (Reference Brandt, Sipp, Pralits and Marquet2011) and Sipp & Marquet (Reference Sipp and Marquet2013). However, a simpler, approximate approach that follows from models of adiabatic decay of KdV solitary waves (Grimshaw et al.
Reference Grimshaw, Pelinovsky and Talipova2003) is possible. From the previous section, each encounter of a disturbance packet with a wave extracts a small fraction of energy from the ISW given by
 $\unicode[STIX]{x1D6FE}(c)$
. Assuming a slow, adiabatic adjustment to each encounter, the ISW energy evolves as
 $$\begin{eqnarray}\frac{\text{d}E_{ISW}}{\text{d}x}\approx -N_{p}\unicode[STIX]{x1D6FE}(c)E_{ISW},\end{eqnarray}$$
where
 $c(E_{ISW})$
and
 $\unicode[STIX]{x1D702}_{MAX}(E_{ISW})$
are found from DJL solution family, and
 $N_{p}$
is the number of disturbance packets per unit length. The disturbance packets have a length
 ${\approx}0.5$
(see figure 7), so that
 $N_{p}=2$
approximates continuous encounters and thus the maximum rate of decay. Cases with
 $N_{p}<2$
can be obtained by a simple rescaling of
 $x$
.
Figure 21 shows solutions for the maximal decay,
 $N_{p}=2$
, of an initial wave with
 $\unicode[STIX]{x1D702}_{MAX}=0.3025$
(
 $c=0.49$
) subject to both optimal disturbance and free wave packets. For the optimal disturbance the decay 90 % of the way to the largest stable wave occurs on a spatial scale
 $x_{diss}\approx 100$
and time scale
 $t_{diss}\approx 200$
. The free wave decays occurs slightly sooner, although the final waves are quite different. As a consequence, optimal disturbances can result in substantially more total loss of energy from the initial solitary wave. In this example optimal disturbances extract
 $82\,\%$
of the initial ISW energy compared to the
 $52\,\%$
for the free wave packets. Taking
 $H=100$
m and
 $\unicode[STIX]{x0394}\unicode[STIX]{x1D70C}=2~\text{kg}~\text{m}^{-3}$
as representative of coastal settings, the initial wave has a total energy of
 $1.71\times 10^{6}~\text{J}~\text{m}^{-1}$
and the dimensional decay scales become
 $x_{diss}\approx 10$
km and
 $t_{diss}\approx 4$
h. The rate of dissipation per unit width,
 $cN_{p}\unicode[STIX]{x1D6FE}E_{ISW}$
, falls from
 ${\approx}1100~\text{W}~\text{m}^{-1}$
at
 $x=0$
, to
 ${\approx}40~\text{W}~\text{m}^{-1}$
at
 $x=x_{diss}/2$
. This initial rate is extremely large, although the later rate is comparable to observational estimates of
 $10{-}50~\text{W}~\text{m}^{-1}$
(Moum et al.
Reference Moum, Farmer, Smyth, Armi and Vagle2007; Shroyer et al.
Reference Shroyer, Moum and Nash2010a
).
Slowly varying estimates of
 $\unicode[STIX]{x1D702}_{MAX}(x)$
from (6.3) with
 $\unicode[STIX]{x1D702}_{MAX}(0)=0.49$
(
 $c=0.49$
),
 $N_{p}=2$
and
 $\unicode[STIX]{x1D6FE}(c)$
from the optimal (solid line) or free wave (dashed line) disturbances. The dash-dot line shows the largest wave stable to optimal disturbances at
 $\unicode[STIX]{x1D702}_{MAX}=0.158$
and
 $c=0.451$
.

7 An application to field observations of Moum et al. (Reference Moum, Farmer, Smyth, Armi and Vagle2003)
Moum et al. (Reference Moum, Farmer, Smyth, Armi and Vagle2003) tracked trains of ISWs over the Oregon Shelf and reported field observations of instabilities and turbulence within the interfacial regions. In particular, their figures 5 and 6 show acoustic returns from two realizations of the same wave separated by approximately 1 h. In both figures a thin region of high acoustic return indicative of active finite-amplitude overturning and turbulence is present. This signal begins ahead of the wave crest, increases in intensity through the wave and extends behind the wave. Moum et al. (Reference Moum, Farmer, Smyth, Armi and Vagle2003) found that this wave was unstable to K–H instability. However, they estimated the wave crest velocity profile used in the stability analysis from an adiabatic mapping of the upstream and wave crest density fields. This approach is problematic since the wave crest density field is itself affected by the instability, and this may be the origin of the jet-like feature crucial to their conclusions. In contrast, Carr et al. (Reference Carr, King and Dritschel2011) concluded that numerical rounding errors could not trigger finite-amplitude billows for this particular wave. The appearance of finite-amplitude disturbances upstream of the crest is suggestive of excitation by optimal disturbances (or noise that projects onto them) rather than K–H instability excited by free linear waves or simple harmonic forcing.
To explore this interpretation further, the upstream density profile in their figure 8 was used to compute DJL solitary waves in water with total depth
 $H=98$
m. Figure 22(a) shows the observed density profiles (digitized from their figure 8) upstream and at the wave crest. The figure also shows the smoothed version of the upstream profile (dashed) used to compute the DJL families. DJL solitary waves with maximum dimensional isopycnal displacement
 $\unicode[STIX]{x1D702}_{MAX}=20.4$
m, consistent with the value of
 ${\approx}20$
m in Moum et al.’s figure 8, were obtained. Moum et al. (Reference Moum, Farmer, Smyth, Armi and Vagle2003) mention the presence of a background flow,
 $u_{0}(z)$
, and use it in their estimates of wave stability, but do not show the profile. Thus the first DJL wave was calculated for
 $u_{0}(z)=0$
. The density profile at the wave crest is shown by the dashed line in figure 22(a). The wave speed
 $c=0.62~\text{m}~\text{s}^{-1}$
is in good agreement with the observed value of
 $0.6~\text{m}~\text{s}^{-1}$
. The agreement between the crest density profiles below
 $30$
m depth is very good; however, the profiles disagree between depths of
 $12$
and
 $30$
m. This could be a consequence of the background flow so the second family was computed with the flow given by a simple hyperbolic tangent profile
 $$\begin{eqnarray}u_{0}(z)=\frac{\unicode[STIX]{x0394}U}{2}\left(1+\tanh \left[\frac{z-z_{0}}{d}\right]\right).\end{eqnarray}$$
Note that in our notation the
 $z$
origin is at the bottom. (See Stastna & Lamb (Reference Stastna and Lamb2002) for the DJL theory with a sheared ambient flow.) The background density profile suggests a surface intensified flow, thus we took
 $z_{0}=90.2$
m and
 $d=1.63$
m, which mirror the sharp ambient density jump centred at a depth of
 ${\approx}-8$
m. A retrograde upper layer velocity
 $\unicode[STIX]{x0394}U/2=-0.144~\text{m}~\text{s}^{-1}$
(
 $=-0.1$
in scaled variables) is suggested by the observed crest density profile, although the magnitude was chosen arbitrarily, but turned out to be a fortuitous guess. The resulting wave crest density profile is shown by the dash-dot line in figure 22(a). The agreement with the observations is now quite good. This is further demonstrated in figure 22(b) where the observed wave crest horizontal velocity profile digitized from figure 18(b) in Moum et al. (Reference Moum, Farmer, Smyth, Armi and Vagle2003) is shown with the profile from the DJL solution with the ambient shear. The DJL solution has been shifted by the addition of a barotropic component of
 $0.05~\text{m}~\text{s}^{-1}$
. With this additional mean flow (which does not affect the density structure) the wave speed
 $c=0.61~\text{m}~\text{s}^{-1}$
is close to the observed estimate. Additional adjustment of the ambient flow could improve the comparison, but does not seem warranted.
(a) Observed ambient and ISW crest density profiles from Moum et al. (Reference Moum, Farmer, Smyth, Armi and Vagle2003) (solid lines). DJL solitary wave calculations for a still (dashed) and sheared (dash-dot) ambient background flow. (b) Observed ISW crest horizontal velocity profile (solid) and the DJL solution with the sheared ambient flow (dash-dot). (c)
 $Ri$
at the wave crest with the sheared ambient flow. (d) Eigenfunction magnitude,
 $|\hat{\unicode[STIX]{x1D713}}|$
, of the most unstable K–H disturbance.

(a) Contours of
 $\unicode[STIX]{x1D70E}_{\unicode[STIX]{x1D703}}=[24.05:0.2:26.05]$
(thin black lines) of the DJL ISW with ambient shear. The deep region of
 $Ri\leqslant 0.25$
is marked by the heavy blue line. The optimal disturbance streamfunction (arbitrary amplitude) is shown by the thin red and blue contours. The nonlinear evolution of the ISW initialized with the optimal disturbance with
 $E_{opt}/E_{ISW}=10^{-5}$
at
 $t=0$
is shown at (b)
 $t=3.96$
and (c)
 $t=6.78$
min.

For the case without shear, the minimum Richardson number
 $Ri_{min}=0.258$
at a depth of
 $33.7$
m, suggesting that the wave would be stable. With the ambient flow included, there are now three zones of low
 $Ri$
as shown in figure 22(c). The upper and lower zones have
 $Ri_{min}=0.183$
and
 $0.191$
, respectively. These are consistent with the presence of overturns in figure 22(a) (figure 8 in Moum et al.). The middle zone has
 $Ri_{min}=0.064$
and would appear to be deeply unstable to K–H instability. However, solutions of the T–G equation (4.2) for the most unstable spatially growing wave using the wave crest profiles of density and velocity produced the eigenfunction whose magnitude
 $|\hat{\unicode[STIX]{x1D713}}(z)|$
is shown in figure 22(d). This unstable wave is localized in the deepest low
 $Ri$
zone and has (in dimensional variables)
 $\unicode[STIX]{x1D714}=-6.53\times 10^{-2}~\text{s}^{-1}$
,
 $k_{r}=0.185~\text{m}^{-1}$
and
 $k_{i}=9.85\times 10^{-3}~\text{m}^{-1}$
. The stability of the middle zone might be explained by the nearly constant density and absence of an inflection point, indicating stability in analogy with linearly stratified plane Couette flow. However, stratified Couette flow is susceptible to non-normal transient growth (Farrell & Ioannou Reference Farrell and Ioannou1993a
). This question is considered below. First, an estimate for the upper bound of the energy gain from linear K–H disturbances moving through the deepest, low
 $Ri$
region
 $|x|\leqslant L_{Ri}$
is
 $\ln (G)\leqslant 4k_{i}L_{Ri}$
. The DJL solution gives
 $L_{Ri}=31.4$
m (see figure 23
a), therefore
 $\ln (G)\leqslant 1.24$
. Based on the thin-interface results, this ISW is likely stable to small-to-moderate amplitude free wave disturbances.
This suggests that transient growth and non-normal effects might be the origin of the strong instabilities in the observations. This is explored by finding the optimal disturbance for the inviscid DJL wave with ambient shear with
 $Re=10^{6}$
and
 $Sc=1$
. The structure of the DJL wave density field
 $\unicode[STIX]{x1D70E}_{\unicode[STIX]{x1D703}}(x,z)$
with the optimal disturbance streamfunction (with amplitude scaled to one) superimposed is shown in figure 23(a). The optimal disturbance is centred on density contours that pass through the deepest
 $Ri\leqslant 0.25$
zone (also shown). There is also a weak expression that extends up to the density contours that run through the upper low
 $Ri$
zone. The disturbance has
 $\ln (G_{opt})=5.29$
at an optimization time
 $T_{MAX}=6.78$
min. Non-normal effects lead to substantially more growth than the K–H instability upper bound. This disturbance was then used as the initial perturbation in a nonlinear forward calculation with
 $E_{0}/E_{ISW}=10^{-5}$
shown in figure 23(b,c). Finite-amplitude billows develop within the deepest low
 $Ri$
zone on the leading face of the wave and result in strong overturns in the lee of the wave, in good agreement with the observations. A calculation with an upstream disturbance given by a free linear wave packet at the optimal frequency,
 $\unicode[STIX]{x1D714}=-6.53\times 10^{-2}~\text{s}^{-1}$
, and
 $E_{0}/E_{ISW}=10^{-5}$
did not produce finite-amplitude billows or measurably disturb the ISW.
8 Discussion
The linear stability of finite-amplitude internal solitary waves in nearly two-layered stratification has been explored using the method of optimal linear transient growth. The approach determines the structure and properties of disturbances that produce the maximum possible gain of perturbation energy over a finite time horizon. The optimal disturbances take the form of localized wave packets initially located in the interfacial region just upstream of the zone of
 $Ri<0.25$
. They are tilted into the background shear to take advantage of an initial phase of non-normal growth through the Orr mechanism. As they propagate through the primary wave, the packets remain compact and wave-like with well-defined frequency and carrier wavenumber, while experiencing total energy gains of up to
 $10^{17}$
for the largest ISW considered.
The growth and properties of the optimal disturbances were compared to a slowly varying, WKB analysis of spatially growing disturbances of Taylor–Goldstein equation. Agreement between the optimal and WKB disturbance properties (real wavelength
 $k_{r}$
, carrier frequency
 $\unicode[STIX]{x1D714}$
, packet propagation
 $x(t)$
and energy gain
 $G$
) was quite good, with the exception of the effects of the initial phase of non-normal growth absent in the normal stability analysis underlying the WKB approach. Interestingly, the extra amount of this non-normal growth was nearly constant, regardless of the ISW phase speed, and became an increasing fraction of the total growth as the solitary wave speed,
 $c$
, decreased. Further comparison with disturbances consisting of packets of linear free waves with carrier frequencies equal to the optimal transient growth disturbance packet further highlighted the role of non-normal effects. However, in this case, the absorption of the perturbation energy by the primary wave occurred in the leading face of the wave, after which perturbation growth rate and properties mirrored the WKB and optimal disturbance results. Together, these three types of disturbance illustrate that the primary instability is due to spatially growing Kelvin–Helmholtz modes, but that non-normal effects in the leading face of the primary wave play a significant role in determining the total energy gain experienced by an upstream disturbance as it propagates through the ISW.
These differences between disturbance type are significant when considering the finite-amplitude evolution. Nonlinear calculations initiated with optimal disturbances resulted in the development of finite-amplitude Kelvin–Helmholtz billows on the upstream face of the ISW, while comparable packets of free wave only resulted in large billows apparent only on the rear face. This scenario is consistent with the results from numerical experiments by Carr et al. (Reference Carr, King and Dritschel2011) in the case where rounding errors were sufficient to trigger finite-amplitude billows. As a result, significantly more energy was lost from an ISW forced with an optimal disturbance. These results conflict with earlier conclusion that instability resulting in finite-amplitude billows requires
 $\ln (G)>8{-}10$
(from
 $\bar{\unicode[STIX]{x1D714}}_{i}T_{W}>5$
or
 $2\bar{k}_{i}L_{Ri}>4$
),
 $Ri_{min}\lesssim 0.1$
and
 $L_{Ri}/\unicode[STIX]{x1D709}\gtrsim 0.8$
(Troy & Koseff Reference Troy and Koseff2005; Fructus et al.
Reference Fructus, Carr, Grue, Jensen and Davies2009; Lamb & Farmer Reference Lamb and Farmer2011). For the current ISW wave family investigated, this occurs for
 $c\geqslant 0.4792$
, where
 $L_{Ri}/\unicode[STIX]{x1D709}\geqslant 0.923$
. The nonlinear calculations for ISW energy loss (figure 20) required a somewhat lower
 $\ln (G)\gtrsim 6$
for instability at
 $c\approx 0.455$
where
 $L_{Ri}/\unicode[STIX]{x1D709}=0.83$
and
 $Ri_{min}=0.11$
. However, optimal disturbances lead to finite-amplitude overturning billows and energy loss for
 $c\gtrsim 0.455$
, where
 $Ri_{min}=0.17$
,
 $L_{Ri}/\unicode[STIX]{x1D709}=0.58$
and
 $\ln (G_{opt})\approx 4$
, all well below the semi-empirical criteria. Of course, this depends on some measure of the amplitude of the disturbance and more significantly on the presence of an optimal disturbance. However, the ocean thermocline is typically full of energetic motions ranging from random turbulence to free internal waves. It seems reasonable to expect that some of these motions will project onto the optimal structure and lead to large energy growth. As a consequence, we show in § 6.1 that repeated encounters with optimal disturbances can substantially decrease the lifetime of ISWs compared with excitation by linear free waves. Therefore vertical mixing is expected to be greater in the case of optimal forcing.
Results for the viscously adjusted DJL waves show that transient growth is only weakly affected at
 $Re=10^{5}$
representative of laboratory experiments. In the recent experiments by Carr et al. (Reference Carr, Franklin, King, Davies, Grue and Dritschel2017), their
 $141010$
experiment had
 $H=75$
cm and a nominal upper layer depth of
 $10.5$
cm, giving
 $z_{0}=0.86$
, close to our value of
 $0.85$
. A value of
 $\unicode[STIX]{x1D706}\approx 80$
for the hyperbolic tangent density profile (2.7) gives a reasonable match to the density profile and the error function fit shown in their figure
 $6$
. From their figure
 $5$
we estimate a wave amplitude of
 $23.0$
cm (the average of the two curves shown). This gives
 $\unicode[STIX]{x1D702}_{MAX}=0.31$
, which corresponds to an inviscid DJL wave with
 $c=0.49$
. The average wavelength of the interfacial disturbances shown in their figure
 $3$
is
 $l\approx 15.4$
cm. In our scaling this gives wavenumber
 $k=2\unicode[STIX]{x03C0}Hl^{-1}=30.6$
. The optimal and WKB analysis for the
 $c=0.4895$
ISW give, respectively,
 $k=31.6$
and
 $31.9$
. The agreement between the laboratory result and the prediction from the theory is quite good. Carr et al.’s experiments show that the billows reach finite amplitude (overturning) at the wave crest, which might indicate a free wave, or K–H, disturbance, although without information on upstream disturbance amplitude, it is not possible to distinguish the origin of the excitation. The most amplified perturbations were found to be two-dimensional, but substantial transient growth could still be observed for viscous DAL optimal perturbations with transverse wavenumbers of the same order as the thickness of the present pycnocline.
Oceanic measurements from Moum et al. (Reference Moum, Farmer, Smyth, Armi and Vagle2003) were used to compute the DJL wave that best matches their observations of wave crest density and velocity profiles. This DJL wave possessed a complex structure with multiple regions potentially subject to K–H instability and is an interesting test case for the present analysis. Significantly, a standard K–H linear stability estimate for disturbance gain is quite small indicating that the wave should be stable. In contrast, the gain associated with the DAL optimal disturbance is significantly larger and indicates instability. Indeed, the nonlinear evolution of the wave excited by the optimal disturbance exhibits overturning billows in agreement with the observations. This example case shows that the DAL perturbation analysis can be relevant for problems beyond idealized flow configurations and confirms the importance of non-modal growth in this geophysical application.
Field echo sounder observations (Moum et al. Reference Moum, Farmer, Smyth, Armi and Vagle2003; Lien et al. Reference Lien, Henyey, Ma and Yang2014) suggest that in the case of trains of ISWs, the leading wave (usually the largest-amplitude wave in the train) amplifies small-amplitude perturbations to large amplitudes. These perturbations remain energetic and enter the smaller trailing ISWs where they result in observable turbulence. This scenario is especially evident in figure 3 of Moum et al. (Reference Moum, Farmer, Smyth, Armi and Vagle2003). Transient growth, possibly by noise that projects onto optimal disturbances, appears to be the origin of the transition to turbulence and mixing induced by large-amplitude ISWs.
Transient growth instabilities, with the potential for excitation of optimal disturbances, appear to dominate ISWs with sharp interfaces. However, other types of waves such as trapped-core waves (the type-II waves of Zhang & Alford (Reference Zhang and Alford2015)) and mode-two waves (Shroyer, Moum & Nash Reference Shroyer, Moum and Nash2010b ) may also be susceptible to additional instability mechanisms associated closely with the recirculating cores (Helfrich & White Reference Helfrich and White2010; Carr, King & Dritschel Reference Carr, King and Dritschel2012).
Acknowledgements
P.-Y.P. and B.L.W. acknowledge support from the National Science Foundation grant numbers OCE-1155558 and OCE-1736989. K.R.H. acknowledges support from Independent Research and Development and Investment in Science Program awards from the Woods Hole Oceanographic Institution.