


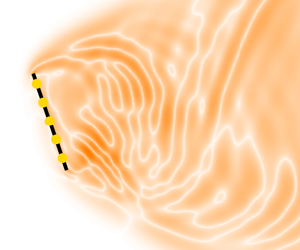
1 Introduction
In fluid dynamics, the goal of state estimation (SE) is to accurately estimate the instantaneous flow field using a set of limited sensor measurements. Achieving this goal can provide insights into key physics and facilitate the prediction and control of flows in various engineering applications. In many problems where SE is of interest, a reduced-order model (ROM) of the high-dimensional system is also typically available. Accordingly, a class of SE strategies that leverage this low-order representation have emerged – that is, estimation is done on a reduced state obtained from the ROM (the full state can be recovered via the ROM when desired). In this article, we focus on such methods which are particularly promising for real-time control applications. We note in passing that ROM-based SE approaches are not the only options; many successful SE methods do not rely on a low-order representation of the flow state. Examples include sparse identification using SINDy (Loiseau, Noack & Brunton Reference Loiseau, Noack and Brunton2018), identifying problem-specific parameters via an ensemble Kalman filter (Darakananda et al. Reference Darakananda, da Silva, Colonius and Eldredge2018) or convolutional autoencoder (Hou, Darakananda & Eldredge Reference Hou, Darakananda and Eldredge2019), or SE using a shallow decoder (Erichson et al. Reference Erichson, Mathelin, Yao, Brunton, Mahoney and Kutz2019). However, it may be computationally prohibitive to integrate these SE approaches into ROMs due to an intermediate step that involves the high-dimensional fluid state.
In most model order reduction approaches, the dynamics of the high-dimensional state are projected onto a low-dimensional linear subspace. A number of bases for this subspace have been developed, e.g. proper orthogonal decomposition (POD) (Lumley Reference Lumley, Yaglom and Tatarsky1967), dynamic mode decomposition (Schmid Reference Schmid2010) and balanced POD (Willcox & Peraire Reference Willcox and Peraire2002). More recently, nonlinear ROMs have been developed that utilize local bases instead of a global basis (Amsallem, Zahr & Farhat Reference Amsallem, Zahr and Farhat2012), or a global nonlinear manifold constructed using autoencoders from deep learning (Lee & Carlberg Reference Lee and Carlberg2019; Otto & Rowley Reference Otto and Rowley2019).
Estimation of the reduced state derived from ROMs can be broadly divided into two categories: intrusive and non-intrusive. Intrusive SE models such as Kalman filtering (Kalman Reference Kalman1960) and particle filtering (Gordon, Salmond & Smith Reference Gordon, Salmond and Smith1993) rely on an observer dynamical system to predict the state (which is later updated based on observed data). These data-assimilation approaches have been coupled with POD-based ROMs on various flow problems (Tu et al. Reference Tu, Griffin, Hart, Rowley, Cattafesta and Ukeiley2013; Kikuchi, Misaka & Obayashi Reference Kikuchi, Misaka and Obayashi2015). On the other hand, non-intrusive methods are model-free and can be further classified into library- and non-library-based approaches.
In library-based approaches, the sensor measurements are approximated with the same library that is used for the ROM (e.g. obtained from POD modes (Bright, Lin & Kutz Reference Bright, Lin and Kutz2013) or the training data itself (Callaham, Maeda & Brunton Reference Callaham, Maeda and Brunton2019)). The resulting optimization problem can be solved in the  $\ell _{1}$ norm to promote sparsity (Candes & Tao Reference Candes and Tao2006). Alternatively, the reduced state can be estimated in the
 $\ell _{2}$ norm, termed gappy-POD (Everson & Sirovich Reference Everson and Sirovich1995). To overcome ill-conditioning and overfitting in this
 $\ell _{2}$ setting, sensor locations can be chosen through greedy (Clark et al. Reference Clark, Askham, Brunton and Kutz2018), optimal (Brunton et al. Reference Brunton, Brunton, Proctor and Kutz2013) or sparse (Sargsyan, Brunton & Kutz Reference Sargsyan, Brunton and Kutz2015) sensor placement algorithms, which can outperform
 $\ell _{1}$-based approaches (Manohar et al. Reference Manohar, Brunton, Kutz and Brunton2018). However, the need for problem-specific sensor locations in this estimation framework limits its flexibility.
Non-library-based approaches, on the other hand, provide an empirically determined map between the measurements and reduced state. This alleviates restrictions on sensor locations and ill-conditioning inherent to library-based methods. One example is linear stochastic estimation (LSE), which provides a linear map through an  $\ell _{2}$ minimization of available data (Adrian Reference Adrian1975). Although traditional LSE relates sensor measurements to the high-dimensional state, recent variants estimate the reduced state (Taylor & Glauser Reference Taylor and Glauser2004; Podvin et al. Reference Podvin, Nguimatsia, Foucaut, Cuvier and Fraigneau2018). Quadratic stochastic estimation (Murray & Ukeiley Reference Murray and Ukeiley2007) provides a specific nonlinear extension to LSE. However, for complex fluid flow problems, the nonlinear relationship between the sensor measurements and the reduced state is generally unknown, and a more flexible framework is necessary.
In this work, we model this nonlinear relationship using neural networks. Neural networks are a natural candidate for this aim, as they have been posited to act as high-dimensional interpolators for function approximation (Mallat Reference Mallat2016; Brunton, Noack & Koumoutsakos Reference Brunton, Noack and Koumoutsakos2020). This approach allows for a lower number of sensors and greater flexibility in sensor locations compared with its linear counterparts. We demonstrate the efficacy of our approach on a two-dimensional model problem of separated flow past a flat plate, and compare results to those obtained via gappy-POD and LSE. While our results on the model problem are obtained using a POD-based ROM, we emphasize that our formulation is agnostic to the ROM, and can be incorporated into either linear or nonlinear ROMs.
2 State estimation: ROM-based framework and prior work
2.1 ROM-based state estimation framework
Consider the dynamical system resulting from the semi-discretization of partial differential equations such as the Navier–Stokes equations:
 $$\begin{eqnarray}\dot{\boldsymbol{w}}=\boldsymbol{f}(\boldsymbol{w},t;\unicode[STIX]{x1D741}),\quad \boldsymbol{w}(t_{n};\unicode[STIX]{x1D741})=\boldsymbol{w}^{n}(\unicode[STIX]{x1D741}),\end{eqnarray}$$
where  $\boldsymbol{w}(t;\unicode[STIX]{x1D741})\in \mathbb{R}^{N_{w}}$ represents the high-dimensional state that depends on time
 $t\in [0,t_{max}]$ and a vector of
 $N_{d}$ parameters
 $\unicode[STIX]{x1D741}\in \mathbb{R}^{N_{d}}$ consisting of, for instance, Reynolds number, angle of attack, Mach number, etc. The nonlinear function
 $\boldsymbol{f}(\boldsymbol{w},t;\unicode[STIX]{x1D741})$ governs the dynamics of the state
 $\boldsymbol{w}(t;\unicode[STIX]{x1D741})$. Provided that one has an estimate of an instantaneous state
 $\boldsymbol{w}^{n}(\unicode[STIX]{x1D741})$ at an arbitrary time
 $t_{n}$, the initial value problem (2.1) can be used to determine
 $\boldsymbol{w}^{n+i}(\unicode[STIX]{x1D741})$ for
 $i=1,2,\ldots$. We refer to (2.1) as the full-order model (FOM).
We consider the scenario where a reduced-order model (ROM) of (2.1) is available. In this case, the high-dimensional state  $\boldsymbol{w}(t;\unicode[STIX]{x1D741})$ is approximated on a low-dimensional manifold as
 $$\begin{eqnarray}\boldsymbol{w}(t;\unicode[STIX]{x1D741})\approx \boldsymbol{w}_{r}(t;\unicode[STIX]{x1D741})=\unicode[STIX]{x1D731}(\boldsymbol{a}(t;\unicode[STIX]{x1D741})),\end{eqnarray}$$
where  $\unicode[STIX]{x1D731}:\mathbb{R}^{N_{k}}\mapsto \mathbb{R}^{N_{w}}$ denotes the nonlinear manifold,
 $\boldsymbol{a}(t;\unicode[STIX]{x1D741})\in \mathbb{R}^{N_{k}}$ is the reduced state on this manifold, and
 $N_{k}\ll N_{w}$ is the dimension of the reduced state. To facilitate a clean presentation of the ROM, we assume that
 $\unicode[STIX]{x1D731}(\boldsymbol{a})$ is continuously differentiable such that
 $\unicode[STIX]{x1D730}(\dot{\boldsymbol{a}})=\dot{\unicode[STIX]{x1D731}}(\boldsymbol{a})$ for some
 $\unicode[STIX]{x1D730}:\mathbb{R}^{N_{k}}\mapsto \mathbb{R}^{N_{w}}$. Substituting the ROM approximation (2.2) in (2.1), and projecting the resulting equation onto a test manifold
 $\unicode[STIX]{x1D726}:\mathbb{R}^{N_{w}}\mapsto \mathbb{R}^{N_{k}}$ such that
 $\unicode[STIX]{x1D726}\unicode[STIX]{x1D730}$ is injective, yields
 $$\begin{eqnarray}\dot{\boldsymbol{a}}=\unicode[STIX]{x1D733}(\boldsymbol{f}(\unicode[STIX]{x1D731}(\boldsymbol{a}),t;\unicode[STIX]{x1D741})),\quad \boldsymbol{a}(t_{n};\unicode[STIX]{x1D741})=\boldsymbol{a}^{n}(\unicode[STIX]{x1D741}),\end{eqnarray}$$
where  $\unicode[STIX]{x1D733}(\cdot )=(\unicode[STIX]{x1D726}\unicode[STIX]{x1D730})^{-1}\circ \unicode[STIX]{x1D726}(\cdot )$ and
 $\boldsymbol{a}^{n}(\unicode[STIX]{x1D741})$ is the initial condition at time instant
 $t_{n}$ for the new initial value problem (2.3). In the case of Galerkin projection, where
 $\unicode[STIX]{x1D731}$ and
 $\unicode[STIX]{x1D726}=\unicode[STIX]{x1D731}^{\text{T}}$ are linear and orthogonal,
 $\unicode[STIX]{x1D733}=\unicode[STIX]{x1D731}^{\text{T}}$.
Now, the original SE goal of estimating the instantaneous high-dimensional state  $\boldsymbol{w}^{n}(\unicode[STIX]{x1D741})$ reduces to estimating the lower-dimensional state
 $\boldsymbol{a}^{n}(\unicode[STIX]{x1D741})$. That is, the SE problem amounts to identifying a map
 ${\mathcal{G}}:\mathbb{R}^{N_{s}}\mapsto \mathbb{R}^{N_{k}}$ between the sensor measurements and the reduced state such that
 $\boldsymbol{a}^{n}={\mathcal{G}}(\boldsymbol{s}^{n})$, where
 $\boldsymbol{s}^{n}(\unicode[STIX]{x1D741})\in \mathbb{R}^{N_{s}}$ denotes the sensor measurements at time instant
 $n$, and
 $N_{s}$ is the number of sensors in the flow field. A schematic of the ROM-based SE framework described here is displayed in figure 1.
Schematic of the ROM-based SE framework, which employs a low-dimensional representation  $\unicode[STIX]{x1D731}$ of the high-dimensional state
 $\boldsymbol{w}^{n}$. Here
 ${\mathcal{G}}$ maps sensor measurements
 $\boldsymbol{s}^{n}$ to the reduced state
 $\boldsymbol{a}^{n}$. In the proposed approach described in § 3,
 ${\mathcal{G}}$ is nonlinear and constructed from a neural network (as pictured). For traditional linear estimation models described in § 2.2,
 ${\mathcal{G}}$ represents a real-valued matrix and the pictured neural network is no longer valid.

2.2 Prior work: linear estimation models
The traditional approach of identifying the map  ${\mathcal{G}}$ is given by gappy-POD (Everson & Sirovich Reference Everson and Sirovich1995). In this approach,
 $\unicode[STIX]{x1D731}$ is restricted to be linear and the sensors directly measure the high-dimensional state at
 $N_{s}<N_{w}$ flow locations, such that
 $\boldsymbol{s}^{n}(\unicode[STIX]{x1D741})=\unicode[STIX]{x1D63E}\boldsymbol{w}^{n}(\unicode[STIX]{x1D741})\approx \unicode[STIX]{x1D63E}\unicode[STIX]{x1D731}\boldsymbol{a}^{n}(\unicode[STIX]{x1D741})$. The matrix
 $\unicode[STIX]{x1D63E}\in \mathbb{R}^{N_{s}\times N_{w}}$ contains 1 at measurement locations and 0 at all other locations. The reduced state
 $\boldsymbol{a}^{n}$ is obtained by the minimization problem:
 $$\begin{eqnarray}\boldsymbol{a}^{n}=\underset{\hat{\boldsymbol{a}}^{n}}{\text{arg min}}\,\Vert \boldsymbol{s}^{n}-\unicode[STIX]{x1D63E}\unicode[STIX]{x1D731}\hat{\boldsymbol{a}}^{n}\Vert _{2}^{2}.\end{eqnarray}$$
The solution to (2.4) is analytically provided by the Moore–Penrose pseudo-inverse of  $\unicode[STIX]{x1D63E}\unicode[STIX]{x1D731}$, resulting in the linear map
 ${\mathcal{G}}$ being defined as
 $\boldsymbol{a}^{n}={\mathcal{G}}(\boldsymbol{s}^{n})=(\unicode[STIX]{x1D63E}\unicode[STIX]{x1D731})^{+}\boldsymbol{s}^{n}$.
The LSE can be considered as a generalization of gappy-POD where the sensor measurements are not restricted to lie in the span of the basis of the high-dimensional state. In other words, the linear operator  $(\unicode[STIX]{x1D63E}\unicode[STIX]{x1D731})^{+}$ can be replaced by a more general matrix
 $\unicode[STIX]{x1D642}\in \mathbb{R}^{N_{k}\times N_{s}}$; that is,
 ${\mathcal{G}}$ is represented via
 $\boldsymbol{a}^{n}={\mathcal{G}}(\boldsymbol{s}^{n})=\unicode[STIX]{x1D642}\boldsymbol{s}^{n}$. In LSE,
 $\unicode[STIX]{x1D642}$ is determined from data via the optimization problem,
 $$\begin{eqnarray}\unicode[STIX]{x1D642}=\underset{\hat{\unicode[STIX]{x1D642}}}{\text{arg min}}\,\Vert \unicode[STIX]{x1D64E}-\hat{\unicode[STIX]{x1D642}}\unicode[STIX]{x1D63C}\Vert _{2}^{2},\end{eqnarray}$$
where  $\unicode[STIX]{x1D64E}\in \mathbb{R}^{N_{s}\times M}$ and
 $\unicode[STIX]{x1D63C}\in \mathbb{R}^{N_{k}\times M}$ are snapshot matrices of sensor measurements and reduced states, respectively, consisting of
 $M$ snapshots. The solution to (2.5) is analytically obtained as
 $\unicode[STIX]{x1D642}=\unicode[STIX]{x1D64E}\unicode[STIX]{x1D63C}^{+}$.
2.2.1 Drawbacks of linear estimation models
In gappy-POD, the sensor locations encoded in  $\unicode[STIX]{x1D63E}$ can significantly influence the condition number of
 $\unicode[STIX]{x1D63E}\unicode[STIX]{x1D731}$. In particular, sensor locations are required to coincide with regions where the columns of
 $\unicode[STIX]{x1D731}$ have significant non-zero and distinct values. Sensor locations that do not satisfy this property lead to an inaccurate estimation of the reduced state,
 $\boldsymbol{a}^{n}=(\unicode[STIX]{x1D63E}\unicode[STIX]{x1D731})^{+}\boldsymbol{s}^{n}$. Furthermore, choosing more library elements than sensors,
 $N_{k}>N_{s}$, can result in overfitting. These limitations can be resolved by selecting optimal sensor locations that improve the condition number of
 $\unicode[STIX]{x1D63E}\unicode[STIX]{x1D731}$ (Manohar et al. Reference Manohar, Brunton, Kutz and Brunton2018) and/or incorporating regularization in (2.4) to mitigate overfitting. However, the need to select specific sensor locations reduces the flexibility of gappy-POD.
Unlike gappy-POD, LSE is significantly more robust to sensor locations. However, it linearly models a (generally non-trivial) nonlinear relationship between the sensor measurements and the reduced state. Therefore, this approach is limited by the rank of  $\unicode[STIX]{x1D642}$, which is at best
 $\text{rank}(\unicode[STIX]{x1D642})\leqslant \min (N_{k},N_{s})$. The estimation performance of LSE can be improved by increasing the number of sensors,
 $N_{s}$, though this is not always possible depending on the given application. We propose a method for more robustly recovering the reduced state by learning a nonlinear relationship using a neural network.
3 Proposed approach: deep state estimation
In our proposed approach, the map  ${\mathcal{G}}$ is further generalized to nonlinearly relate sensor measurements to the reduced state as
 $$\begin{eqnarray}\boldsymbol{a}^{n}={\mathcal{G}}(\boldsymbol{s}^{n})=\boldsymbol{g}(\boldsymbol{s}^{n},\unicode[STIX]{x1D73D}),\end{eqnarray}$$
where  $\boldsymbol{g}(\cdot ,\unicode[STIX]{x1D73D})$ with
 $\boldsymbol{g}:\mathbb{R}^{N_{s}}\rightarrow \mathbb{R}^{N_{k}}$ denotes the nonlinear function parametrized by a set of parameters
 $\unicode[STIX]{x1D73D}$. For various complex fluid flow problems, the nonlinear relationship between
 $\boldsymbol{s}^{n}$ and
 $\boldsymbol{a}^{n}$ is rarely obvious. Therefore, in this work, we propose to model
 $\boldsymbol{g}(\boldsymbol{s}^{n},\unicode[STIX]{x1D73D})$ via a more general approach using neural networks. We refer to this proposed approach as deep state estimation (DSE).
3.1 Neural network architecture
In this work, we employ a neural network architecture consisting of  $N_{l}$ fully connected layers represented as a composition of
 $N_{l}$ functions,
 $$\begin{eqnarray}\boldsymbol{g}(\unicode[STIX]{x1D743};\unicode[STIX]{x1D73D})=\boldsymbol{h}_{N_{l}}(\cdot ;\unicode[STIX]{x1D723}_{N_{l}})\circ \cdots \circ \boldsymbol{h}_{2}(\cdot ;\unicode[STIX]{x1D723}_{2})\circ \boldsymbol{h}_{1}(\unicode[STIX]{x1D743};\unicode[STIX]{x1D723}_{1}),\end{eqnarray}$$
where the output vector at the  $i\text{th}$ layer (
 $i=1,2,\ldots ,N_{l}$) is given by
 $\boldsymbol{h}_{i}(\unicode[STIX]{x1D743};\unicode[STIX]{x1D723}_{i})=\unicode[STIX]{x1D70E}(\unicode[STIX]{x1D723}_{i}[\unicode[STIX]{x1D743}^{\text{T}},1]^{\text{T}})$ with
 $\boldsymbol{h}_{i}(\cdot ;\unicode[STIX]{x1D723}_{i}):\mathbb{R}^{l_{i-1}}\rightarrow \mathbb{R}^{l_{i}}$. Essentially, an affine transformation of the input vector followed by a pointwise evaluation of a nonlinear activation function,
 $\unicode[STIX]{x1D70E}(\cdot ):\mathbb{R}\rightarrow \mathbb{R}$, is performed. Here,
 $l_{i}$ is the size of the output at layer
 $i$ and
 $\unicode[STIX]{x1D723}_{i}\in \mathbb{R}^{l_{i}\times l_{i-1}+1}$ comprises the weights and biases corresponding to layer
 $i$.
A schematic of our proposed DSE approach exhibiting this neural network architecture with  $N_{l}=3$ fully connected layers is shown in figure 1. Sensor measurements of dimensions
 $l_{0}=N_{s}$ are fed as inputs while the output layer comprising the reduced state has dimensions
 $l_{N_{l}}=N_{k}$. We note that other architectures such as graph convolutional or recurrent neural networks for exploiting spatial or temporal locality of sensor measurements, respectively, could be utilized to construct the neural network. However, we choose fully connected layers owing to its simplicity and small dimensions of input and output. The weights
 $\unicode[STIX]{x1D73D}\equiv (\unicode[STIX]{x1D723}_{1},\ldots ,\unicode[STIX]{x1D723}_{N_{l}})$ are evaluated by training the neural network, the details of which are provided in the next section.
3.2 Training the neural network
The first step in training is to collect snapshots of high-dimensional states, sensor measurements and reduced states. The FOM (2.1) is solved at  $N_{p}$ sampled parameters
 $\unicode[STIX]{x1D741}^{s}$ and
 $N_{t}$ time instants to obtain the snapshots
 $\boldsymbol{w}^{n}(\unicode[STIX]{x1D741}_{i}^{s})$ for
 $i=1,\ldots ,N_{p}$ and
 $n=1,\ldots ,N_{t}$, resulting in a total of
 $M=N_{t}N_{p}$ snapshots. Then,
 $\boldsymbol{s}^{n}(\unicode[STIX]{x1D741}_{i}^{s})$ is evaluated via some known transformation of
 $\boldsymbol{w}^{n}(\unicode[STIX]{x1D741}_{i}^{s})$ and
 $\boldsymbol{a}^{n}(\unicode[STIX]{x1D741}_{i}^{s})$ is derived by solving
 $$\begin{eqnarray}\boldsymbol{a}^{n}(\unicode[STIX]{x1D741}_{i}^{s})=\underset{\hat{\boldsymbol{a}}^{n}}{\text{arg min}}\,\Vert \boldsymbol{w}^{n}-\unicode[STIX]{x1D731}(\hat{\boldsymbol{a}}^{n})\Vert _{2}^{2}.\end{eqnarray}$$
When  $\unicode[STIX]{x1D731}$ is linear with orthogonal columns, for instance POD modes, the solution to (3.3) is obtained by
 $\boldsymbol{a}^{n}(\unicode[STIX]{x1D741}_{i}^{s})=\unicode[STIX]{x1D731}^{\text{T}}\boldsymbol{w}^{n}(\unicode[STIX]{x1D741}_{i}^{s})$. Next, the snapshots of
 $\boldsymbol{s}^{n}(\unicode[STIX]{x1D741}_{i}^{s})$ and
 $\boldsymbol{a}^{n}(\unicode[STIX]{x1D741}_{i}^{s})$ for
 $i=1,\ldots ,N_{p}$ and
 $n=1,\ldots ,N_{t}$ are standardized via
 $z$-score normalization (Goodfellow, Bengio & Courville Reference Goodfellow, Bengio and Courville2016) to enable faster convergence while training the neural network.
Typically, prior to training, the data are divided into training and validation sets, which are used to evaluate/update the weights  $\unicode[STIX]{x1D73D}$ and test the accuracy of the network, respectively. Accordingly, for each sampled parameter,
 $\unicode[STIX]{x1D741}_{i}^{s}$, snapshots at
 $N_{train}$ and
 $N_{valid}=N_{t}-N_{train}$ random time instants are chosen for training and validation, respectively, resulting in a total of
 $M_{train}=N_{train}N_{p}$ training and
 $M_{valid}=N_{valid}N_{p}$ validation snapshots. Once the neural network is trained, it is tested on a set of testing snapshots, which were utilized in neither training nor validation. Accordingly, we collect
 $M_{test}=N_{test}N_{p}^{\ast }$ testing snapshots of
 $\boldsymbol{w}^{n}(\unicode[STIX]{x1D741}_{i}^{\ast })$,
 $\boldsymbol{s}^{n}(\unicode[STIX]{x1D741}_{i}^{\ast })$ and
 $\boldsymbol{a}^{n}(\unicode[STIX]{x1D741}_{i}^{\ast })$ for
 $i=1,\ldots ,N_{p}^{\ast }$ and
 $n=1,\ldots ,N_{test}$ time instants evaluated at
 $N_{p}^{\ast }$ unsampled parameters such that
 $\unicode[STIX]{x1D741}^{\ast }\nsubseteq \unicode[STIX]{x1D741}^{s}$.
We train the neural network  $\boldsymbol{g}(\cdot ;\unicode[STIX]{x1D73D})$ to evaluate the trainable parameters
 $\unicode[STIX]{x1D73D}$ by minimizing the
 $\ell _{2}$ error between the reduced state and its approximation, given by
 $$\begin{eqnarray}\unicode[STIX]{x1D73D}=\underset{\hat{\unicode[STIX]{x1D73D}}}{\text{arg min}}\,\mathop{\sum }_{i=1}^{M_{train}}\Vert \boldsymbol{a}^{(i)}-\boldsymbol{g}(\boldsymbol{s}^{(i)},\hat{\unicode[STIX]{x1D73D}})\Vert _{2}^{2},\end{eqnarray}$$
where the superscript  $(i)$ denotes the
 $i\text{th}$ training snapshot. The problem (3.4) is solved using the stochastic gradient descent (SGD) method with mini-batching and early stopping (which acts as a regularizer to avoid overfitting) (Goodfellow et al. Reference Goodfellow, Bengio and Courville2016).
4 Numerical experiments: flow over a flat plate
In this section, our proposed DSE approach is applied on a test case of a two-dimensional flow over a flat plate. We choose  $\unicode[STIX]{x1D731}$ to be linear containing the first
 $N_{k}$ POD modes of the snapshot matrix, whose columns are given by
 $\boldsymbol{w}^{n}(\unicode[STIX]{x1D741}_{i}^{s})-\bar{\boldsymbol{w}}$ for
 $i=1,\ldots ,N_{p}$ and
 $n=1,\ldots ,N_{t}$, where
 $\bar{\boldsymbol{w}}=(1/M)\sum _{i=1,n=1}^{i=N_{p},n=N_{t}}\boldsymbol{w}^{n}(\unicode[STIX]{x1D741}_{i}^{s})\in \mathbb{R}^{N_{w}}$ is the mean. We again emphasize that POD is chosen for its ubiquity in practice and ease of presentation; the estimation framework described above can be incorporated into a range of ROMs.
All results reported in this section are predictive. That is, the estimated states all lie in parameter regions  $\unicode[STIX]{x1D741}^{\ast }$ not sampled for training the neural network. The results generated by DSE are compared with gappy-POD and LSE, described in § 2.2. The performance of these approaches is analysed by computing the relative error
 $$\begin{eqnarray}\text{error}\,(\%)=\frac{\Vert \boldsymbol{w}^{n}(\unicode[STIX]{x1D741}^{\ast })-\boldsymbol{w}_{r}^{n}(\unicode[STIX]{x1D707}^{\ast })\Vert _{2}}{\Vert \boldsymbol{w}^{n}(\unicode[STIX]{x1D741}^{\ast })\Vert _{2}}\times 100,\end{eqnarray}$$
where  $\boldsymbol{w}^{n}(\unicode[STIX]{x1D741}^{\ast })$ and
 $\boldsymbol{w}_{r}^{n}(\unicode[STIX]{x1D741}^{\ast })$ are the FOM and estimated solutions, respectively.
4.1 Problem description
We consider flow over a flat plate of length 1 unit at  $Re=200$. The parameter of interest
 $\unicode[STIX]{x1D707}$ is the angle of attack (AoA) of the flat plate. Two sets of AoA are considered: (a)
 $\unicode[STIX]{x1D707}\in [25^{\circ },27^{\circ }]$ and (b)
 $\unicode[STIX]{x1D707}\in [70^{\circ },71^{\circ }]$. Both parameter sets lead to separated flow and vortex shedding.
The problem is simulated using the incompressible Navier–Stokes equations in the immersed boundary framework of Colonius & Taira (Reference Colonius and Taira2008), which utilizes a discrete vorticity–streamfunction formulation. The solver employs a fast multi-domain approach for handling far-field Dirichlet boundary conditions of zero vorticity. Accordingly, for the two sets of AoA considered, we utilize five grid levels of increasing coarseness. The grid spacing of the finest domain (and of the flat plate) is  $\unicode[STIX]{x0394}x=0.01$, and the time step is
 $\unicode[STIX]{x0394}t=0.0008$. All the snapshots are collected after roughly five shedding cycles, by which time the system approximately reaches limit cycle oscillations of vortex shedding (and lift and drag). The domain sizes of the finest and coarsest grid levels are (a)
 $[-1,4]\times [-2,2]$ and
 $[-37.5,42.5]\times [-32,32]$, and (b)
 $[-1,3]\times [-1,5]$ and
 $[-30,34]\times [-45,51]$. The total number of grid points in the finest domain is thus (a)
 $500\times 400$ and (b)
 $400\times 600$, respectively. All collected snapshots and SE results correspond to the finest domain only.
Note that all simulations are conducted by placing the flat plate at  $0^{\circ }$ and aligning the flow at angle
 $\unicode[STIX]{x1D707}$ with respect to the plate. This is done to obtain POD modes that are a good low-dimensional representation of the high-dimensional flow field for the range of AoAs considered. However, while displaying the results, the flow fields are rotated back to align the plate at angle
 $\unicode[STIX]{x1D707}$ for readability.
For SE via DSE, the neural network consists of  $N_{l}=3$ layers with dimensions
 $l_{i}=500$ for
 $i=1,2$,
 $l_{0}=N_{s}$ and
 $l_{N_{l}}=N_{k}$. For the nonlinear activation function
 $\unicode[STIX]{x1D70E}$, we use rectified linear units (ReLU) (Goodfellow et al. Reference Goodfellow, Bengio and Courville2016) at the hidden layers and an identity function at the output layer. Following the data segregation strategy explained in § 3.2, training data are split into 80 % and 20 % for training and validation, respectively. For SGD, learning rate is set to 0.1 during the first 500 epochs (for faster convergence), which is then reduced to 0.01 for the remainder of training, momentum is set to 0.9 and mini-batch size is set to 80. Training is terminated when the error on the validation dataset does not reduce over 100 epochs, which is chosen as the early stopping criterion. Overall, the network is trained for approximately 2000 epochs on Pytorch.
4.2 Flow at  $\unicode[STIX]{x1D707}\in [25^{\circ },27^{\circ }]$

Here we compare the predictive capabilities of our proposed DSE approach to several linear SE approaches for AoA  $\unicode[STIX]{x1D707}\in [25^{\circ },27^{\circ }]$, and where the sensors measure vorticity at
 $N_{s}=5$ locations on the body. The matrix
 $\unicode[STIX]{x1D731}$ used for the ROM is constructed using
 $N_{k}=25$ POD modes of the vorticity snapshot matrix.
The AoAs used for training the SE methods are  $\unicode[STIX]{x1D707}^{s}=\{25^{\circ },25.2^{\circ },\ldots ,27^{\circ }\}$, and those used for testing are
 $\unicode[STIX]{x1D707}^{\ast }=\{25.5^{\circ },26.25^{\circ },26.75^{\circ }\}\nsubseteq \unicode[STIX]{x1D707}^{s}$. For each AoA,
 $N_{t}=250$ training snapshots and
 $N_{test}=50$ test snapshots are sampled between
 $t=20$ and 28 convective time units. Thus, a total of
 $M=2750$ training and
 $M_{test}=150$ testing snapshots are used, respectively.
Comparison of vorticity contours estimated by the high-fidelity model (FOM), gappy-POD, LSE and DSE at  $\unicode[STIX]{x1D707}^{\ast }=26.75^{\circ }$,
 $t=27.17$ and corresponding relative error (mean and standard deviation of state estimations at all testing instances) with
 $N_{k}=25$ modes and
 $N_{s}=5$ sensors that measure vorticity. The contour values are limited between
 $-8$ and
 $+8$ for visualizing vortical structures in the wake.

Figure 2 shows the vorticity contours produced by the high-fidelity model (FOM), gappy-POD, LSE and DSE at  $\unicode[STIX]{x1D707}^{\ast }=26.75^{\circ }$,
 $t=27.17$. The flow field constructed by DSE more accurately matches the FOM solution as compared to gappy-POD and LSE. Moreover, the average relative error of the states estimated at all 150 testing instances by DSE is only 1.03 % as compared to 34.74 % and 16.84 % due to gappy-POD and LSE, respectively.
4.3 Flow at $\unicode[STIX]{x1D707}\in [70^{\circ },71^{\circ }]$

We now consider a more strenuous test case of flow at large AoA, which exhibits richer dynamics associated with more complex vortex shedding behaviour; cf. figure 4(a). For added complexity and application relevance, we consider sensors that measure the magnitude of surface stress (instead of vorticity) at locations on the body. The basis  $\unicode[STIX]{x1D731}$ is constructed from POD modes of the snapshot matrix containing vorticity and surface stress. Details of the first six POD modes are provided in appendix A. The AoAs for training and testing are
 $\unicode[STIX]{x1D707}^{s}=\{70^{\circ },70.2^{\circ },\ldots ,71^{\circ }\}$ and
 $\unicode[STIX]{x1D707}^{\ast }=\{70.25^{\circ },70.5^{\circ },70.75^{\circ }\}\nsubseteq \unicode[STIX]{x1D707}^{s}$, respectively. For each AoA,
 $N_{t}=400$ training snapshots and
 $N_{test}=80$ test snapshots are sampled between
 $t=25$ and 52.2 convective time units, resulting in a total of
 $M=2400$ and
 $M_{test}=240$ snapshots for training and SE, respectively.
In figure 3, we compare various methods through vorticity contours at  $\unicode[STIX]{x1D707}^{\ast }=70.75^{\circ }$,
 $t=38.76$ obtained by using
 $N_{k}=25$ POD modes and
 $N_{s}=5$ sensors. It can be observed that DSE significantly outperforms gappy-POD and LSE. Moreover, the average relative error of the states estimated at all 240 testing instances by DSE is only 2.07 % as compared to 61.75 % and 35.75 % in gappy-POD and LSE approaches, respectively. Additional details of these results are provided in appendix B, where we have plotted the error in estimated vorticity.
Analogue of figure 2 for  $\unicode[STIX]{x1D707}^{\ast }=70.75^{\circ }$,
 $t=38.76$,
 $N_{k}=25$ modes, and
 $N_{s}=5$ sensors that measure the magnitude of surface stress.

(a) Demonstration of vortex shedding phenomena computed by FOM: plot of  $C_{l}$ and
 $C_{d}$ versus time at
 $\unicode[STIX]{x1D707}=70^{\circ }$. (b) Performance comparison of gappy-POD, LSE, DSE and optimal reconstruction when
 $\unicode[STIX]{x1D707}^{\ast }\in [70^{\circ },71^{\circ }]$: relative error for varying number of surface stress sensors in
 $N_{s}=\{5,10,15\}$.

Finally, we compare the performances of these SE approaches for different numbers of POD modes,  $N_{k}=\{15,25,35\}$, and sensors,
 $N_{s}=\{5,10,15\}$. The average relative errors of the estimated vorticity for these nine permutations are plotted as markers in figure 4(b). The solid lines connect the markers with lowest errors corresponding to each
 $N_{k}$, therefore highlighting the best performance among
 $N_{s}=\{5,10,15\}$. We also compare the results with the optimal reduced states obtained by projection,
 $\boldsymbol{a}^{n}=\unicode[STIX]{x1D731}^{\text{T}}\boldsymbol{w}^{n}$. These are called optimal because the POD coefficients are exact, and all error is incurred from the ROM approximation (2.2). By contrast, ROM-based SE approaches incur error due to both the ROM approximation and the model error associated with the map
 ${\mathcal{G}}$. Therefore, none of the above-mentioned SE methods can be expected to estimate a more accurate state than the optimal reconstruction obtained via these optimal reduced states. The error in optimal reconstruction is plotted in blue and represents a lower bound of the error, not an SE approach. From the plot, it can be observed that DSE produces an error of only 1 %–3 % as compared to 10 %–40 % due to LSE and 50 %–200 % due to gappy-POD. For all numbers of sensors considered, DSE produces errors that are comparable to the lower bound. Estimates by LSE do not improve as the number of modes
 $N_{k}$ is increased, due to its rank-related limitations as described in § 2.2.1. Similar error trends were also observed for the previous simpler test case of
 $\unicode[STIX]{x1D707}\in [25^{\circ },27^{\circ }]$, though for conciseness these results are not shown in this article.
5 Conclusions
In this article, a deep state estimation (DSE) approach was introduced that exploits a low-order representation of the flow field to seamlessly integrate sensor measurements into reduced-order models (ROMs). In this method, the sensor data and reduced state are nonlinearly related using neural networks. The estimated reduced state can be used as an initial condition to efficiently predict future states or recover the instantaneous full flow field via the ROM approximation. Numerical experiments consisted of two-dimensional flow over a flat plate at high angles of attack, resulting in separated flow and associated vortex shedding processes. At parameter instances not observed during training, DSE was demonstrated to significantly outperform traditional linear estimation approaches such as gappy-POD and linear stochastic estimation (LSE). The robustness of the approach to sensor locations and the physical quantities measured was demonstrated by placing varying numbers of vorticity- and surface-stress-measuring sensors on the body of the flat plate. Finally, it is emphasized that the proposed approach is agnostic to the ROM employed; i.e. while a POD-based ROM was utilized for the numerical experiments, the general DSE framework allows for any choice of linear or nonlinear low-dimensional representation.
Acknowledgement
The authors gratefully acknowledge H. Tran for useful discussions on neural networks and snapshot sampling strategies for training.
Declaration of interests
The authors report no conflict of interest.
Appendix A. POD modes
This section briefly provides a physical intuition of the POD modes utilized in § 4.3 for the  $\unicode[STIX]{x1D707}\in [70^{\circ },71^{\circ }]$ test case. The first six POD modes along with the relative energy content corresponding to vorticity is provided in figure 5. We can clearly observe the vortical structures in the wake due to von Kármán vortex shedding. The first two dominant modes capture the primary vortex near the upper surface of the plate shed from the leading and trailing edges. For instance, this structure corresponds to the leading-edge vortex in figure 3. The remaining modes represent subharmonic spatial structures of the first two modes. A linear combination of all these modes provides a temporal flow-field representation of the alternating vortex shedding phenomena.
POD modes and their relative energy content (provided in parenthesis) corresponding to vorticity of snapshot matrix containing vorticity and surface stress for  $\unicode[STIX]{x1D707}\in [70^{\circ },71^{\circ }]$. The contour values are limited between
 $-0.008$ and
 $+0.008$ for visualizing vortical structures in the wake.

Appendix B. Additional results: vorticity error plots
In this section we provide the contour plots of the relative error between the FOM vorticity and vorticity estimated by gappy-POD, LSE and DSE corresponding to the results demonstrated in figure 3. Here we define relative error as  $|\boldsymbol{w}^{n}(\unicode[STIX]{x1D741}^{\ast })-\boldsymbol{w}_{r}^{n}(\unicode[STIX]{x1D707}^{\ast })|/\Vert \boldsymbol{w}^{n}(\unicode[STIX]{x1D741}^{\ast })\Vert _{\infty }$, where
 $\boldsymbol{w}^{n}(\unicode[STIX]{x1D741}^{\ast })$ and
 $\boldsymbol{w}_{r}^{n}(\unicode[STIX]{x1D741}^{\ast })$ are the FOM and estimated solutions, respectively. We can observe that, while DSE produces approximately uniform but low errors throughout the wake region, gappy-POD and LSE generate very high error, specifically in the estimation of the most dominant structure, namely the leading-edge vortex. Since the vortices in the nearest vicinity of the plate contribute most to its aerodynamic performance, it is crucial to estimate such structures accurately, which is indeed accomplished by DSE.
Comparison of contours of relative error (in %) between FOM vorticity and vorticity estimated by gappy-POD, LSE and DSE at  $\unicode[STIX]{x1D707}^{\ast }=26.75^{\circ }$,
 $t=27.17$ with
 $N_{k}=25$ modes and
 $N_{s}=5$ sensors that measure surface stress.



