Introduction
Plant community composition and species abundance and distribution in Antarctica are increasingly changing due to the direct impacts of climate change, pollution, invasive species and humans (e.g. Frenot et al. Reference Frenot, Chown, Whinam, Selkirk, Convey, Skotnicki and Bergstron2005, Wall Reference Wall2005, Convey et al. Reference Convey, Bindschadler, di Prisco, Fahrbach, Gutt, Hodgson, Mayewski, Summerhayes and Turner2009, Tin et al. Reference Tin, Fleming, Hughes, Ainley, Convey, Moreno, Pfeiffer, Scott and Snape2009). Indirect effects of climate warming, including changes in availability of key environmental resources and rapid changes in populations of both indigenous and alien species, could influence terrestrial ecosystems more than changes in temperature alone (Frenot et al. Reference Frenot, Chown, Whinam, Selkirk, Convey, Skotnicki and Bergstron2005, Convey Reference Convey2006, Wasley et al. Reference Wasley, Robinson, Lovelock and Popp2006, Tin et al. Reference Tin, Fleming, Hughes, Ainley, Convey, Moreno, Pfeiffer, Scott and Snape2009).
Marine vertebrates play an important role both in the transfer of nutrients from marine to coastal terrestrial ecosystems in Antarctica, as well as by having direct impacts through trampling in the vicinity of breeding colonies and other large concentrations of animals. Lack of feeding competition (due to anthropogenic reductions in great whale populations), coupled with recent changes in krill-based food webs in the Southern Ocean (due to changes in the extent of winter sea ice), has resulted over the last 60 years in a rapid recovery and a distributional expansion of Antarctic fur seal (Arctocephalus gazella Peters 1875) populations, previously harvested almost to extinction at their main population centres on South Georgia and the South Shetland Islands (Waluda et al. Reference Waluda, Gregory and Dunn2010). A summer population of a few non-breeding adult male and yearling fur seals first appeared on Signy Island (South Orkney Islands, maritime Antarctic) during the 1950s, which increased slowly to a few hundred individuals by the mid-1970s. Since then there has been a dramatic population explosion, rapidly rising to over 10 000 individuals towards the end of the 1980s with peaks of more than 20 000 individuals in 1994, 1995 and 2000 (Smith Reference Smith1988, Reference Smith1997, Reference Smith2007, Waluda et al. Reference Waluda, Gregory and Dunn2010). This population still consists predominantly of male seals, with only a few females and even fewer pups present in any season. Palaeolimnological records (Hodgson et al. Reference Hodgson, Johnston, Caulkett and Jones1998) indicate that this recent distributional expansion has not occurred previously since the retreat of Pleistocene glaciation on the island. Signy Island, which is one of the most important hot-spots of terrestrial (and marine) biodiversity in the whole of the Antarctic biome (Barnes et al. Reference Barnes, Kaiser, Griffiths and Linse2009), thus provides a case study for the consequences related to the climate- and anthropogenic-driven increase of the Antarctic fur seal population on terrestrial and freshwater ecosystems (Smith Reference Smith1988, Reference Smith1990, Reference Smith1997, Butler Reference Butler1999).
The current study aims a) to quantify the variability and abundance of saxicolous and terricolous lichens along the Signy Island coast by comparing areas impacted by fur seals and contiguous areas protected from the animals by fences or coastal morphology, b) to analyse the relationships between lichen diversity and environmental parameters, mainly focusing on fur seal impact and substratum chemistry, and c) to discuss the potential effects of fur seal-impacted vegetation on the functioning of the entire terrestrial ecosystem of Signy Island.
Study area
Signy Island (60°43′S, 45°38′W) is characterized by a cold oceanic climate, with a mean annual air temperature of around -3.5°C, mean monthly air temperatures above 0°C for up to three to four months each summer, and annual precipitation of around 400 mm, primarily in the form of summer rain (Guglielmin et al. Reference Guglielmin, Ellis-Evans and Cannone2008). Climatic records indicate a progressive warming of air temperatures of 2 ± 1°C over the past 50 years (Turner et al. Reference Turner, Colwell, Marshall, Lachlan-Cope, Carleton, Jones, Lagun, Reid and Iagovkina2005), which accounts for the recent rapid shrinkage of the Signy ice cap, now covering about half of the island (Smith Reference Smith2007). The bedrock is mainly quartz-mica-schist, although marbles and amphibolites locally outcrop (Smith Reference Smith2007). The soils are mainly gelisols, and discontinuous permafrost occurs with an active layer ranging between 40 cm and 2 m in depth (Guglielmin et al. Reference Guglielmin, Ellis-Evans and Cannone2008).
The vegetation includes both Antarctic herb tundra, which is characterized by the two native vascular plants Deschampsia antarctica Desv. and Colobanthus quitensis (Kunth) Bartl., and the more widespread Antarctic non-vascular cryptogam tundra formation (Smith Reference Smith1972, Reference Smith1984). The latter consists mainly of the fruticose lichen and moss cushion sub-formations in drier and more exposed sites (e.g. Usnea–Andreaea association), and moss turf (e.g. Polytrichum strictum–Chorisodontium acyphyllum association) and carpet (e.g. associations with Sanionia uncinata (Hedw.) Loeske) subformations in wetter areas (Gimingham & Smith Reference Gimingham and Smith1970, Smith Reference Smith1972). Communities of crustose lichens characterize littoral and supralittoral rocks, coastal rocks influenced by seabirds and inland dry rocks and soils at higher altitudes (Smith Reference Smith1972, Reference Smith1997, Reference Smith2007).
The recent increases in summer populations of Antarctic fur seals are already known to have had major impacts on elements of the island’s vegetation. Due to excessive trampling and increased nutrient input, these highly mobile and gregarious marine mammals have caused the eutrophication of previously oligotrophic lake systems (Butler Reference Butler1999, Quayle & Convey Reference Quayle and Convey2006) and the severe or complete destruction of c. 15% of the island’s bryophyte vegetation, including unique terrestrial ecosystems (Smith Reference Smith2007). Cover of the dominant moss species has been reduced over large areas, and totally lost in others, and there has been a large increase in abundance of the nitrophilous alga Prasiola crispa (Lightfoot) Kützing (Smith Reference Smith1990). Changes in cover of the dominant moss species have been monitored in adjacent fenced and unfenced areas, and correlated with both physical disturbance and changes in soil chemistry due to seawater and sweat washed out of the seals’ fur (Mg and Na increases) and to urine and excrement deposition (nitrate and ammonium increases) (Smith Reference Smith1997). While more anecdotal observations on the general disappearance of macrolichens in seal-damaged areas has also been reported, changes in lichen variability and abundance have not been quantified (Smith Reference Smith1988, Reference Smith1997).
Methods
Sampling procedure and identification of taxa
Six macroplots (A–F; Table I) were established along the eastern coast of Signy Island, in areas invaded by fur seals and in contiguous control areas protected from the animals. Macroplots A–D were established in areas characterized by different animal abundance, according to field observations in the period January–February 2009 and to the detailed censuses undertaken in late February 2008 and 2009 (Supplementary Materials 1 - www.journals.cambridge.org/jid_ANS), representative of low (A), medium (B, C), and high (D) fur seal pressure. The two control macroplots (E & F) were established in areas having similar elevation, distance from the sea, aspect, slope and surface stoniness, but inaccessible to the animals because of fences (E) or coastal morphology (F).
Location and main characteristics of the macroplots and of their soils, relating to pH, total nitrogen and carbon concentrations and C/N ratio.

surface occurrence of rock particles larger than coarse gravel (diameter > 16 mm), including cobbles and boulders
*having, substantially, a 360° exposure because of low slope
The six macroplots, divided into 76 1 m2 subplots, were surveyed for lichen vegetation by visually estimating species abundance as percentage cover (Will-Wolf et al. Reference Will-Wolf, Scheidegger and McCune2002, Reference Will-Wolf, Hawksworth, Mc Cune, Rosentreter and Sipman2004). Samples of lichens collected from the plots were identified following Øvstedal & Smith (Reference Øvstedal and Smith2001, Reference Øvstedal and Smith2004), Søchting et al. (Reference Søchting, Øvstedal and Sancho2004) and monographic descriptions. Specimens of all lichens referred to here are held in the Herbarium of the University of Torino (TO).
Environmental variables
All macroplots were established in north-facing areas on quartz-mica-schist substrata, with a few marble pebbles present on the soil surface at site A only. Distance from the sea (DS) ranged between 20 and 200 m, elevation (EL) ranged between 5 and 40 m. Slope (SL) and degree of surface stoniness (% occurrence of rock fragments larger than coarse gravel, BL) were determined for each macroplot at the subplot level (Table I). No boulders displaying a height above the ground of more than 30 cm, which could be inhomogeneously exposed to the fur seal influence and nutrient distribution, occurred in the study plots. At each macroplot, a representative soil sample was sieved through an 0.075 mm mesh, oven dried at 105°C for 24 h, and then analysed for percentage soil nitrogen (N) and percentage soil carbon (C), using a dynamic flash combustion system coupled to a gas chromatograph with a thermal conductivity detector, and for soil pH (AOAC 1997).
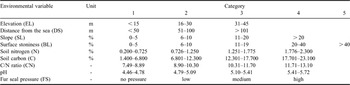
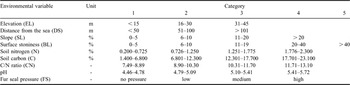
Soil chemical characteristics, including N, C, C/N and pH, and the other environmental features, including EL, DS, SL, BL and fur seal pressure (FS), were classified into categories as indicated in Table II.
Classification into categories of the environmental variables.
Vegetation data processing
Relevé data were used for fur seal impacted and control areas to compute: a) species richness (alpha-diversity, sensu Whittaker Reference Whittaker1972), providing the intra-plot diversity, b) richness of Antarctic-endemic and widely-distributed species, c) richness of species having different growth forms (crustose, foliose, fruticose), d) species density (mean species richness per subplot), e) beta-diversity (sensu Harrison et al. Reference Harrison, Ross and Lawton1992), to quantify any differences in species compositions between sites (species turnover). In particular, beta-1 and beta-2 diversity were computed on the basis of subplot results as follows:


The cover of each lichen species in each subplot was expressed a) as a percentage with respect to the whole extent of the subplot (C1%), and b) as a percentage with respect to the extent of colonizable substratum in the subplot (i.e. rock and soil/moss surfaces for saxicolous and terricolous species, respectively) (C2%). We used C1% to compute for fur seal impacted and control areas: i) the contribution (%) of each species to the total lichen cover, and ii) the total and specific lichen covers (%) with respect to the overall survey. We used C2% to compute iii) the total saxicolous and terricolous cover with respect to the rock and soil surfaces, respectively, occurring in the analysed plots.
The trend of the alpha-diversity/cover relationship at the subplot level was visualized separately for fur seal impacted and control areas through fitting curves (2 degree polynomial) obtained by applying the standard procedure of the programme Origin 6.1 (www.originlab.com).
The matrix of species cover (C1%) at the subplot level was used to perform the following multivariate analyses: a) classification of subplots and species (UPGMA, weighted dissimilarity as resemblance measure, no standardization, arbitrary resolution of ties, 0.44 dissimilarity as main cut off level) (Podani Reference Podani2001), b) ordination of subplots on the basis of species data using Principal Coordinate Analysis (PCoA: symmetric scaling with species score divided by standard deviation, square-root transformation, centring samples by samples, centring species by species) (ter Braak & Šmilauer Reference Ter Braak and Šmilauer2002).
The matrices of species cover (C1%) and environmental variables were used to analyze the species environmental relationships at the subplot level through a (c) Canonical Correspondence Analysis, which partitions variation explained by each variable and constructs a model of significant variables (CCA using biplot scaling for inter-species distances, Hill’s scaling for inter-samples distances, with/without down-weighting of rare species with a frequency of <10%, removing collinear environmental variables with a variance inflation factor of > 20, choosing forward selection of variables option, performing Monte Carlo permutation test on the first and all ordination axes) (ter Braak & Verdonschot Reference Ter Braak and Verdonschot1995).
Classification analyses were performed using SYN-TAX 2000 - Hierarchical Classification (Podani Reference Podani2001), while ordinations were performed using CANOCO 4.5 (ter Braak & Šmilauer Reference Ter Braak and Šmilauer2002).
Results
Soil analysis
Fur seal impacted macroplots showed a wider range of nitrogen (0.2–2.3%) and carbon (1.4–23.1%) contents, including maximum and minimum detected values, while control plots displayed intermediate values. C/N ratio was higher in control plots (range: 7.5–13.1). pH ranged between 4.5 and 5.7 (Table I).
Lichen variability and abundance
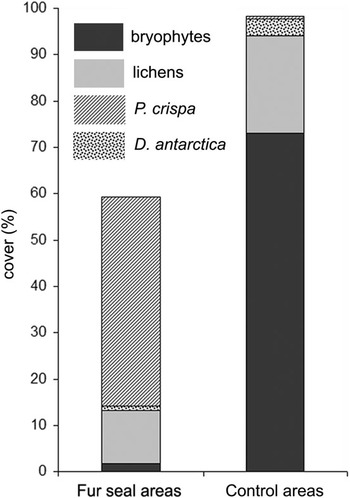
Control and fur seal impacted plots, located a short distance from each other, with otherwise similar conditions of elevation, distance from the sea, aspect, slope and surface stoniness (Table I), showed different average vegetation cover and clearly different relative abundances of major cryptogamic components (Fig. 1). Control plots were completely covered by vegetation (average cover ± s.e.: 98 ± 4%), mainly composed of bryophytes (73 ± 3%; Chorisodontium aciphyllum (Hook. f. & Wilson) Broth., Sanionia spp. and Polytrichum spp. as dominant species in both macroplots, together with Pohlia nutans (Hedw.) Lindb. in macroplot E). Fur seal plots showed lower vegetation cover (59 ± 1%), mainly consisting of mats of the alga Prasiola crispa on 45 ± 4% of rock and soil surfaces, with only scattered bryophytes (1.7 ± 0.5%). The grass Deschampsia antarctica occurred with low percentage cover in one control macroplot, where it was largely interspersed with dominant mosses, and in one seal-impacted macroplot, where grass tillers and moss growth were present close to the outcropping rocks.
Average vegetation cover (%) in fur seal vs control plots. Bryophytes (1.7% vs 73.1%), lichens (11.5% vs 21.1%), Deschampsia antarctica (1.0% vs 3.6%), Prasiola crispa (45.1% vs 0.4%).

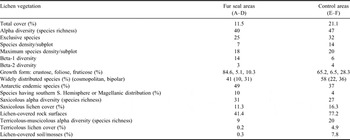
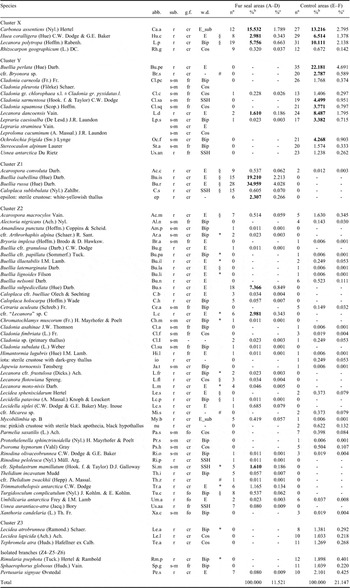
Lichens occurred in all control and seal-impacted subplots: in the former they covered 21 ± 3% of the total surface, including 77 ± 4% of available rock surfaces and 8 ± 2% of soil and mosses, while in the latter they covered 12 ± 3% of the total surface, including 41 ± 5% of available rock surfaces and 0.3 ± 0.1% of soil (Table III). Seal-impacted and control plots showed similar lichen alpha-diversity (40 species vs 47 species), but were characterized by different species composition, prevailing growth form and type of substratum (rock vs soil and mosses). Only 15 species (20%) were common to both the impacted and control plots from a total of 74 infrageneric taxa (including 24 Antarctic endemic species) recorded during the survey (Table III).
Variability and abundance of lichen vegetation in fur seal and control areas. Total, saxicolous and terricolous-muscicolous coverages are mean values calculated with respect to the overall surface of the surveyed plots, independently of rock/soil % occurrence. Data on the specific world distribution follow Øvstedal & Smith (Reference Øvstedal and Smith2001).

The lichen vegetation of the control plots included both saxicolous (57%) and terricolous-muscicolous species (43%), with a dominance of crustose lichens (although fruticose (28%) and foliose (7%) species were common) and of widely distributed species (i.e. cosmopolitan and bipolar species, amounting to 58% of the species) (Table III). Impacted plots were characterized by the dominance of saxicolous species (80%), particularly of crustose species (with lower occurrence of fruticose (10%) and foliose (5%) than in control plots), as well as of Antarctic endemic species and species having a southern South America or Magellanic distribution (59% of the total species) (Table III).
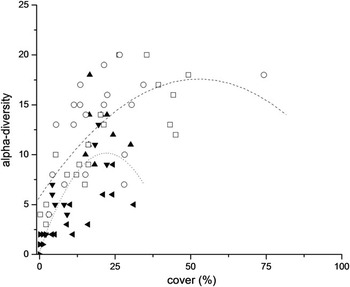
Species density in control plots was double that in impacted plots (14 vs 7 species/subplot), which were characterized by a higher species turnover between subplots, as shown by the higher values of beta-1 diversity and the beta-1/beta-2 ratio (Table III). In both impacted and control subplots, species richness tended to increase with increasing total cover (Fig. 2) up to the threshold of c. 25% cover; beyond this value species richness tended to decrease.
Relationship between lichen alpha-diversity and total lichen cover (%) at the subplot level. Subplots are marked differently for macroplots occupied by fur seals (A = ▴, B =  , C =
 , D = ▾) and controls (E: □, F: ○). Dotted and dashed lines are the polynomial fits calculated on the basis of fur seal subplots and control ones.

The most abundant (i.e. in terms of ground cover) ten species across the entire survey determined 80.3% of the total lichen cover, representing 87.4% of the cover in impacted macroplots and 76.3% in controls. Carbonea assentiens, Huea coralligera, Lecanora dancoensis, L. polytropa showed high cover values (> 1%) in both series of plots, while different members of the genus Buellia dominated individual plots in impacted (Buellia isabellina, B. russa, B. subpedicellata) and control areas (Buellia perlata), with a dense cover of terricolous species also present in the latter (Cladonia sarmentosa, C. squamosa, Lepraria s.l., Ochrolechia frigida) (Table IV).
Specific abundance in fur seal and control areas. Species are listed according to their classification in clusters (X, Y, Z1–Z6) on the basis of their cover through the overall surveyed subplots.
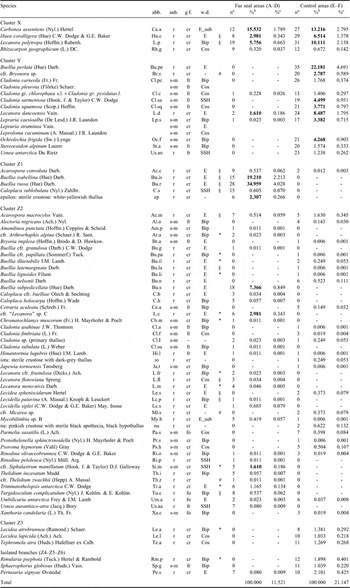
Legend: abb. = species abbreviation; sub. = substratum (r = rock: saxicolous species, s-m = soil-mosses: terricolous-muscicolous species), g.f. = growth form (cr = crustose, fo = foliose, fr = fruticose), w.d. = world distribution (E = Antarctic endemic, E_sub = Antarctic-sub-Antarctic endemic, Cos = cosmopolitan, Bip = bipolar, SSH = Southern South Hemisphere distributed, including Magellanic; on the basis of Øvstedal & Smith Reference Øvstedal and Smith2001), § = nitrophilous species according to Øvstedal & Smith (Reference Øvstedal and Smith2001); first report for South Orkneys (*) and, possibly, Antarctica ( = investigation in progress). na = number of subplots including the species, %b = specific contribution to the total cover (%), %c = specific cover with respect to the total surveyed surface (%). The ten highest specific contributions to the total cover (%b) in fur seal and control areas are shown in bold, thus highlighting dominant species.
Lichen synecology
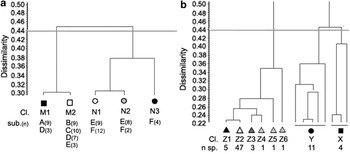
The classification of subplots on the basis of specific cover data separated impacted and control subplots, which clustered in two different groups (M, N) with the exception of three control subplots (i.e. E16, E18, E19, having very high moss cover, but lichen cover lower than 2.5%, and thus being contained in the fur seal cluster M) (Figs 3a & 4a).
Classification of subplots and species on the basis of specific cover data through the overall survey. a. Simplified dendrogram of subplots (44% and 30% dissimilarity as cut levels): the number of subplots belonging to each identified cluster (M1–M2, N1–N3) is shown with reference to the different investigated macroplots (sub.(n); e.g. M1: A(9) D(3) = cluster M includes 9 subplots from macroplot A and 3 subplots from macroplot D). b. Simplified dendrogram of species (44% and 22% dissimilarity as cut levels): the number of species included in clusters X and Y and in subclusters Z1–Z6 is shown (n sp.). Complete dendrograms of subplots and species are shown in supplementary materials 2 and 3 - www.journals.cambridge.org/jid_ANS.

Two groups of impacted subplots were distinguished at the 30% dissimilarity level, which mainly corresponded to those subjected to low (M1 = subplots A1–9, D4, D8, D9) and medium-high (M2 = subplots B1–9, C1–10, remnant D) fur seal pressure. Three different clusters of control subplots (N1–N3) were defined at the same cut off level (Figs 3a & 4a).
The classification of species on the basis of specific cover values through the overall subplots examined separated three main clusters, namely X, Y, Z (Fig. 3b, Table IV). Cluster X (four species, 28.4% of total cover) contained species which showed high cover values in both impacted and control areas. Cluster Y (11 species, 36.4% of total cover) contained high cover species which were exclusive to control plots, mainly terricolous species, and other dominant species of control plots, which also occurred infrequently in impacted areas. Within the remaining cluster there were six sub-clusters derived using 22% dissimilarity as the cut-off level: cluster Z1 (five species, 20.3% of total cover) contained high cover species exclusively occurring in impacted plots (together with Acarospora convoluta, which was present in only two control subplots); cluster Z2 (47 species, 8.0% of total cover) contained low cover species occurring with a low frequency throughout the whole survey (lower than 10%) plus two low-covering species common in impacted plots; the remaining clusters all contained low cover species exclusively occurring in control plots (Z3, contained three species, Z4–Z6 were isolated branches).
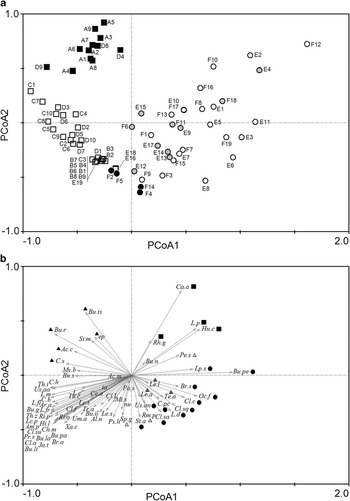
The PCoA extracted four components, which explained 64.5% of the total variance and ordinated the clusters of subplots already identified by the classification with reference to the specific cover data (Fig. 4a). Species vectors were continuously rather than discontinuously distributed: widespread high cover species of cluster X were positively correlated with the first (31.7% of the total variance) and second (16.1%) axes, clustering opposite to cluster Z2 (low cover, infrequent species); cluster Y, including high-cover species of control plots, was positively correlated to the first axis and negatively to the second, opposite to the high cover species of impacted plots belonging to cluster Z1 (Fig. 4b). Accordingly, the first axis separated impacted plots (cluster M) and controls (cluster N), while the second axis separated the two different groups of impacted subplots (M1, M2). The two main clusters of control plots (N1, N2) fell together on the right side of the diagram, while the four subplots of cluster N3 were scattered in the central low area of the diagram between clusters N1, N2 and M2 (Fig. 4a).
Ordination of subplots on the basis of the specific cover (PCoA). a. Subplots are differently marked according to their classification with reference to specific lichen covers (M1 ▪, M2 □, N1 ○, N2  , N3 ●). b. Species are differently marked according to their classification with reference to cover data through the overall surveyed subplots (X ▪, Y ●, Z1 ▴, Z2 not marked species, Z3
 , Z4–Z6
 ). Species abbreviations are listed in Table IV.

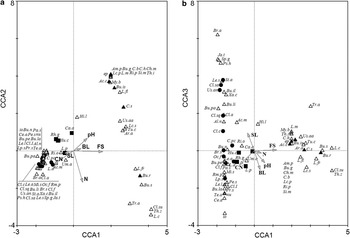
The CCA extracted four axes which accounted for only 22.4% of species data, but for 87.7% of species-environmental relationships (Fig. 5; scores of CCA performed without down-weighting infrequent species are shown in Supplementary Materials 4a - www.journals.cambridge.org/jid_ANS). All canonical axes were significant (Monte Carlo test, P-value = 0.002). The first axis (39.3% of sp.-env. correlation) was characterized by fur seal pressure (weighted correlation 0.91), which was negatively correlated with C/N ratio (w.c. -0.58). The second axis (24.0%) was characterized by nitrogen (w.c. -0.88), while the third axis (16.4%) was characterized by surface stoniness (w.g. -0.75) and slope (w.g. 0.69), which was negatively correlated with pH. All these environmental factors exhibited significant conditional effects (P-values < 0.05). Higher marginal effect according to forward selection was displayed by fur seal pressure (F-value 6.64), followed by nitrogen (F-value 4.35), slope (F-value 3.02) and all remaining factors (F-value < 2.60). The inclusion in the analysis of the other variables, i.e. carbon content, distance from the sea and elevation, resulted in a strong increase of variance inflation factors, because of their co-linearity with nitrogen content, pH and C/N ratio, respectively, thus suggesting their exclusion.
Factorial maps in the CCA showing the position of lichen species and contributions of environmental features (BL = surface stoniness, SL = slope, pH, CN = C/N ratio, N = nitrogen content of soil, FS = fur seal pressure) on a. axes 1 and 2, and b. axes 1 and 3. Species are differently marked according to their classification with reference to cover data through the overall surveyed subplots (X ▪, Y ●, Z1 ▴, Z2 ▵, Z3  , Z4–Z6
 ). Species abbreviations are listed in Table IV.

Species clusters X (dominant species common to both impacted plots and controls), Y (characteristic high cover species of control plots), and Z1 (characteristic high cover species of impacted plots) scattered separately along the first axis following the different levels of fur seal pressure. Species of cluster X were localized near the intersection of the CCA axes, while those of cluster Y split along the third axis, following variations of slope and surface stoniness. Species of cluster Z1 split along the second axis, having higher correlation with nitrogen content. The large cluster Z2, consisting of low cover, rare species, was sparsely distributed along the different gradients and widely overlapped with the other species clusters, split along axes 2 and 3.
Similar CCA results were obtained with and without down-weighting species having low frequency of occurrence (scores of CCA performed with down-weighting of infrequent species are shown in Supplementary Materials 4b - www.journals.cambridge.org/jid_ANS).
Discussion
The severe impacts of Antarctic fur seals on the areas of moss carpet bog, moss turf-banks and mixed moss cushion and fruticose lichen fellfield have been described previously. The current study shows the significant impact on lichen vegetation, although the decreases are less dramatic than for bryophytes in terms of both alpha diversity and total cover values (15% and 46%, respectively). Species composition of lichen communities is strongly affected by the seals, with the disappearance of fruticose taxa, mainly associated with moss turfs, and an increase in nitrophilous crustose species being the predominant features.
PCoA shows that a) a higher percentage cover by four crustose species (Carbonea assentiens, Huea coralligera, Lecanora polytropa, Rhizocarpon geographicum) which are widespread throughout the whole survey (cluster X), and b) the exclusive occurrence of high cover terricolous-muscicolous species (eight out of 11 species of cluster Y, including Ochrolechia frigida, Cladonia and Lepraria species) distinguish the vegetation of control from impacted plots.
The occurrence of a common set of species, displaying different abundances from site to site, was also reported along a transect away from penguin rookeries on King George Island (South Shetland Islands), suggesting that the distinct vegetation zones recognized around the rookeries are not clearly separated floristically (Smykla et al. Reference Smykla, Wolek and Barcikowski2007). Similarly, the occurrence of species of cluster X in both fur seal and control areas accounts for the continuous distribution of species vectors and ordination of subplots in the PCoA.
The large decrease of terricolous-muscicolous lichens (-96% and -55% of cover and alpha diversity, respectively), including several fruticose taxa, also appears similar to that described by Smykla et al. (Reference Smykla, Wolek and Barcikowski2007), in which muscicolous and fruticose lichens were abundant only in the zones away from penguin rookeries. Similarly, in tundra and alpine habitats used for pasture, muscicolous-terricolous lichens are subjected to pressure from cattle trampling or reindeer herding (den Herder et al. Reference den Herder, Kytöviita and Niemelä2003), which destroy soil structure and increase erosion (Pietola et al. Reference Pietola, Horn and Yli-Halla2005), and by nitrogen supply (Nilsson et al. Reference Nilsson, Wardle, Zackrisson and Jäderlund2002, Fremstad et al. Reference Fremstad, Paal and Möls2005).
In particular, the terricolous-muscicolous species of cluster Y were reported to characterize the moss turf subformation on Signy Island, originally described as occurring from near sea level to 155 m elevation (Smith Reference Smith1972). These species scatter together at the middle of CCA axis 2, mainly characterized by increased nitrogen levels, but strongly negatively correlated with fur seal pressure, which shows the highest conditional effect in forward selection. As the co-occurrence of parameters N and FS in the CCA does not determine a strong increase of variance inflation factors, their redundancy can be excluded, indicating that total nitrogen in soils is not strictly/exclusively correlated to fur seal abundance. Thus nitrogen content has less effect on the composition of lichen communities than physical trampling by seals.
Nitrogen dynamics of dung and urine patches on soils are extremely complex and support different processes of plant utilization and N-immobilization by the soil (Saarijärvi & Virkajärvi Reference Saarijärvi and Virkajärvi2009). In previous studies on fur seal effects on moss vegetation on Signy Island (Smith Reference Smith1997), a dramatic change in the nitrogen concentration was reported, mainly due to NH4-N increase (from∼0.02% to∼0.10%) and secondly to NO3-N (from∼0.002% to∼0.02%), deriving from seal urine and excrements. Even higher N-total values were detected in the present study in fur seal plots (0.2%–2.3%), but also in controls (1%) where high soil N occurrence is associated with high biomass of mosses and other plants. However, similar values of N-total were reported by Roberts et al. (Reference Roberts, Newsham, Bardgett, Farrar and Jones2009) in soils associated with higher plants (1.5%) and moss (1.2%) from areas of Signy Island protected from fur seal pressure, and C/N ratios were only slightly lower in all the impacted macroplots with respect to the control ones, all values being in a range which also characterize closed alpine grasslands excluded from grazing animals (Körner Reference Körner2003). Moreover, all the measured N-total values were much lower than those reported within penguin rookeries (9–16%), where lichens are absent (Smykla et al. Reference Smykla, Wolek and Barcikowski2007).
A daily N excretion rate per seal of 0.086 kg (∼2.58 kg month-1) was estimated for the non-migrant colony of Cape fur seals (Arctocephalus pusillus pusillus Schreber 1775) at Cape Cross (Namibia) (Theobald et al. Reference Theobald, Crittenden, Hunt, Tang, Dragosits and Sutton2006), suggesting an approximate recalculation of 36, 80 and 237 kgha-1 month-1 in the areas on Signy Island including macroplots A, B, C and D, respectively, on the basis of recent seal counts in the 2008 and 2009 summers. All these values are much higher than those used in controlled experiments on the effects of direct nitrogen supply on lichen-rich communities (e.g. 5.8 kgNha-1month-1 (Fremstad et al. Reference Fremstad, Paal and Möls2005), 4.1 kg N ha-1 month-1 (Nilsson et al. Reference Nilsson, Wardle, Zackrisson and Jäderlund2002)), which were found to have significant detrimental effects on several Cetraria and Cladonia species (in terms of frequency and cover decrease), but lower effects on other terricolous taxa (including species of the genera Alectoria, Sphaerophorus, Stereocaulon, which were also recorded in control plots but not in impacted areas in the current study) and mosses. Zoogenic disturbance was also shown to be a positive influence on terricolous lichen species richness (and biomass) in temperate and boreal regions, increasing their ability to compete with vascular plants (Bültmann & Daniëls Reference Bültmann and Daniëls2001). Addition of 35 kg N ha-1 yr-1 resulted in positive productivity responses of Antarctic communities of crustose lichens and Usnea fruticose communities (Wasley et al. Reference Wasley, Robinson, Lovelock and Popp2006). Moreover, the aerosol emission of NH3 by the fur seal colony at Cape Cross was suggested to support the development of widespread terricolous lichen communities for up to a few kilometres from the coast (Theobald et al. Reference Theobald, Crittenden, Hunt, Tang, Dragosits and Sutton2006).
If animal excretions were the dominant factor driving the disappearance of muscicolous-terricolous and fruticose lichens in fur seal areas, the high volatility and atmospheric transport of NH3 (about 3%), would also be expected to affect the areas immediately beyond the physical barriers which have restricted trampling by seals. Accordingly, measures of the isotopic composition (δ15N) of terricolous lichens (Cetraria aculeata, Cladonia gracilis, Ochrolechia frigida, Sphaerophorus globosus) and mosses showed that the external mineral nitrogen input into the terrestrial ecosystems of Signy Island is significantly affected by the presence of seal and penguin colonies (Bokhorst et al. Reference Bokhorst, Huiskes, Convey and Aerts2007).
The lichen communities of impacted plots had a higher species turnover than did control plots (as indicated by beta-diversity values), and were mainly characterized by crustose species described as nitrophilous (Øvstedal & Smith Reference Øvstedal and Smith2001). Similarly, deposition of animal products has been shown to influence lichen diversity in both the continental and maritime Antarctic, supporting nitrophilous lichen communities in seabird nesting areas (Smith Reference Smith1972, Leishman & Wild Reference Leishman and Wild2001) and in areas adjacent to penguin rookeries (Smykla et al. Reference Smykla, Wolek and Barcikowski2007).
The highest cover nitrophilous species, clustered together (Z1: Acarospora convoluta, Buellia russa, B. isabellina and Caloplaca sublobulata) and lying opposite to terricolous-muscicolous species in the PCoA analysis, were previously reported as characteristic of the crustose lichen sub-formation, and are mainly halophilous-ornithocoprophilous and seldom found far from the influence of cliff-breeding sea-birds (Smith Reference Smith1972). According to the CCA, the nitrogen content of soils seems to have a secondary effect on the dominance of these species in the different macroplots, with Buellia russa showing the highest tolerance. These species coexist with high cover common species of cluster X in plots with only low fur seal pressure (subplots of macroplot A mostly constitute cluster M), and with low cover and infrequent species in other fur seal plots (cluster N). Several of these species (clustered in Z2) are exclusive to fur seal plots and have also been reported on supralittoral and coastal rocks often used as bird perches (e.g. Acarospora macrocylos, Buellia latemarginata, B. subpedicellata, Caloplaca buelliae, Lecidella patavina, Lecidea spheniscidarum, Rinodina peloleuca, Turgidosculum complicatulum) (Smith Reference Smith2007). The abundance of the alga Prasiola crispa, which also dominates the areas adjacent to penguin rookeries (Smykla et al. Reference Smykla, Wolek and Barcikowski2007), further highlights nitrogen as a dominant ecological factor in these communities. Areas visited by birds thus most probably represent the source of species, mostly Antarctic endemic lichens that are not present in the current control areas, which have now occupied the areas influenced by fur seals that have been cleared of their previous communities of mosses and their associated terricolous-muscicolous lichens, largely comprising widely distributed species (i.e. cosmopolitan and bipolar). Lamb (Reference Lamb1970) also noted that that many of the Antarctic Peninsula endemic lichen species are ornithocoprophilous.
The type and coverage of vegetation has been shown to influence the active layer thermal regime and its thickness (Cannone et al. Reference Cannone, Ellis-Evans, Strachan and Guglielmin2006). Ground surface temperature (GST) is generally colder in moss-dominated (Sanionia) than in lichen-dominated sites (Usnea, Leptogium, or epilithic crustose lichens) (Cannone et al. Reference Cannone, Ellis-Evans, Strachan and Guglielmin2006, Guglielmin et al. Reference Guglielmin, Ellis-Evans and Cannone2008). Changes from terricolous rich lichen vegetation on mosses to communities dominated by crustose nitrophilous lichens could induce a general increase in GST over areas of Signy Island. This may be further enhanced by an increased growth rate of crustose species due to climate warming in the maritime Antarctic region, which has been shown to positively affect some species characteristic of seal-impacted lichen communities, such as Acarospora macrocylos, Buellia latemarginata and Caloplaca sublobulata, more than widespread species common to both impacted areas and controls (i.e. Rhizocarpon geographicum) (Sancho & Pintado Reference Sancho and Pintado2004).
Such potential impacts on the terrestrial ecosystem highlight the major importance of the observed changes in the cryptogamic vegetation of Signy Island coastal areas. The invasion by Antarctic fur seals has both stopped and reversed the development of moss turf and carpet sub-formations characteristic of coastal areas 40 years ago (Smith Reference Smith1972), and increased the presence of endemic, nitrophilous, saxicolous, crustose lichens. The effects of fur seals on lichen communities described here are thus a further example of the indirect impact of global environmental change having a greater or more immediate impact on terrestrial than marine ecosystems (Wall Reference Wall2005). How these changes affect biogeochemical cycles and influence feedback across Antarctic regions and habitats is poorly understood and requires further examination (Wall Reference Wall2005).
Acknowledgements
The authors wish to thank PNRA (Progetto Nazionale di Ricerca in Antartide) for providing funding and BAS (British Antarctic Survey) for logistical support to make this research possible. This paper is also a contribution to the BAS ‘Polar Science for Planet Earth’ and SCAR ‘Evolution and Biodiversity in Antarctica’ programmes.