





1 Introduction
Thermal convection is relevant to a wide range of applications across various fields, such as building ventilation (e.g. Linden Reference Linden1999), atmospheric (e.g. Hartmann, Moy & Fu Reference Hartmann, Moy and Fu2001) or oceanic (e.g. Rahmstorf Reference Rahmstorf2000) flows. The phenomenon is widely studied in terms of the paradigmatic case of Rayleigh–Bénard (RB) convection (see the reviews of Ahlers, Grossmann & Lohse Reference Ahlers, Grossmann and Lohse2009; Lohse & Xia Reference Lohse and Xia2010; Chillà & Schumacher Reference Chillà and Schumacher2012), in which two horizontal plates at a distance
 $L$
are cooled from above and heated from below. In the presence of a gravitational acceleration
 $g$
, a flow is driven with properties (for given Prandtl number
 $Pr\equiv \unicode[STIX]{x1D708}/\unicode[STIX]{x1D705}$
and aspect ratio
 $\unicode[STIX]{x1D6E4}=D/L$
) that are controlled by the Rayleigh number
 $Ra\equiv \unicode[STIX]{x1D6FC}g\unicode[STIX]{x0394}L^{3}\unicode[STIX]{x1D6E9}/(\unicode[STIX]{x1D708}\unicode[STIX]{x1D705})$
. Here,
 $\unicode[STIX]{x1D6FC}$
is the thermal expansion coefficient,
 $\unicode[STIX]{x1D708}$
and
 $\unicode[STIX]{x1D705}$
are kinematic viscosity and the thermal expansion coefficient, respectively,
 $D$
is some lateral length scale and
 $\unicode[STIX]{x0394}\unicode[STIX]{x1D6E9}\equiv \unicode[STIX]{x1D6E9}_{b}-\unicode[STIX]{x1D6E9}_{t}$
denotes the temperature difference between the bottom (held at
 $\unicode[STIX]{x1D6E9}_{b}$
) and top (
 $\unicode[STIX]{x1D6E9}_{t}$
) plates. The primary response parameter of the system is the resulting heat flux, which in its non-dimensional form is given by the Nusselt number
 $Nu$
relating the actual heat transfer to the one in the purely conductive case. The behaviour of the system at very high
 $Ra$
is of interest in many applications, and theoretical work (Kraichnan Reference Kraichnan1962; Spiegel Reference Spiegel1971; Grossmann & Lohse Reference Grossmann and Lohse2000, Reference Grossmann and Lohse2011) predicts the existence of a so-called ‘ultimate regime’, in which the scaling
 $Nu\propto Ra^{\unicode[STIX]{x1D6FD}}$
switches from the classical
 $\unicode[STIX]{x1D6FD}\leqslant 1/3$
(Malkus Reference Malkus1954) to
 $\unicode[STIX]{x1D6FD}>1/3$
. This transition is related to a change of the boundary layer (BL) structure, of both velocity and temperature, from a laminar to turbulent type. A transition in the
 $Nu$
scaling – as well as in the Reynolds number scaling – has indeed been observed experimentally, most convincingly by He et al. (Reference He, Funfschilling, Bodenschatz and Ahlers2012a
,Reference He, Funfschilling, Nobach, Bodenschatz and Ahlers
b
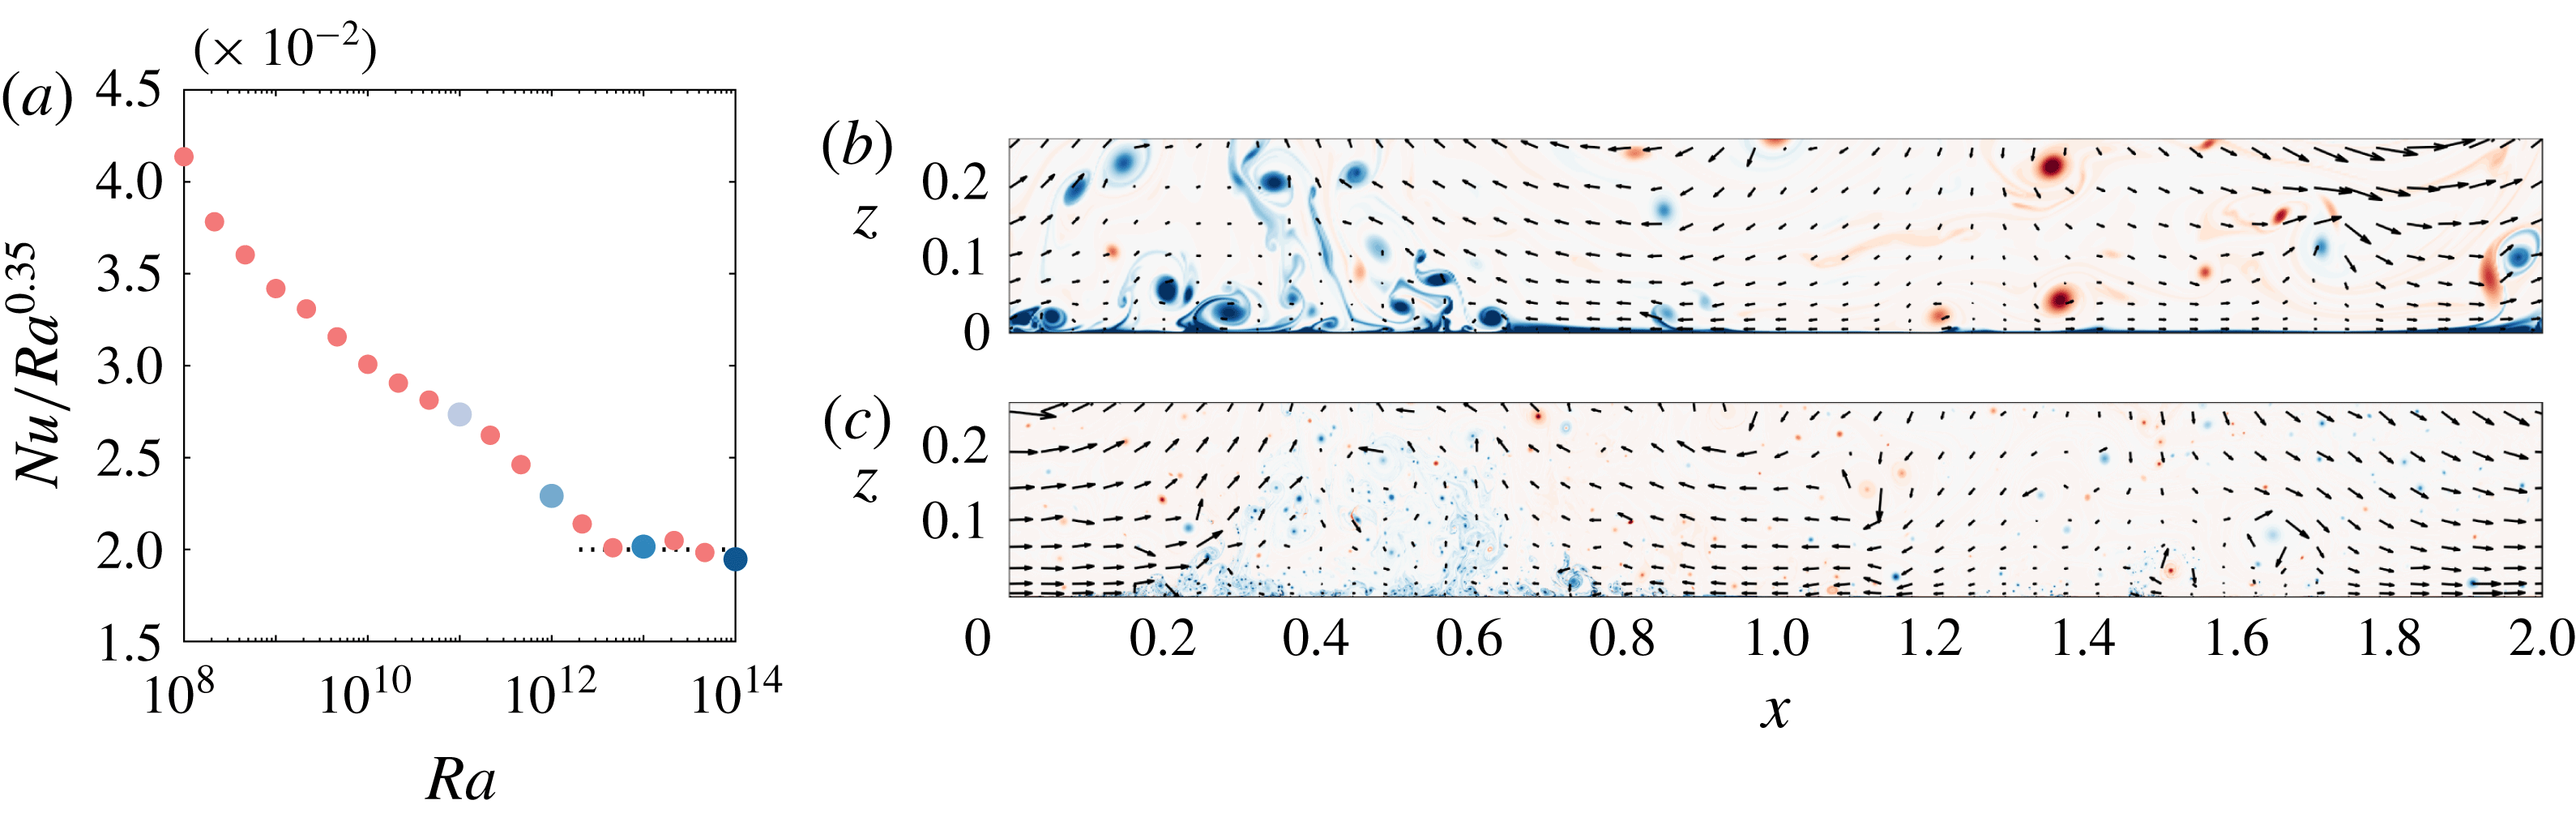
, Reference He, van Gils, Bodenschatz and Ahlers2015) and very recently also in a direct numerical simulation (DNS) of two-dimensional (2D) RB convection by Zhu et al. (Reference Zhu, Mathai, Stevens, Verzicco and Lohse2018). Results of the latter are reproduced in figure 1(a), where the transition is evident from the change in slope of the (compensated)
 $Nu$
at
 $Ra\approx 10^{13}$
. As expected from the theory and indicative of the turbulent nature of the BLs, Zhu et al. (Reference Zhu, Mathai, Stevens, Verzicco and Lohse2018) found logarithmic dependencies with respect to the distance from the wall for the mean temperature and velocity BLs. In the following, we will characterize the thermal BLs further by studying their lateral structure functions.
(a) Reduced Nusselt number
 $Nu/Ra^{0.35}$
from Zhu et al. (Reference Zhu, Mathai, Stevens, Verzicco and Lohse2018); blue symbols indicate the
 $Ra$
values investigated here. Note that the compensation with
 $Ra^{0.35}$
is chosen to highlight the transition and does not imply that the
 $Nu$
versus
 $Ra$
scaling saturates at this exponent. (b,c) Instantaneous snapshots of temperature (contours for
 $0.3\leqslant \unicode[STIX]{x1D703}/\unicode[STIX]{x0394}\unicode[STIX]{x1D6E9}\leqslant 0.7$
from blue to red) with rescaled velocity vectors at
 $Ra=10^{11}$
(b) and
 $Ra=10^{14}$
(c). Only a quarter of the vertical domain (
 $z$
-direction) is shown.
Such an analysis originated from Davidson, Nickels & Krogstad (Reference Davidson, Nickels and Krogstad2006), who pointed out that the
 $k^{-1}$
spectral scaling (
 $k$
being the streamwise wavenumber) of the streamwise velocity power spectrum predicted by the attached-eddy hypothesis (Townsend Reference Townsend1976; Perry & Chong Reference Perry and Chong1982), is equivalent to – and more readily observed as – a
 $\ln (r/z)$
scaling of the second-order longitudinal structure function. Here and in the following,
 $r$
denotes the streamwise separation distance and
 $z$
is the distance off the wall. De Silva et al. (Reference de Silva, Marusic, Woodcock and Meneveau2015) found that the
 $\ln (r/z)$
scaling also applies to velocity structure functions of arbitrary even order
 $2p$
such that for the so-called energy-containing range
 $z<r\ll \unicode[STIX]{x1D6FF}$
(
 $\unicode[STIX]{x1D6FF}$
being the boundary layer thickness, estimated to be of order of the gap half-width
 $L/2$
here)
 $$\begin{eqnarray}S_{p}^{u}\equiv \langle \unicode[STIX]{x0394}u^{2p}\rangle ^{1/p}/U_{\unicode[STIX]{x1D70F}}^{2}=E_{p}^{u}+D_{p}^{u}\ln \frac{r}{z}.\end{eqnarray}$$
Here
 $\unicode[STIX]{x0394}u(r,z)$
is the velocity increment between two points at a distance
 $z$
off the wall separated by
 $r$
along the streamwise direction,
 $U_{\unicode[STIX]{x1D70F}}$
is the mean friction velocity and
 $E_{p}^{u}$
,
 $D_{p}^{u}$
are constants. We use superscript
 $u$
to denote quantities relating to the velocity and
 $\unicode[STIX]{x1D703}$
when referring to the scalar later on. Note that (1.1) applies for scales larger than the inertial subrange
 $\unicode[STIX]{x1D702}\ll r\ll z$
, with
 $\unicode[STIX]{x1D702}$
being the Kolmogorov microscale (for an overview of all scaling regimes see Davidson et al. (Reference Davidson, Nickels and Krogstad2006)).
While the direct scaling according to (1.1) is only observed at relatively large Reynolds numbers
 $Re_{\unicode[STIX]{x1D70F}}=\unicode[STIX]{x1D6FF}U_{\unicode[STIX]{x1D70F}}/\unicode[STIX]{x1D708}\sim O(10^{4})$
, Krug et al. (Reference Krug, Yang, de Silva, Ostilla-Mónico, Verzicco, Marusic and Lohse2017) and de Silva et al. (Reference de Silva, Krug, Lohse and Marusic2017) have shown that a relative scaling is evident at much smaller
 $Re_{\unicode[STIX]{x1D70F}}$
if the so-called extended self-similarity (ESS) framework is employed. In this case, the scaling is not analysed as a function of
 $r$
but – in the spirit of the ESS hypothesis originally conceived for the Kolmogorov inertial range by Benzi et al. (Reference Benzi, Ciliberto, Tripiccione, Baudet, Massaioli and Succi1993, Reference Benzi, Ciliberto, Baudet and Chavarria1995) – relative to a structure function of different order. For an arbitrary reference order
 $2m$
this results in the ‘ESS form’ of (1.1), namely
 $$\begin{eqnarray}S_{p}^{u}=\frac{D_{p}^{u}}{D_{m}^{u}}S_{m}^{u}+E_{p}^{u}-\frac{D_{p}^{u}}{D_{m}^{u}}E_{m}^{u}.\end{eqnarray}$$
Krug et al. (Reference Krug, Yang, de Silva, Ostilla-Mónico, Verzicco, Marusic and Lohse2017) and de Silva et al. (Reference de Silva, Krug, Lohse and Marusic2017) found that the linear scaling of (1.2) could not only be observed at relatively low
 $Re_{\unicode[STIX]{x1D70F}}$
well within the capabilities of current DNS, but also that the relative slopes
 $D_{p}^{u}/D_{m}^{u}$
exhibit non-trivial, i.e. non-Gaussian, universal behaviour across various flow geometries, such as flat-plate boundary layers, pipe and channel flow and even Taylor–Couette flow. Krug et al. (Reference Krug, Yang, de Silva, Ostilla-Mónico, Verzicco, Marusic and Lohse2017) identified the fact that (1.2) relaxes a self-similarity assumption required for (1.1) as a potential explanation for the efficacy of the ESS formulation.
From our experience in Taylor–Couette flow (Krug et al. Reference Krug, Yang, de Silva, Ostilla-Mónico, Verzicco, Marusic and Lohse2017) we learnt that ESS scaling according to (1.2) is not observed if large-scale structures in the bulk (such as the Taylor rolls) contribute to the velocity component under investigation. This is also the case for the wall-parallel velocity component in RB convection, as can be seen from the snapshots in figure 1(b,c). Since no equivalent scaling exists for the wall-normal component (Perry & Chong Reference Perry and Chong1982), the 2D velocity field in RB convection is ruled out as a suitable candidate for this scaling analysis. Therefore, and due to the fact that velocity structure functions are found to be significantly less converged, the current study instead focuses on structure functions of the temperature field
 $$\begin{eqnarray}S_{p}^{\unicode[STIX]{x1D703}}(r)\equiv \langle \unicode[STIX]{x0394}\unicode[STIX]{x1D703}^{2p}\rangle ^{1/p}/\unicode[STIX]{x1D6E9}_{\unicode[STIX]{x1D70F}}^{2}.\end{eqnarray}$$
Here,
 $\unicode[STIX]{x0394}\unicode[STIX]{x1D703}$
and
 $\unicode[STIX]{x1D6E9}_{\unicode[STIX]{x1D70F}}=-\unicode[STIX]{x1D705}\unicode[STIX]{x2202}_{z}\unicode[STIX]{x1D6E9}|_{z=0}/U_{\unicode[STIX]{x1D70F}}$
are analogous to
 $\unicode[STIX]{x0394}u$
and
 $U_{\unicode[STIX]{x1D70F}}$
, respectively. ESS scaling of scalar structure functions in the energy-containing range has not been considered yet. It is, however, conceivable that the situation will be similar to velocity structure functions: the theory underlying (1.1) and (1.2) is based on an inertial assumption, which implies that momentum transport is dominated by turbulent eddies that are larger than and therefore constrained by
 $z\gg \unicode[STIX]{x1D702}$
but smaller than
 $\unicode[STIX]{x1D6FF}$
. In the spirit of the Reynolds analogy and for
 $Pr\approx 1$
these eddies can be assumed to affect momentum and scalar similarly. Consequently, the relevant arguments based on the attached-eddy hypothesis (see de Silva et al.
Reference de Silva, Marusic, Woodcock and Meneveau2015; Krug et al.
Reference Krug, Yang, de Silva, Ostilla-Mónico, Verzicco, Marusic and Lohse2017) can be expected to transfer to the scalar field as well. It is therefore our objective here to investigate whether and at what
 $Ra$
the thermal boundary layers in RB convection exhibit an ESS scaling according to
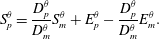 $$\begin{eqnarray}S_{p}^{\unicode[STIX]{x1D703}}=\frac{D_{p}^{\unicode[STIX]{x1D703}}}{D_{m}^{\unicode[STIX]{x1D703}}}S_{m}^{\unicode[STIX]{x1D703}}+E_{p}^{\unicode[STIX]{x1D703}}-\frac{D_{p}^{\unicode[STIX]{x1D703}}}{D_{m}^{\unicode[STIX]{x1D703}}}E_{m}^{\unicode[STIX]{x1D703}}.\end{eqnarray}$$
The expectation is that such a scaling regime should originate coinciding with the
 $Nu$
scaling transition, which has been link to the emergence of logarithmic boundary layers (Grossmann & Lohse Reference Grossmann and Lohse2011). Before moving ahead, we would like to mention that the attached-eddy framework, from which (1.1) and (1.2) can be derived (see Krug et al.
Reference Krug, Yang, de Silva, Ostilla-Mónico, Verzicco, Marusic and Lohse2017), is not new in the RB context. It has already been referred to by Ahlers, Bodenschatz & He (Reference Ahlers, Bodenschatz and He2014), who investigate logarithmic dependencies of temperature profiles, and by He et al. (Reference He, van Gils, Bodenschatz and Ahlers2014) in a study of
 $f^{-1}$
temperature power spectra scalings (the temporal equivalent to the
 $k^{-1}$
scaling) in order to interpret the observations made.
Since the dataset of Zhu et al. (Reference Zhu, Mathai, Stevens, Verzicco and Lohse2018) that will be employed for this endeavour is 2D, we will also check our results by using a three-dimensional (3D) channel simulation as a reference and for comparison. A brief overview over both datasets will given in § 2, before presenting our results in § 3 and conclusions in § 4.
2 Datasets
The simulations of Zhu et al. (Reference Zhu, Mathai, Stevens, Verzicco and Lohse2018) were performed using the second-order finite-difference code AFiD (van der Poel et al.
Reference van der Poel, Ostilla-Mónico, Donners and Verzicco2015) on a 2D domain with periodic boundary conditions in the lateral direction with
 $\unicode[STIX]{x1D6E4}=2$
and
 $Pr=1$
.
While the original dataset spans six decades
 $Ra\in [10^{8},10^{14}]$
, only four data points for
 $Ra\geqslant 10^{11}$
are used here (see figure 1
a). We refer to the original publication for further details on the numerical set-up and validation of the results. One of the particularities of the 2D set-up is that the large-scale structures, which can be observed in the vector maps of figure 1(b,c), remain almost fixed in place, allowing for simple temporal averaging. Since the temporal mean velocity gradient changes sign along the plate, we take the spatial mean of its absolute value when computing
 $U_{\unicode[STIX]{x1D70F}}$
in RB convection. For the present simulations we obtain friction Reynolds numbers
 $Re_{\unicode[STIX]{x1D70F}}\equiv L^{+}/2=LU_{\unicode[STIX]{x1D70F}}/(2\unicode[STIX]{x1D708})\approx [2400;5700;12\,300;34\,400]$
at
 $Ra=[10^{11};10^{12};10^{13};10^{14}]$
, respectively.
Differences and similarities between 2D and 3D RB convection are discussed in detail by Schmalzl, Breuer & Hansen (Reference Schmalzl, Breuer and Hansen2004) and van der Poel, Stevens & Lohse (Reference van der Poel, Stevens and Lohse2013). Here we only note that, with the exception of flows at high
 $Pr$
, 2D simulations of RB flow capture the integral behaviour well. In view of the fact that the Prandtl–Blasius boundary layer theory (Schlichting & Gersten Reference Schlichting and Gersten2000) as well as the additional scaling arguments put forward in Davidson et al. (Reference Davidson, Nickels and Krogstad2006) and de Silva et al. (Reference de Silva, Marusic, Woodcock and Meneveau2015) are essentially 2D, we do not expect significant differences in the behaviour of the BLs. An analysis of structure functions in the inertial range in the bulk of 2D RB convection is reported by Mazzino (Reference Mazzino2017).
A DNS of channel flow was performed using the fourth-order code described in Chung, Monty & Ooi (Reference Chung, Monty and Ooi2014) at
 $Re_{\unicode[STIX]{x1D70F}}=hU_{\unicode[STIX]{x1D70F}}/\unicode[STIX]{x1D708}=590$
, where
 $h$
is half the channel height. The periodic (in streamwise and spanwise directions) box of size
 $12h\times 4h\times 2h$
was discretized by
 $640\times 320\times 240$
grid points in the streamwise, spanwise and wall-normal directions, respectively. A passive scalar with
 $Pr=1$
was added with values fixed to
 $-0.5$
at the bottom wall and 0.5 at the top wall as boundary conditions.
Convergence of the statistics computed from both datasets was checked by plotting the premultiplied probability density function of
 $\unicode[STIX]{x0394}\unicode[STIX]{x1D703}$
at various
 $r$
, and found acceptable up to tenth order.
3 Results
3.1 Direct analysis of the scaling in the energy-containing range in RB convection
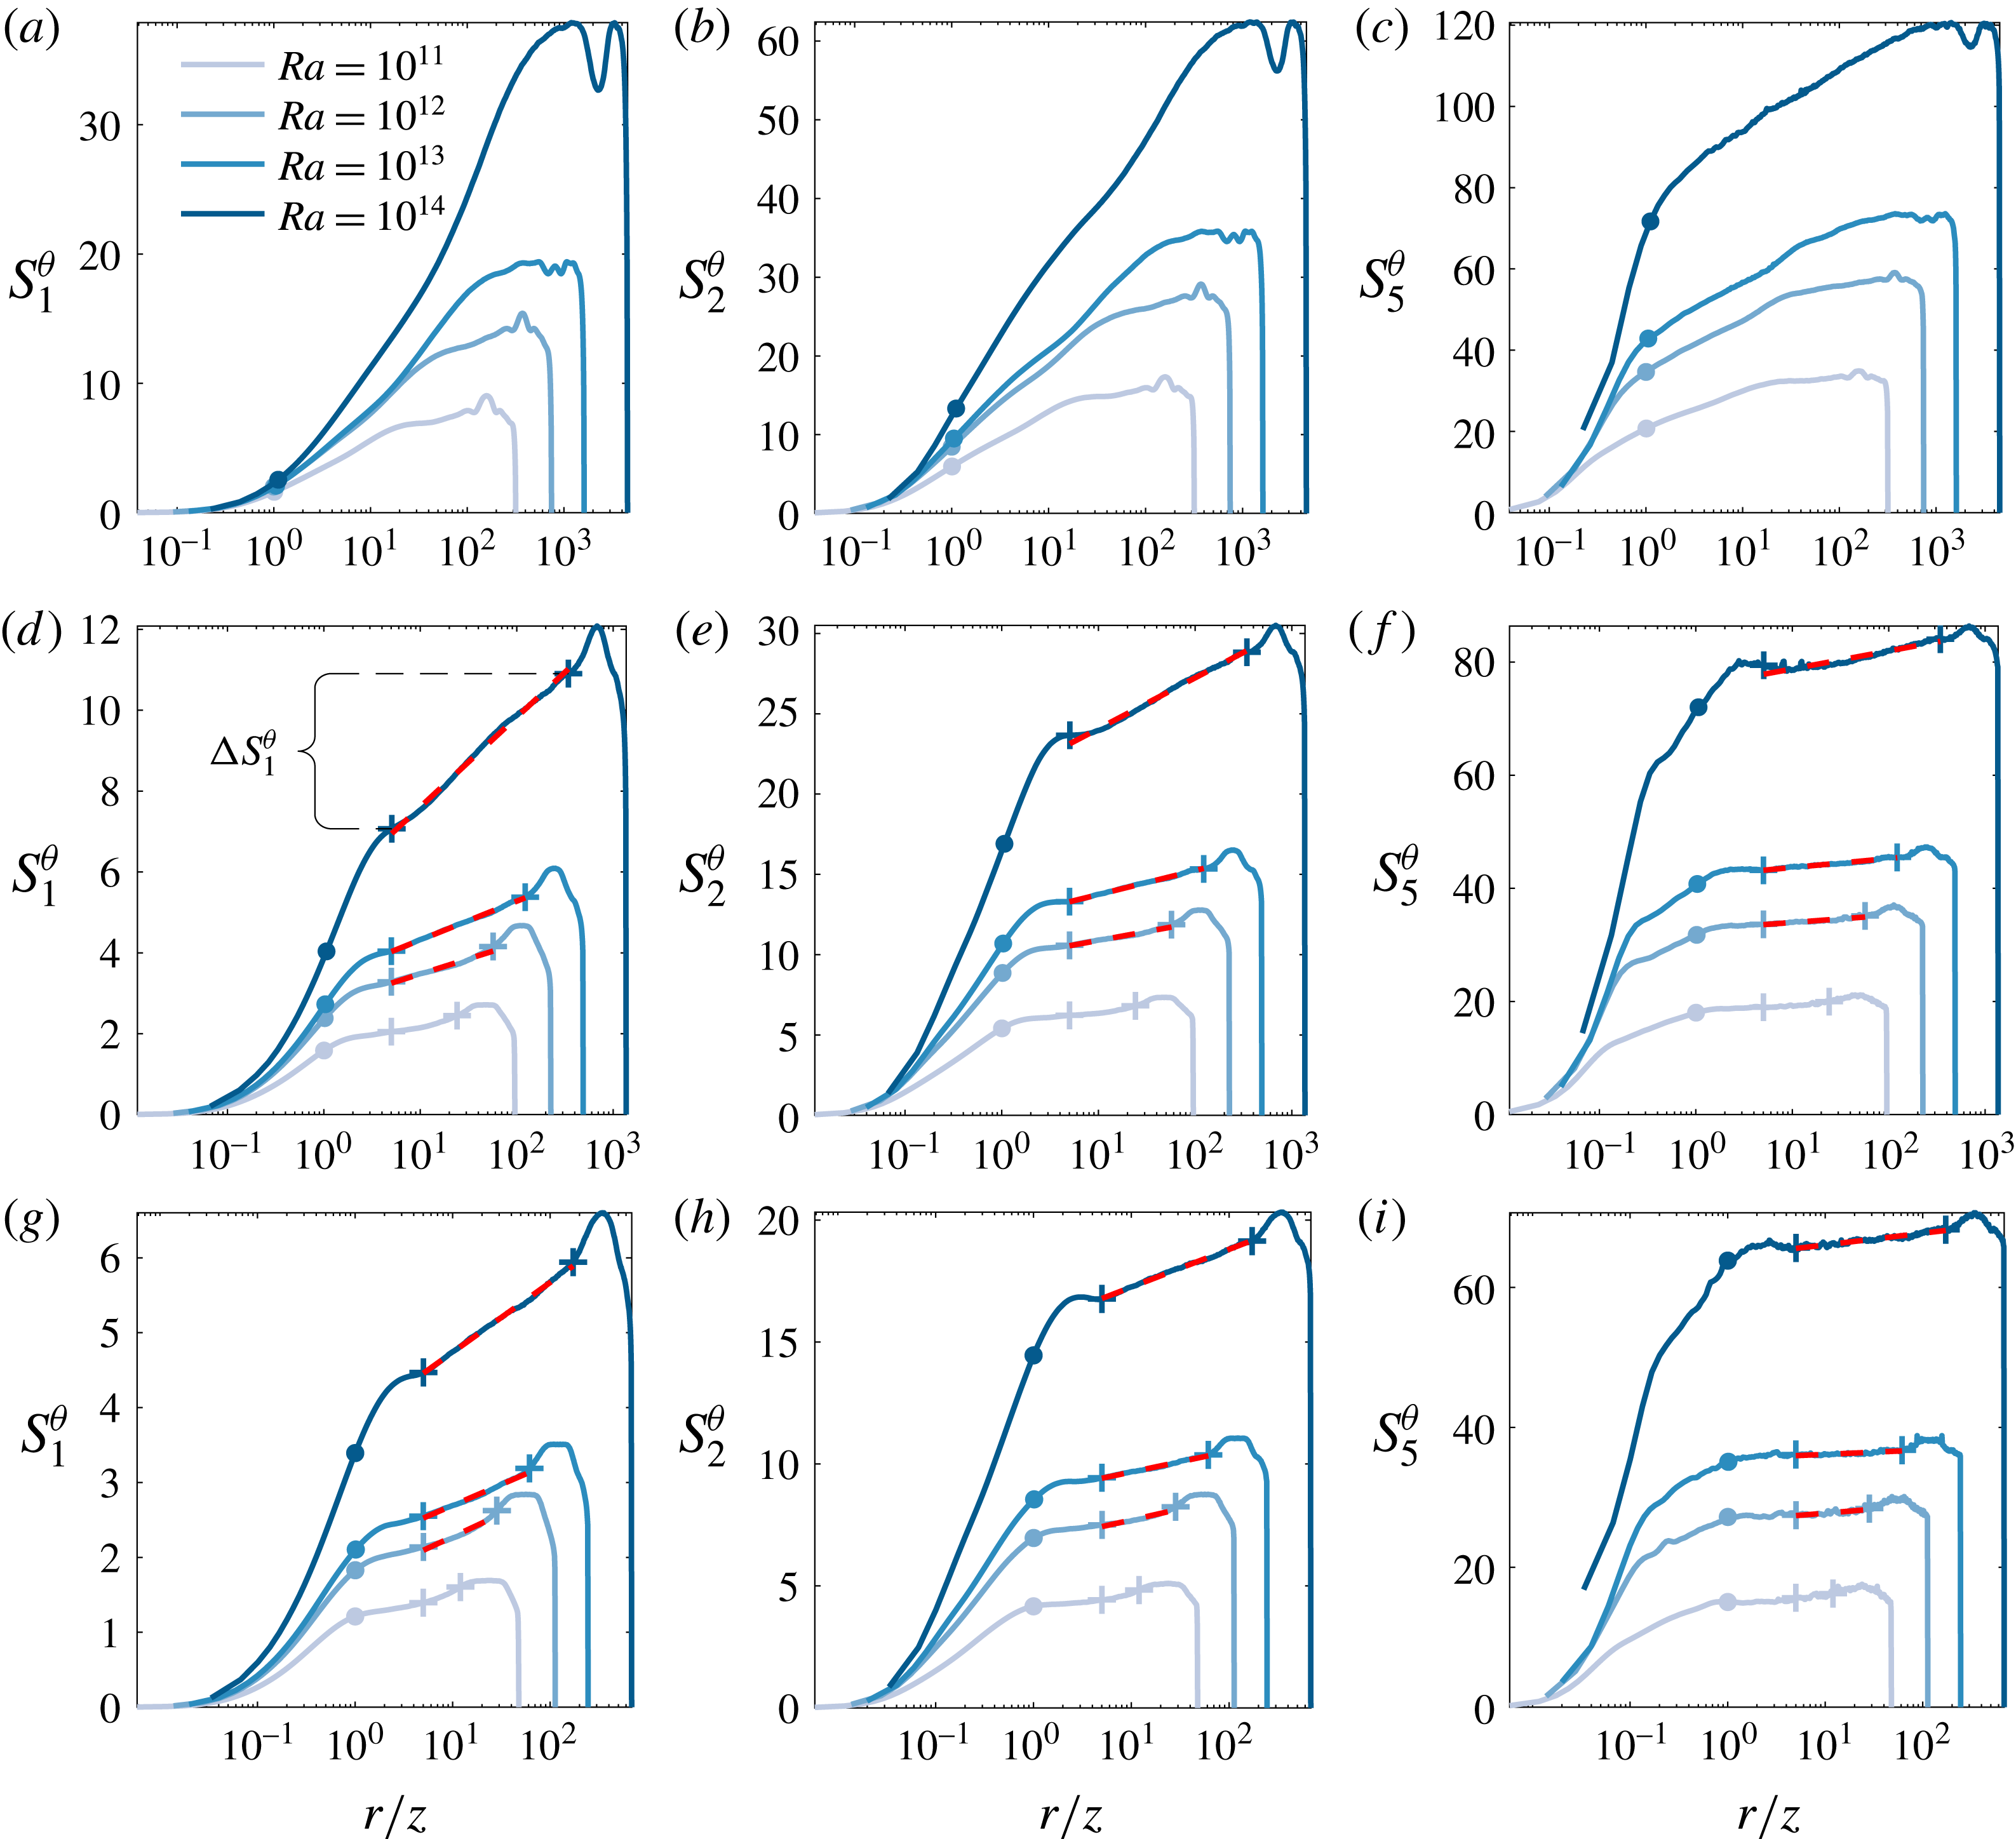
We begin by plotting structure functions of second, fourth and tenth order from 2D RB convection as a function of
 $r/z$
in figure 2. For all cases, we present results at three distances from the wall, namely
 $z^{+}=30$
(figure 2
a–c),
 $z^{+}=100$
(figure 2
d–f) and
 $z^{+}=200$
(figure 2
g–i), where as usual the superscript
 $+$
indicates normalization by
 $\unicode[STIX]{x1D708}/U_{\unicode[STIX]{x1D70F}}$
. Clearly, there is no scaling according to a scalar equivalent of (1.1) for either
 $Ra$
at the position closest to the wall (figure 2
a–c). However, in the other cases an approximately linear region appears for
 $r/z>1$
, making it tempting to fit the slopes directly. A fitting range
 $5z\leqslant r\leqslant 0.5L$
(indicated by crosses in the figure) captures this region quite well for all
 $Ra$
and the resulting fits are shown as red dashed lines. No fits are computed at the lowest
 $Ra$
, where the fitting range becomes prohibitively small.
Temperature structure functions of second (a,d,g), fourth (b,e,h) and tenth order (c,f,i) from 2D RB convection at three different locations off the wall:
 $z^{+}=30$
(a–c),
 $z^{+}=100$
(d–f) and
 $z^{+}=200$
(g–i) for various Rayleigh numbers. The legend in (a) applies to all panels. Red dashed lines represent fits in the range
 $5z\leqslant r\leqslant 0.5L$
, symbols mark
 $r/z=1$
(circles) and the extent of the fitting range (crosses), respectively, for later reference.
A detailed comparison of the values of
 $D_{p}^{\unicode[STIX]{x1D703}}$
obtained in this way (figure 3
a) reveals that the results depend on both
 $Ra$
and
 $z^{+}$
in the investigated range. Generally, values of
 $D_{p}^{\unicode[STIX]{x1D703}}$
are higher at
 $z^{+}=100$
, and this difference becomes larger with increasing
 $Ra$
. In most cases,
 $D_{p}^{\unicode[STIX]{x1D703}}$
is very low and it is only at
 $z^{+}=100$
and
 $Ra=10^{14}$
(and small
 $p$
) that the values of
 $D_{p}^{\unicode[STIX]{x1D703}}$
are of comparable magnitude to results for
 $D_{p}^{u}$
in high-
 $Re$
turbulent boundary layers (TBLs). We point out that the decrease of
 $D_{p}^{\unicode[STIX]{x1D703}}$
with increasing
 $p$
observed in some cases at higher
 $p$
is unphysical and likely related to the insufficient fitting range at higher orders (potentially in combination with somewhat inferior convergence at the highest orders). We further emphasize that even at high
 $Re$
a direct match between
 $D_{p}^{\unicode[STIX]{x1D703}}$
and
 $D_{p}^{u}$
is not necessarily expected. It is well established (see for example Warhaft Reference Warhaft2000, for passive scalars) that intermittency in the inertial range
 $\unicode[STIX]{x1D702}\ll r\ll z$
is higher for scalars as compared to the velocity itself. This translates to lower scaling exponents
 $\unicode[STIX]{x1D709}_{2p}$
in the corresponding scaling relation
 $S_{1}^{\unicode[STIX]{x1D703}}\sim (r/z)^{\unicode[STIX]{x1D709}_{2p}^{\unicode[STIX]{x1D703}}/p}$
as compared to the velocity counterpart
 $\unicode[STIX]{x1D709}_{2p}^{u}$
. From matching the inertial scaling with (1.1) at
 $r=z$
de Silva et al. (Reference de Silva, Marusic, Woodcock and Meneveau2015) semiempirically derived a linear relationship between
 $D_{p}^{u}$
and
 $\unicode[STIX]{x1D709}_{2p}^{u}$
, suggesting that (disregarding other dependencies) these differences may persist in the energy-containing range investigated here. However, a definitive answer to this question will have to be based on high-
 $Re$
data of the scalar field in wall-bounded turbulent flows.
(a) Slopes
 $D_{p}^{\unicode[STIX]{x1D703}}$
obtained from directly fitting the structure functions in the range
 $5z\leqslant r\leqslant 0.5L$
as indicated in figure 2 compared to high-
 $Re_{\unicode[STIX]{x1D70F}}$
reference data from de Silva et al. (Reference de Silva, Marusic, Woodcock and Meneveau2015). (b)
 $\unicode[STIX]{x0394}S_{1}^{\unicode[STIX]{x1D703}}$
as a function of
 $Ra$
normalized by
 $\unicode[STIX]{x0394}S_{1}^{\unicode[STIX]{x1D703}}(Ra=10^{14})$
. Colours indicate increasing
 $Ra$
from light to dark (see legend in figure 2).

While the direct analysis of the slopes
 $D_{p}^{\unicode[STIX]{x1D703}}$
remains inconclusive, additional insight can be gained from studying the second-order structure function
 $S_{1}^{\unicode[STIX]{x1D703}}$
. In this case, the difference
 $\unicode[STIX]{x0394}S_{1}^{\unicode[STIX]{x1D703}}=S_{1}^{\unicode[STIX]{x1D703}}(r_{2})-S_{1}^{\unicode[STIX]{x1D703}}(r_{1})$
between the structure function at two different separation distances
 $r_{1}$
and
 $r_{2}$
can be interpreted as the contribution of eddies with sizes in the range between
 $r_{1}$
and
 $r_{2}$
to the overall (scalar) energy. Consequently, when using the bounds of the log-linear scaling regime for
 $r_{1}$
,
 $r_{2}$
, as indicated in figure 2(d), this increment
 $\unicode[STIX]{x0394}S_{1}^{\unicode[STIX]{x1D703}}$
, characterizes the contribution of the energy-containing range to the overall energy. Note that here we adopted the bounds of the fitting region used above for simplicity, but other reasonable choices give qualitatively similar results. Figure 3(b), where
 $\unicode[STIX]{x0394}S_{1}^{\unicode[STIX]{x1D703}}$
is normalized by the result obtained at
 $Ra=10^{14}$
, shows that this quantity only increases mildly at low
 $Ra$
. However, it rises steeply between
 $Ra=10^{13}$
and
 $Ra=10^{14}$
, consistent with transitional behaviour in this range. No significant differences arise between
 $z^{+}=100$
and
 $z^{+}=200$
in this case.
3.2 Scalar ESS scaling in RB convection
We now focus on the relative scalings
 $D_{p}^{\unicode[STIX]{x1D703}}/D_{1}^{\unicode[STIX]{x1D703}}$
according to (1.4). The ESS framework has been demonstrated to extend the scaling regime not only to low
 $Re$
but also to a wider range of wall-normal distances. In particular, Krug et al. (Reference Krug, Yang, de Silva, Ostilla-Mónico, Verzicco, Marusic and Lohse2017) found convincing scaling for
 $D_{p}^{u}/D_{1}^{u}$
as low as
 $z^{+}=30$
. From figure 4(a–c), it is clear that the same does not hold for the scalar structure functions in 2D RB convection. Even at the highest
 $Ra$
, there is no linear relationship between
 $S_{1}^{\unicode[STIX]{x1D703}}$
and
 $S_{p}^{\unicode[STIX]{x1D703}}$
for any orders considered at this location. The situation improves at
 $z^{+}=100$
(figure 4
d–f), where particularly at the highest
 $Ra$
and low orders the curves begin to exhibit an approximately linear range. However, deviations become more apparent with increasing
 $p$
, and results at the higher orders in figure 4(e,f) demonstrate that the ESS scaling is not yet fully attained at this position. It is only at
 $z^{+}=200$
(figure 4
g–i) that a convincing ESS scaling according to (1.4) is obtained up to tenth order. The scaling range is well established at
 $Ra=10^{14}$
, already significantly decreases in size at
 $Ra=10^{13}$
, and is basically non-existent at
 $Ra=10^{11}$
. This behaviour is in very good correspondence to the changes in the
 $Nu$
scaling in figure 1(a), corroborating that the change in scaling observed there is indeed due to a transition in the BL structure from laminar (no scaling) to turbulent (with ESS scaling). It should be noted that, just as for velocity structure functions, ESS scaling at
 $z^{+}=200$
is observed for
 $r/z\gtrapprox 1$
for all
 $Ra$
, i.e. the spatial scaling range is the same. However, consistent with the results in figures 2 and 3(b), there is hardly any energy in this range at
 $Ra$
below transition to the ultimate regime. Remarkably, the relative slopes attained for the temperature structure functions in 2D RB convection at
 $z^{+}=200$
appear to be the same as those measured for their velocity counterparts and reported in de Silva et al. (Reference de Silva, Krug, Lohse and Marusic2017). This is remarkable since, as pointed out in § 3.1, the directly measured slopes
 $D_{p}^{\unicode[STIX]{x1D703}}$
and
 $D_{p}^{u}$
need not be the same.
Scalar structure functions from 2D RB convection plotted versus
 $S_{1}$
at
 $z^{+}=30$
(a–c),
 $z^{+}=100$
(d–f), and
 $z^{+}=200$
(g–i) for various
 $Ra$
(legend of figure 2 applies). Dashed lines correspond to the relative slopes
 $D_{p}^{u}/D_{1}^{u}$
from de Silva et al. (Reference de Silva, Krug, Lohse and Marusic2017) with the
 $y$
-axis cutoff fit at
 $S_{1}(r=5z)$
, symbols mark the locations of
 $r/z=1$
(circles) and the fitting region indicated in figure 2 (crosses) for reference.

3.3 Scalar ESS scaling in channel flow
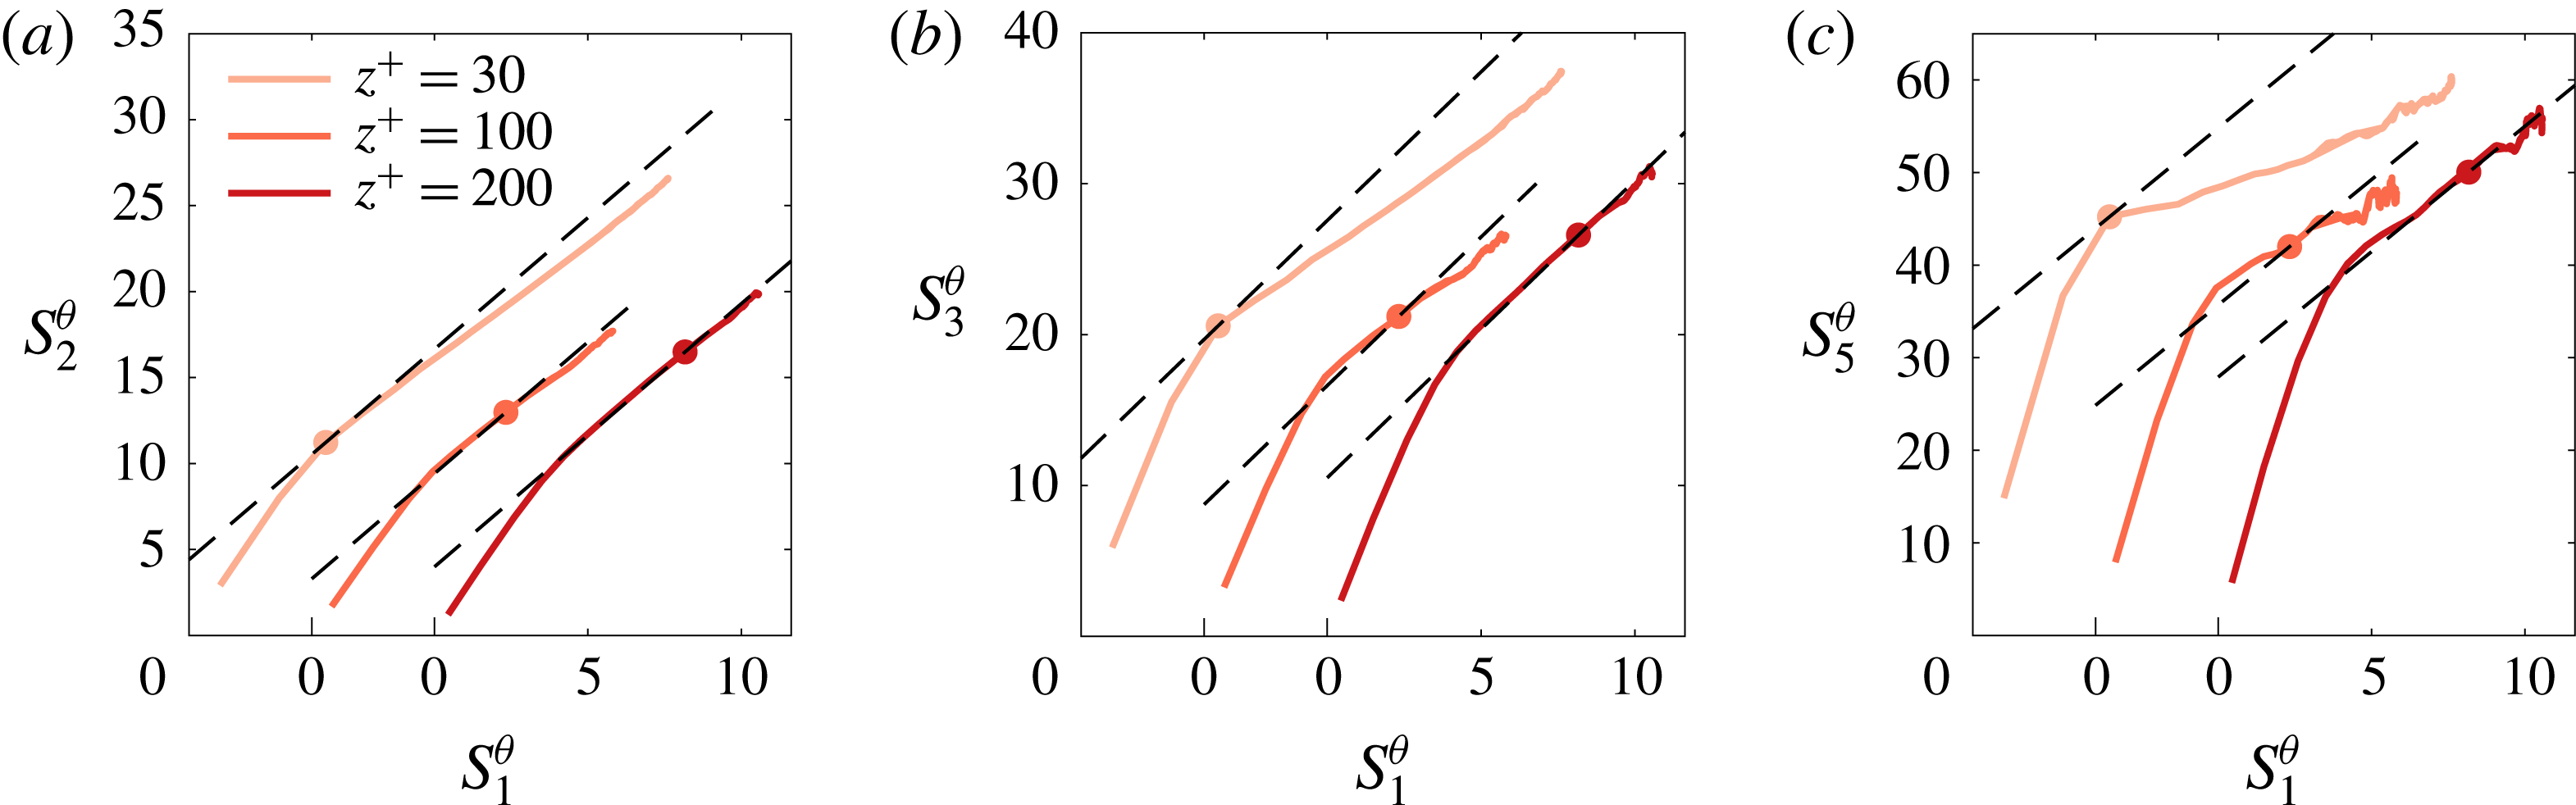
The question remains why ESS scaling is only observed at a larger distance from the wall in the present case as compared to previous findings for velocity structure functions. At this point, possible explanations to be considered are that this might be either a consequence of the 2D set-up, a property of RB convection or a feature of the scalar field. To address this, we present ESS results of scalar structure functions in turbulent channel flow in figure 5(a–c) at different orders. Indeed, the results are very similar to what was observed for 2D RB convection before, in that there is no ESS scaling for
 $z^{+}=30$
and
 $z^{+}=100$
. And again ESS scaling is recovered at
 $z^{+}=200$
, with relative slopes matching those measured for velocity structure functions, mirroring the observations made for RB convection. So the onset of ESS scaling slightly further off the wall seems to be a general feature of scalar fields.
Structure function results for a passive scalar in turbulent channel flow at
 $Re_{\unicode[STIX]{x1D70F}}=590$
in ESS form at fourth (a), sixth (b) and tenth order (c) relative to
 $S_{1}^{\unicode[STIX]{x1D703}}$
. Results at different
 $z^{+}$
are shifted by 4 on the
 $x$
-axis for clarity. Dashed lines correspond to the relative slopes
 $D_{p}^{u}/D_{1}^{u}$
from de Silva et al. (Reference de Silva, Krug, Lohse and Marusic2017) and circles indicate the location where
 $r=z$
for reference.
4 Discussion and conclusions
We have analysed the temperature boundary layers in the energy-containing range of 2D RB convection by means of temperature structure functions. Even though the RB structure functions exhibit log-linear scaling for
 $r/z\gtrapprox 1$
when plotted against separation distance, the slopes remain small at low
 $Ra$
. They were also found to vary significantly with both
 $Ra$
and
 $z^{+}$
, rendering the analysis inconclusive in this point. While a dependence of the slopes on
 $Re_{\unicode[STIX]{x1D70F}}$
and wall-normal position is also observed for velocity structure functions (see Krug et al.
Reference Krug, Yang, de Silva, Ostilla-Mónico, Verzicco, Marusic and Lohse2017), typically the log-linear scaling is much less evident in these cases compared to figure 2 at
 $z^{+}\geqslant 100$
. Also for the scalar in channel flow investigated here (plots not shown), a direct scaling regime is not discernible, such that it appears likely that the more prominent log-linear regimes in figure 2 are a consequence of the 2D set-up. An important point remains, however, that the contribution of the energy-containing range to the total energy increases significantly beyond
 $Ra=10^{13}$
, which coincides with the transition in
 $Nu$
versus
 $Ra$
scaling.
The main finding of the paper is the clear evidence that the temperature structure function in the BLs of turbulent 2D RB flows exhibit ESS scaling in the energy-containing range for large enough wall distances
 $z^{+}\gtrapprox 100$
. The extent of the scaling range thereby reflects the behaviour of
 $Nu$
very well in increasing from non-existent at
 $Ra=10^{11}$
(well in the classical regime) to considerable beyond the
 $Nu$
scaling transition at
 $Ra=10^{14}$
. This provides further evidence that the said transition is indeed related to a switch from laminar type to turbulent type thermal BLs. Given that the underlying scaling argument is 2D (Davidson et al.
Reference Davidson, Nickels and Krogstad2006; de Silva et al.
Reference de Silva, Marusic, Woodcock and Meneveau2015), we would expect a similar behaviour also in a 3D flow.
Moreover, we establish that the relative slopes for scalar structure functions in the ESS form are the same as those previously obtained when analysing velocity BLs. This is confirmed by comparing the RB results to those obtained in a planar channel geometry. In both cases, ESS scaling is only established at
 $z^{+}=200$
, which is different from velocity structure functions and appears to be a feature of the scalar field. Interestingly enough, already Perry & Chong (Reference Perry and Chong1982) pointed out differences between the scalar and the velocity field. They argued that at the end of the ‘lifetime’ of an eddy, the vorticity contributions in the two rods of the assumed hairpin cancel such that no induced velocity field remains. However, such a cancellation does not apply for the scalar transported by the eddy, such that the ‘debris’, as they called it, of past eddies sets up a scalar background profile. However, if and how exactly this is related to the observations made here remains unclear.
At least for the present cases, there also appears to be no difference between active (in RB flow) and passive (in the channel flow) scalars. In other regards, the deviations close to the wall underline, in addition to the fact the observed values of
 $D_{p}/D_{m}$
are sub-Gaussian, that the ESS scaling and the values of the relative slopes are indeed non-trivial.
Acknowledgements
The work was financially supported by NWO-I and the Netherlands Center for Multiscale Catalytic Energy Conversion (MCEC), both sponsored by the Netherlands Organization for Scientific Research (NWO). Part of the simulations were carried out on the Dutch national e-infrastructure with the support of SURF Cooperative. We also acknowledge PRACE for awarding us access to Marconi based in Italy at CINECA under PRACE Project No. 2016143351 and the DECI resource Archer based in the United Kingdom at Edinburgh with support from the PRACE aisbl under Project No. 13DECI0246. We also acknowledge the support of the Australian Research Council and the McKenzie Fellowship Program at the University of Melbourne.


 Open access

