Current proteomic methods
Seed proteins are important for human and animal nutrition and also serve as good markers in plant breeding and cultivar identification (Skylas and Wrigley, Reference Skylas, Wrigley, Wrigley, Walker and Corke2004; Yahata et al., Reference Yahata, Maruyama-Funatsuki, Nishio, Tabiki, Takata, Yamamoto, Tanida and Saruyama2005). Proteomics that provide information on the full set of polypeptides produced by genes of an organism expressed in a given cell, tissue or organ have contributed to the identification of genes that are expressed during seed development and maturation under given environmental conditions (Wasinger et al., Reference Wasinger, Cordwell, Cerpa-Poljak, Yan, Gooley, Wilkins, Duncan, Harris, Williams and Humphery-Smith1995; Skylas and Wrigley, Reference Skylas, Wrigley, Wrigley, Walker and Corke2004).
Two-dimensional gel electrophoresis (2-DE), with isoelectric focusing (IEF) in the first dimension and sodium dodecyl sulphate polyacrylamide gel electrophoresis (SDS-PAGE) in the second dimension, allows improved resolution of proteins in complex seed extracts with high reproducibility. Current proteomics using high-resolution 2-DE, in-gel digestion of protein spots, protein identification by mass spectrometry (MS) and database search, are advancing seed science by elucidating seed developmental processes (Gallardo et al., Reference Gallardo, Job, Groot, Puype, Demol, Vandekerckhove and Job2001; Rajjou et al., Reference Rajjou, Gallardo, Debeaujon, Vandekerckhove, Job and Job2004; Dong et al., Reference Dong, Pan and Liu2006; Yang et al., Reference Yang, Li, Wang, Chen, Chen and Shen2007), seed physiology responses to conditional changes (Gallardo et al., Reference Gallardo, Job, Groot, Puype, Demol, Vandekerckhove and Job2002; Komatsu et al., Reference Komatsu, Konishi, Shen and Yang2003; Higashi et al., Reference Higashi, Hirai, Fujiwara, Naito, Noji and Saito2006; Rajjou et al., Reference Rajjou, Belghazi, Huguet, Robin, Moreau, Job and Job2006), cultivar identification (Yahata et al., Reference Yahata, Maruyama-Funatsuki, Nishio, Tabiki, Takata, Yamamoto, Tanida and Saruyama2005; Kottapalli et al., Reference Kottapalli, Payton, Rakwal, Agrawal, Shibato, Burow and Puppala2008; Irar et al., Reference Irar, Brini, Goday, Masmoudi and Pagès2010; Laino et al., Reference Laino, Shelton, Finnie, De Leonardis, Mastrangelo, Svensson, Lafiandra and Masci2010; Scippa et al., Reference Scippa, Rocco, Ialicicco, Trupiano, Viscosi, Di Michele, Arena, Chiatante and Scaloni2010), and seed protein composition (Østergaard et al., Reference Østergaard, Melchior, Roepstorff and Svensson2002, Reference Østergaard, Finnie, Laugesen, Roepstorff and Svennson2004; Watson et al., Reference Watson, Asirvatham, Wang and Sumner2003; Merlino et al., Reference Merlino, Leroy, Chambon and Branlard2009). However, there is still a need to study seed protein composition more completely.
In many seed proteomic studies, proteins were identified mainly by MS analysis and database search. Among them, peptide mass fingerprinting (PMF) data acquired by matrix-assisted laser desorption/ionization time-of-flight (MALDI–TOF) MS is the most simple and powerful technique for rapid and high-throughout protein identification, where experimentally generated peptide masses are compared with masses of theoretically digested proteins. This approach has been applied successfully for seeds of some species whose genome has already been sequenced and fully annotated, such as Arabidopsis thaliana (Gallardo et al., Reference Gallardo, Job, Groot, Puype, Demol, Vandekerckhove and Job2001, Reference Gallardo, Job, Groot, Puype, Demol, Vandekerckhove and Job2002; Rajjou et al., Reference Rajjou, Gallardo, Debeaujon, Vandekerckhove, Job and Job2004, Reference Rajjou, Belghazi, Huguet, Robin, Moreau, Job and Job2006; Higashi et al., Reference Higashi, Hirai, Fujiwara, Naito, Noji and Saito2006) and rice (Komatsu et al., Reference Komatsu, Konishi, Shen and Yang2003; Yang et al., Reference Yang, Li, Wang, Chen, Chen and Shen2007). For species lacking full genome sequence information and having limited protein sequences referenced in protein databases, PMF data from seed proteins are usually used to search in the Swiss-Prot (http://www.uniprot.org), TrEMBL (Translated EMBL Nucleotide Sequence Database; http://www.uniprot.org/) and NCBInr (NationalCenter for Biotechnology Information nonredundant database; http://www.ncbi.nlm.nih.gov/) plant protein databases (Østergaard et al., Reference Østergaard, Melchior, Roepstorff and Svensson2002; Yahata et al., Reference Yahata, Maruyama-Funatsuki, Nishio, Tabiki, Takata, Yamamoto, Tanida and Saruyama2005; Dong et al., Reference Dong, Pan and Liu2006; Merlino et al., Reference Merlino, Leroy, Chambon and Branlard2009; Irar et al., Reference Irar, Brini, Goday, Masmoudi and Pagès2010; Scippa et al., Reference Scippa, Rocco, Ialicicco, Trupiano, Viscosi, Di Michele, Arena, Chiatante and Scaloni2010) or species-specific EST databases extracted from dbEST (http://www.ncbi.nlm.nih.gov) for seed protein identification (Watson et al., Reference Watson, Asirvatham, Wang and Sumner2003; Østergaard et al., Reference Østergaard, Finnie, Laugesen, Roepstorff and Svennson2004; Laino et al., Reference Laino, Shelton, Finnie, De Leonardis, Mastrangelo, Svensson, Lafiandra and Masci2010).
Precautions are required for cross-species protein identification using PMF data in the Swiss-Prot, TrEMBL and NCBInr protein databases because a risk of mis-identification is associated with this approach. Homology or conservation in protein sequence is the basis for protein identification with the cross-species protein database approach. However, polymorphism exists between different species at the amino acid level even in the most conserved proteins, which may result in mis-identification, if the MS data are affected by the polymorphism. This problem may be solved by querying the species-specific EST databases for protein identification using PMF data (Lisacek et al., Reference Lisacek, Traini, Sexton, Harry and Wilkins2001; Mathesius et al., 2002; Kim et al., Reference Kim, Kim, Kim, Kwon, Kim, Cho, Lee, Nam, Yang, Yoo and Park2003; Kwon et al., Reference Kwon, Kim, Kim, Kim, Kim, Park and Yoo2003). Many past proteomic studies for species without complete genome sequence were conducted mainly by cross-species protein database search or the same method combined with some assistance from species-specific EST sequence databases, but not solely by EST sequence databases (Østergaard et al., Reference Østergaard, Melchior, Roepstorff and Svensson2002; Yahata et al., Reference Yahata, Maruyama-Funatsuki, Nishio, Tabiki, Takata, Yamamoto, Tanida and Saruyama2005; Dong et al., Reference Dong, Pan and Liu2006; Merlino et al., Reference Merlino, Leroy, Chambon and Branlard2009; Irar et al., Reference Irar, Brini, Goday, Masmoudi and Pagès2010; Scippa et al., Reference Scippa, Rocco, Ialicicco, Trupiano, Viscosi, Di Michele, Arena, Chiatante and Scaloni2010). This was mainly due to the limited number of species-specific EST sequences available for such species. Many EST sequences are: (a) too short; (b) contaminated with vector or/and adaptor sequences; and (c) of low quality, which influences sequence coverage and score and following protein identification. Moreover, distinguishing a top candidate from the secondary sequences that matched the sequence of the top candidate with similar scores and sequence coverage is difficult.
In order to improve the accuracy and reliability of protein identification for species without full genome sequence information, we have developed a reliable method for protein identification by combining species-specific EST sequence database with PMF data searching.
Modified method
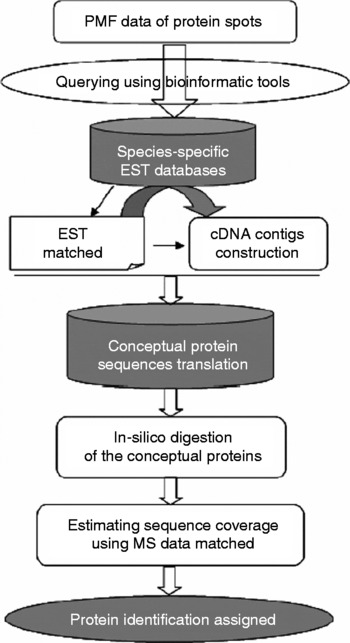
An overview of the proposed modified method is summarized in Fig. 1. The key steps of the method are:
(1) Protein spots in 2-DE gels are cut out and subjected to in-gel digestion and MALDI-TOF–MS analysis. Then PMF data from MALDI-TOF MS is calibrated;
(2) PMF data are used to query in the species-specific EST database by bioinformatics tools;
(3) ESTs corresponding to the peptide fragments matched are again used to search for EST homologues with higher sequence similarity in species-specific EST database to construct cDNA contigs;
(4) The contigs are translated to conceptual protein sequences and then subjected to in silico proteolytic digestion;
(5) Final sequence coverage is then estimated using peptide sequence fragments from MS that matched in m/z values to those obtained by in silico digestion of the conceptual proteins using Masspeptide program (http://www.expasy.ch);
(6) Protein identity is assigned when criteria are met.
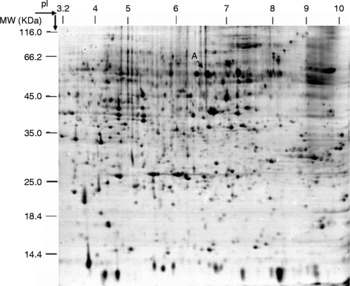
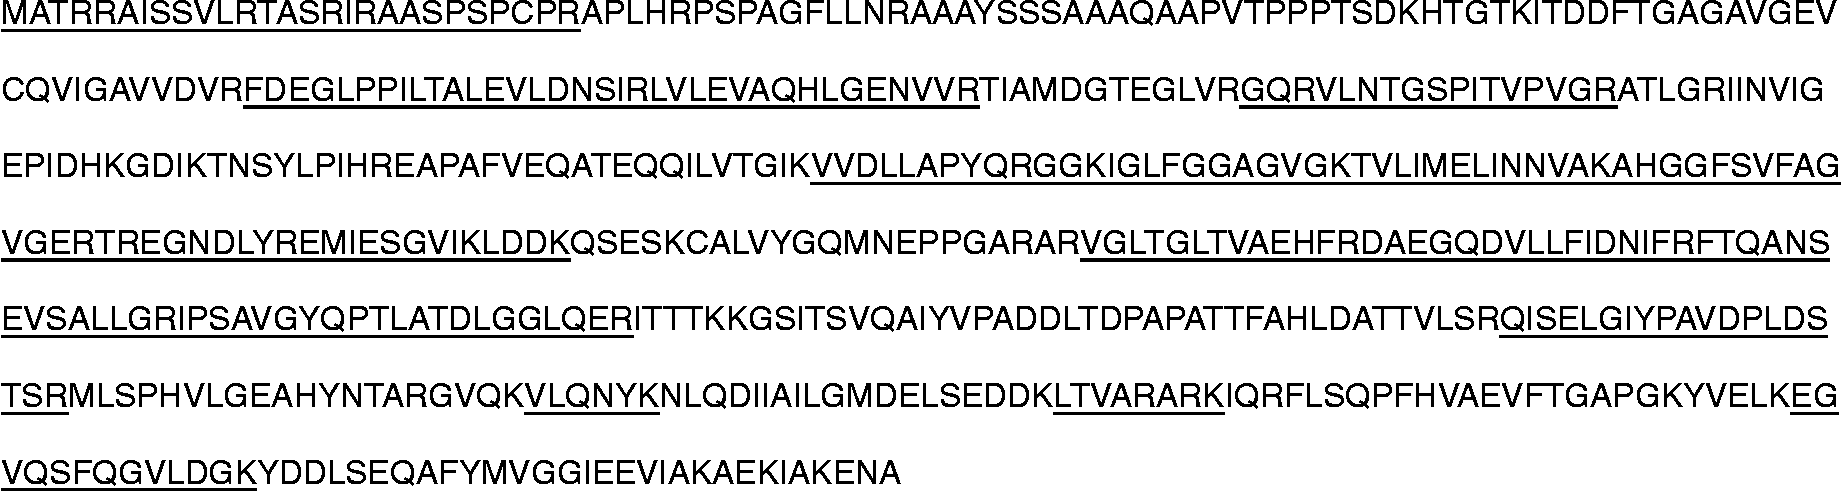
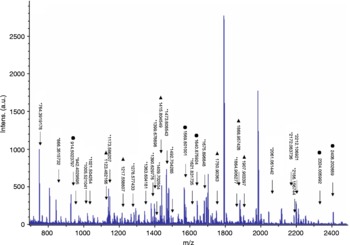
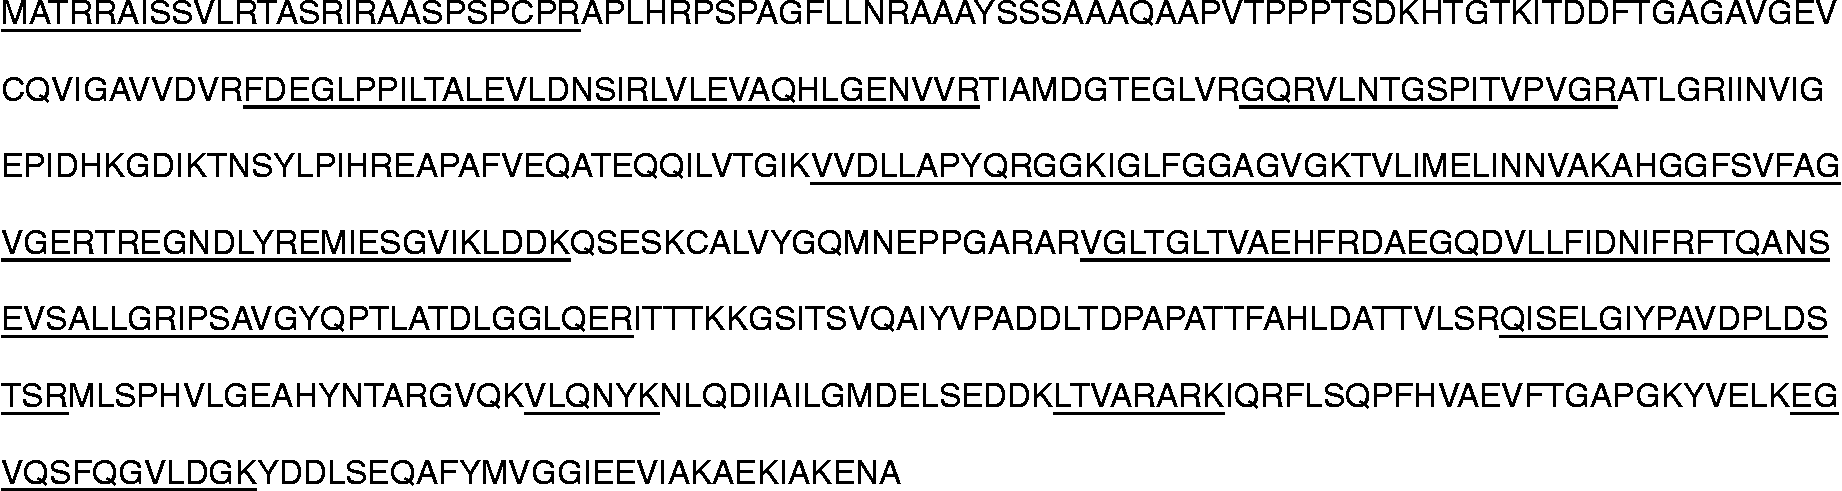
This method has been used to identify protein spots on a 2-DE gel for wheat seed proteomics. Through the query of PMF data of 80 protein spots in the wheat EST sequence database, the identity of 73 proteins was obtained with higher coverage (data not shown). Spot A was selected as an example to illustrate this method (Fig. 2). Spot A was cut, in-gel digested and analysed by MALDI-TOF MS. Spectra obtained were internally calibrated with peptides from trypsin autolysis (842.509 Da, 2211.104 Da) (data not shown). PMF data search of spot A was performed by a local Mascot program (http://www.matrixscience.com) against the wheat EST sequences downloaded from NCBI dbEST databases, with a mass tolerance of 50 ppm and the settings of Cys by carbamidomethylation, oxidation of Met, and trypsin digestion with one incomplete cleavage. Among candidates, each EST sequence matched, including EST BJ258725, was again used to search EST homologues with at least 40-base overlap and >94% sequence similarity in the wheat EST database to construct cDNA contigs (ESTs used in contig splicing and contig from EST BJ258725, data not shown). The open reading frame was predicted and translated to the conceptual proteins (Fig. 3). Final sequence coverage was 47.5%, which was estimated using peptide sequence fragments from MALDI-TOF MS that matched in m/z values to those obtained by in-silico digestion of the conceptual proteins translated from the contig using Masspeptide program (http://www.expasy.ch) with the settings of Cys by carbamidomethylation, oxidation of Met, trypsin digestion with one incomplete cleavage, and a mass tolerance of 50 ppm (Figs 3 and 4). Protein identification of spot A was assigned to ATPase beta subunit with a coverage of 47.5% and 20 peptides matched.
A flow chart providing an overview of the species-specific EST-based protein identification in seed proteomic profiles. See text for details of the procedure in each step.

An image of a 2-DE gel of wheat seed visualized by silver staining. Protein spot A that was used as an example to describe the modified protein identification method is indicated by an arrow.

The conceptual protein sequence for the Spot A protein identified in Fig. 2. The parts of sequences that matched PMF data are underlined.
MS profile of protein spot A and peaks that matched peptides. * Peptide matched with 0 missed cleavage; ▲ peptide matched with one missed cleavage; ● peptide matched with two missed cleavages. (See online for a colour version of this figure.)

Proteomics has become a major field of expression analysis in molecular genetic research. Detection, identification and quantification of proteins by 2-DE in organs, tissues, cells and organelles in a biological entity constitute an essential step in gathering genomic knowledge. Despite the limited number of protein sequences in protein databases and the lack of genome sequence for some species, considerable progress has been made in large-scale EST sequencing projects of plants (for a complete list, see http://www.ncbi.nlm.nih.gov/dbEST/dbEST_summary.html and http://www.ncbi.nlm.nih.gov/genomes/PLANTS/PlantList.html). The rapidly growing EST databases will provide a useful source of information for protein identification in seed proteomic research.
Our research has demonstrated that the use of species-specific EST databases with the strategies described here will overcome the risk of cross-species databases querying and improve the efficiency and reliability of protein identification for species whose genomes are not fully sequenced and annotated.
Method details
Extraction of wheat seed proteins
Wheat cultivar Ourou was used. Protein was extracted according to Damerval et al. (Reference Damerval, Devienne, Zivy and Thiellement1986) with modification. Wheat seeds were ground and homogenized and the proteins were precipitated at − 20°C with 10% (w/v) trichloroacetic acid (TCA) in acetone containing 0.07% (w/v) dithiothreitol (DTT) for 1 h. After centrifuging for 30 min at 15,000 g at 4°C, the precipitates were washed with ice-cold acetone containing 0.07% (w/v) DTT, to remove polysaccharides, pigments and lipids, until the pellets were colourless. The pellets were dried by vacuum centrifugation and resuspended for 30 min at room temperature in extraction buffer containing 8 M urea, 4% (w/v) 3[(3-cholamidopropyl)-dimethylammonio]-1-propane sulphonate (CHAPS), 20 mM DTT, 0.2% (v/v) carrier ampholyte (pH 3.0–10.0), protease inhibitor cocktails in an amount of 1 μl per 30 mg plant tissue (Sigma, St. Louis, Missouri, USA). During the suspension, the mixture was sonicated five times on ice, 30 s per sonication. Supernatant was obtained by centrifugation at 40,000 g for 30 min and stored at − 80°C. Protein extracts were quantified with the Bradford method (Bradford, Reference Bradford1976) with bovine serum albumin as a standard.
Two-dimensional gel electrophoresis
Three hundred micrograms of proteins were separated by iso-electrophoresis using the immobilized pH gradient (IPG) strips (pH 3.0–10.0, linear, 17 cm) in the Protean system (BioRad, Hercules, California, USA). IPG strips were rehydrated passively for 13 h. The voltage settings were as follows: 250 V for 1 h, 500 V for 1 h, 2000 V for 1 h, then 5000 V which was maintained until a total of 60,000 Vh was reached. After IEF and equilibration, the second-dimensional electrophoresis was conducted in 12.5% SDS-PAGE gels at 2 W/gel for 45 min and 12 W/gel for 4 h using the Multiphor system (Amersham Biosciences, Piscataway, New Jersey, USA). Duplicate gels were prepared under the same conditions, and were subjected to silver staining to visualize the protein spots (Shevchenko et al., Reference Shevchenko, Wilm, Vorm and Mann1996). The visualized protein spots were then isolated for MS.
ESI-MS/MS analysis of protein spots and protein identification
High performance liquid chromatography–electrospray tandem mass spectrometry (HPLC ESI-MS/MS) analysis was conducted as following: LC was performed on a surveyor LC system (Thermo Finnigan, San Jose, California, USA). The C18 column was obtained from Column Technology (Broadway, New York, USA). Mobile phase A was 0.1% formic acid in water, and mobile phase B was 0.1% formic acid in acetonitrile. The tryptic peptide mixtures were eluted using a gradient of 2–98% B over 180 min. The MS/MS was performed on a LTQ linear ion trap mass spectrometer (Thermo Finnigan) equipped with an electrospray interface and operated in positive ion mode. The capillary temperature was set to 170°C, and the spray voltage at 3.4 kV. Full scan mass spectra were obtained by the Orbitrap at 300–2000 m/z with a resolution of 30,000. The three most intense ions were determined at a threshold above the 1000 ion trap at a normalized collision energy of 35%. Automated peak recognition, dynamic exclusion and daughter ion scanning of the top two most intense ions were performed using the Xcalibur software. The peptide tags were submitted to sequence query in a local SEQUEST or MASCOT program (http://www.matrixscience.com) for database searching against wheat EST sequences. The search parameters used were as follows: monoisotopic peptide masses, 0.2 Da peptide mass tolerance; one missed cleavage, modifications allowed for oxidation of methionine and carboxyamidomethylation of cysteine. The criteria for a preliminary positive peptide identification for a doubly charged peptide were a correlation factor (Xcorr) greater than 2.5, a delta cross-correlation factor (ΔXcorr) greater than 0.1 (indicating a significant difference between the best match reported and the next best match), a minimum of one tryptic peptide terminus, and a high preliminary scoring. For triply charged peptides the correlation factor threshold was set at 3.5. All matched peptides were confirmed by visual examination of the spectra.
Acknowledgements
We gratefully acknowledge the nice and helpful comments and suggestions that we have received from Dr Hiro Nonogaki and the anonymous reviewers. The development of this paper has benefited substantially from their suggestions and comments. This project was supported by grants from National Science Foundation of China (No. 30900871; 30900871; 30801016; 30972822) and Natural Science Foundation of Jiangshu Higher Education Institutions in China (No. 09KJB210001), from ‘Ke jiao xing wei gong cheng’ of Jiangsu Province (No. KF200926), and Excellent Youth Foundation of Huaiyin Normal University (No. 08QNZCK09).