INTRODUCTION
Secondary production is the formation of heterotrophic biomass through time (Benke, Reference Benke1993; Benke & Huryn, Reference Benke, Huryn, Hauer and Lamberti2006), and from the standpoint of ecosystem functioning, it is the main way by which energy is made available for transmission from one trophic level to the next (Waters, Reference Waters1977). This functional variable has been used, mainly in freshwater ecosystems, in studies on a wide range of ecological issues including biotic interactions, effects of human disturbance, and the importance of macrofauna versus meiofauna, among others (Benke & Huryn, Reference Benke, Huryn, Hauer and Lamberti2006, Reference Benke and Huryn2010 and references therein; Benke, Reference Benke2010). Estimates of secondary production have been particularly effective for these analyses because they integrate a number of other ecological performance components, such as density, biomass, individual growth rate, reproduction, survivorship, and development time (Benke, Reference Benke1993; Benke & Huryn, Reference Benke, Huryn, Hauer and Lamberti2006). Production estimates are essential for the implementation of mass balance trophic models (e.g. Lercari et al., Reference Lercari, Bergamino and Defeo2010).
Well-established patterns for secondary production and the turnover rate (P/B ratio) have been determined for freshwater macroinvertebrates (e.g. Benke, Reference Benke1993), and Cusson & Bourget (Reference Cusson and Bourget2005) recently examined global patterns of macroinvertebrate production in marine benthic habitats. These patterns refer to relationships between P/B and biological (e.g. life span and mean body mass) and environmental (e.g. temperature and depth) variables (Benke, Reference Benke1993; Brey & Clarke, Reference Brey and Clarke1993; Cartes & Sorbe, Reference Cartes and Sorbe1999; Cartes et al., Reference Cartes, Brey, Sorbe and Maynou2002; Cusson & Bourget, Reference Cusson and Bourget2005; Huryn & Benke, Reference Huryn, Benke, Hildrew, Raffaelli and Edmonds-Brown2007). Production and P/B ratios have also been compared for several taxonomic and functional groups (Benke, Reference Benke1993; Cusson & Bourget, Reference Cusson and Bourget2005). In contrast, despite the ecological and economic importance of sandy-beach macrofauna, knowledge of the secondary production of these organisms is still incipient, particularly regarding specific patterns.
Sandy beaches dominate the world's temperate and tropical shorelines. These important transitional habitats are highly variable, and support a peculiar macrofauna that is adapted to living in harsh physical conditions. Several species of the intertidal sandy-beach macrofauna are harvested extensively around the world in recreational, artisanal, and commercial fisheries (McLachlan et al., Reference McLachlan, Dugan, Defeo, Ansell, Hubbard, Jaramillo and Penchaszadeh1996; McLachlan & Brown, Reference McLachlan and Brown2006). Many species of beach macrofauna play a major role as food for other marine and terrestrial species, including commercially important fish and crustaceans (Peterson et al., Reference Peterson, Summerson, Thomson, Lenihan, Grabowski, Manning, Micheli and Johnson2000; McLachlan & Brown, Reference McLachlan and Brown2006). In addition, the sandy-beach ecosystem is frequently subject to many forms of human-induced stress, such as oil spills, contaminated freshwater discharges, and structures or activities affecting natural sand transport, among others, which can affect the macrofauna of these ecosystems (Schlacher et al., Reference Schlacher, Dugan, Schoeman, Lastra, Jones, Scapini, McLachlan and Defeo2007; Dugan et al., Reference Dugan, Hubbard, Rodil, Revell and Schroeter2008; Defeo et al., Reference Defeo, McLachlan, Schoeman, Schlacher, Dugan, Jones, Lastra and Scapini2009).
For sandy-beach macrofauna communities, several patterns have been established for species richness, abundance, and biomass according to the exposure and morphodynamic states of the beach, and over a latitudinal range encompassing temperate to tropical sandy beaches (McLachlan, Reference McLachlan, McLachlan and Erasmus1983; Dexter, Reference Dexter1992; Defeo & McLachlan, Reference Defeo and McLachlan2005, Reference Defeo and McLachlan2011; McLachlan & Dorvlo, Reference McLachlan and Dorvlo2005). At the species level, life-history traits show recurrent patterns, according to the morphodynamic state and latitudinal gradient of beaches (Defeo & Cardoso, Reference Defeo and Cardoso2002, Reference Defeo and Cardoso2004; Cardoso & Defeo, Reference Cardoso and Defeo2003, Reference Cardoso and Defeo2004; Celentano et al., Reference Celentano, Gutiérrez and Defeo2010; Petracco et al., Reference Petracco, Cardoso, Turra and Corbisier2012). However, few investigators have attempted to determine the patterns of production and productivity of the macrofauna in these ecosystems (e.g. Cardoso & Veloso, Reference Cardoso and Veloso2003; Herrmann et al., Reference Herrmann, Carstensen, Fisher, Laudien, Penchaszadeh and Arntz2009; Petracco et al., Reference Petracco, Cardoso, Turra and Corbisier2012). Therefore, this study aimed to: (1) examine relationships of the biomass, production and P/B ratios of the sandy-beach macrofauna populations with environmental (temperature/latitude, exposure, grain size and beach slope) and biotic (mean body mass and life span) variables; and (2) determine the trends of biomass, production and P/B ratio among taxonomic and feeding groups of these environments.
MATERIALS AND METHODS
Dataset collection
A broad literature review on secondary production of sandy-beach macrofauna populations was performed, including the values of annual production, the mean annual biomass, and the P/B ratio. Production estimates obtained with classical methods (cohort-based and size-based methods: sensu Cusson & Bourget, Reference Cusson and Bourget2005) and with balanced ecosystem models (Lercari et al., Reference Lercari, Bergamino and Defeo2010) were included in the dataset. From each study, life span and mean body mass were recorded as biotic variables. Life span was available in most of the studies, and the mean body mass was usually calculated by dividing the mean annual biomass by the mean annual density. The feeding mode of each species was classified according to three broad categories, namely filter-feeders, scavengers/predators and deposit-feeders (sensu Defeo & McLachlan, Reference Defeo and McLachlan2011).
The latitude of the study area and the local environmental variables, including the mean water temperature, beach exposure (sheltered or exposed beach, sensu McLachlan, Reference McLachlan1980), morphodynamic state (dissipative, intermediate or reflective, sensu Short, Reference Short1996), mean grain size, and beach-face slope were also recorded. For studies that did not measure or report the mean annual water temperature, this variable was obtained from other studies carried out in the same area or nearby. Production and biomass data expressed in linear metres (m−1) were transformed into square metres by dividing these values by the width of the population distribution on the beach. Whenever necessary, production, biomass, and mean body mass were converted to ash-free dry mass (AFDM) using the conversion factors of Ricciardi & Bourget (Reference Ricciardi and Bourget1998), Brey et al. (Reference Brey, Rumohr and Ankar1988), and Brey (Reference Brey2001). For the statistical analyses, if more than one classical method was employed to estimate the annual production for a population, a mean estimate of production and a mean P/B ratio were calculated. However, when the population production was estimated for two years of sampling, the two estimates of production, mean annual biomass, and P/B ratios were included in the statistical analyses. The inclusion in the dataset of two estimates of biological descriptors per population did not bias the dataset, since this procedure was performed for several species from different beaches.
Data analysis
The relationships of the biomass, production, and P/B ratio with environmental variables (seawater temperature, grain size, beach slope) and latitude were investigated. These relationships were calculated by including either all populations from the dataset (macrofauna) or populations differentiated in the following taxonomic groups: (i) Mollusca and Crustacea (first taxonomic level); and (ii) Bivalvia, Gastropoda, Amphipoda, Isopoda, Decapoda, and Polychaeta (second taxonomic level). When one of these relationships proved significant, the relationships between mean body mass and the environmental variables were also assessed, since the body mass was significantly related to these three biological descriptors (see Results). Grain size and beach slope were included in these analyses since these two parameters can be used as measures of the morphodynamic state of a beach (Defeo & McLachlan, Reference Defeo and McLachlan2011) and were more frequently available in the studies than Dean's parameter. The relationships were modelled by linear or non-linear fitting procedures, and the best fit was selected.
The second taxonomic level included different taxonomic levels, i.e. classes (Bivalvia, Gastropoda, and Polychaeta) and orders (Amphipoda, Isopoda and Decapoda). However, the objective of this study was not to compare the production and P/B ratio between groups of the same taxonomic level (e.g. order), but rather to compare these variables among the groups that are most representative of sandy beaches, which may differ in life-history traits and consequently in the biomass, production, and P/B ratio.
Since the data were not evenly represented across all sources of variation (e.g. temperature or latitude; see Results), one-way analyses of covariance (ANCOVA) were also performed to assess the biological descriptors according to abiotic variables. The seawater temperature was used as a covariate in ANCOVAs, since temperature was significantly related to all biological descriptors of the macrofauna (except the P/B ratio: see results). For the P/B ratios, the body mass was used as a covariate. Life span was strongly related to the P/B ratio and thus could be used as a potential covariate in ANCOVAs. However, life span could not be used as a covariate because in many cases the assumption of the homogeneity of slopes of ANCOVA was not satisfied. Since the dataset was not balanced among the different factors (latitude, exposure and morphodynamic state of beaches and taxonomic groups), it was not possible to perform a multi-factorial ANCOVA in this study.
Thus, one-way ANCOVAs were performed to compare biomass, production, and P/B ratio according to the temperature (<19°C and ≥19°C), morphodynamic state of the beaches (dissipative versus intermediate/reflective), and exposure of the beaches (sheltered versus exposed). Temperature was chosen instead of latitude since, unlike latitude, temperature showed significant relationships to the biological descriptors. Since the beaches with temperatures lower and higher than 19°C were generally located respectively in temperate and tropical/subtropical regions, they are referred to as ‘temperate’ and ‘tropical/subtropical’ beaches throughout the text. For this comparison of the biological descriptors between temperate (<19°C) and tropical/subtropical beaches (≥19°C), latitude was used as a covariate (except for P/B). Only the data for bivalves, the largest group in the dataset, were used for this analysis, since the data for the other groups were not equally distributed between the two temperature categories. For the analysis according to beach exposure, only the data for bivalves were used because only limited data were available for crustaceans and polychaetes on sheltered beaches.
The relationships of the P/B ratio to biotic variables (life span and mean body mass) were investigated using either all populations from the dataset (macrofauna), or populations differentiated by taxonomic groups. The biomass, production, P/B, life span and body mass between the taxonomic groups of the first level (Crustacea and Mollusca) and according to the feeding mode (filter-feeders versus scavengers/predators) were compared by two-way ANCOVA. Deposit-feeders were not included in this analysis, since data were available for only a very small number of species with this feeding mode. One-way ANCOVAs were performed to assess the biological descriptors among the taxonomic groups of the second level. All data used in ANCOVAs were normalized through log-transformation. Tukey's honestly significant difference test was used for all post-hoc comparisons (Zar, Reference Zar1999). All statistical analyses used a 5% significance level (Zar, Reference Zar1999). The statistical analyses were performed using the STATISTICA software package (release 7.0; Statsoft Inc., Tulsa, OK).
RESULTS
General characteristics of the dataset
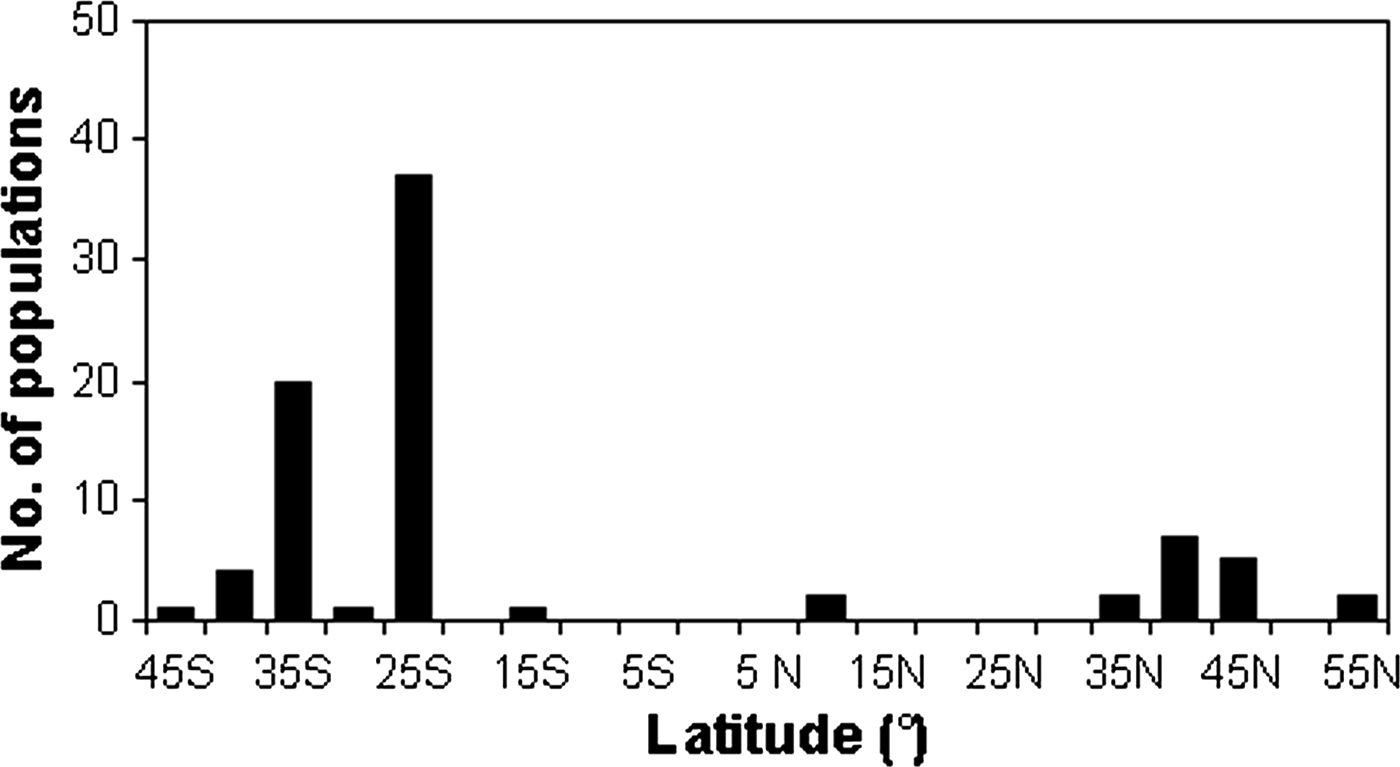
All population production data collected in the literature and the data for biological and physical variables are shown in the Supplementary Material. A total of 102 estimates of annual population production and of mean annual biomass, and 105 estimates of annual P/B ratios were collected from 52 studies carried out between 42°46′S and 54°05′N for 83 populations of sandy-beach macrofauna. Most of the populations studied are from sandy beaches in the southern hemisphere (64), concentrated in latitudes between 20 and 35°S and 36 and 45°N (Figure 1). The number of populations of exposed beaches (59) was three times higher than in sheltered beaches (19) (Supplementary Material). For the other populations (5), the degree of exposure of the beaches was not mentioned. According to the morphodynamic state of exposed beaches, populations were mainly from dissipative (25) and reflective beaches (13), with fewer populations from intermediate beaches (8). Most of the populations studied were molluscs (39) and crustaceans (36), with polychaetes less well represented (8). Among the mollusc populations, bivalves (28) outnumbered gastropods (11), while for crustaceans, similar numbers of populations of amphipods (12), isopods (12), and decapods (12) were recorded.
Frequency distribution of populations (83) from the dataset according to the latitude.

Trends of biomass, production, and P/B according to abiotic variables
The seawater temperature was weakly and negatively related to the biomass (N = 35, r 2 = 0.13, P < 0.05) and production (N = 35, r 2 = 0.21, P < 0.01), while the latitude was not related to these biotic variables. The biomass and production of bivalves were higher in temperate than in tropical/subtropical beaches (ANCOVA, F 1,35 = 7.61, P < 0.01; F 1,35 = 7.80, P < 0.01). Similarly the body mass of bivalves differed marginally between regions, with higher values on temperate beaches (ANCOVA, F 1,28 = 3.57, P = 0.06) and a marginally significant negative relationship between temperature and body mass was found for this group (N = 31, r 2 = 0.12, P = 0.054).
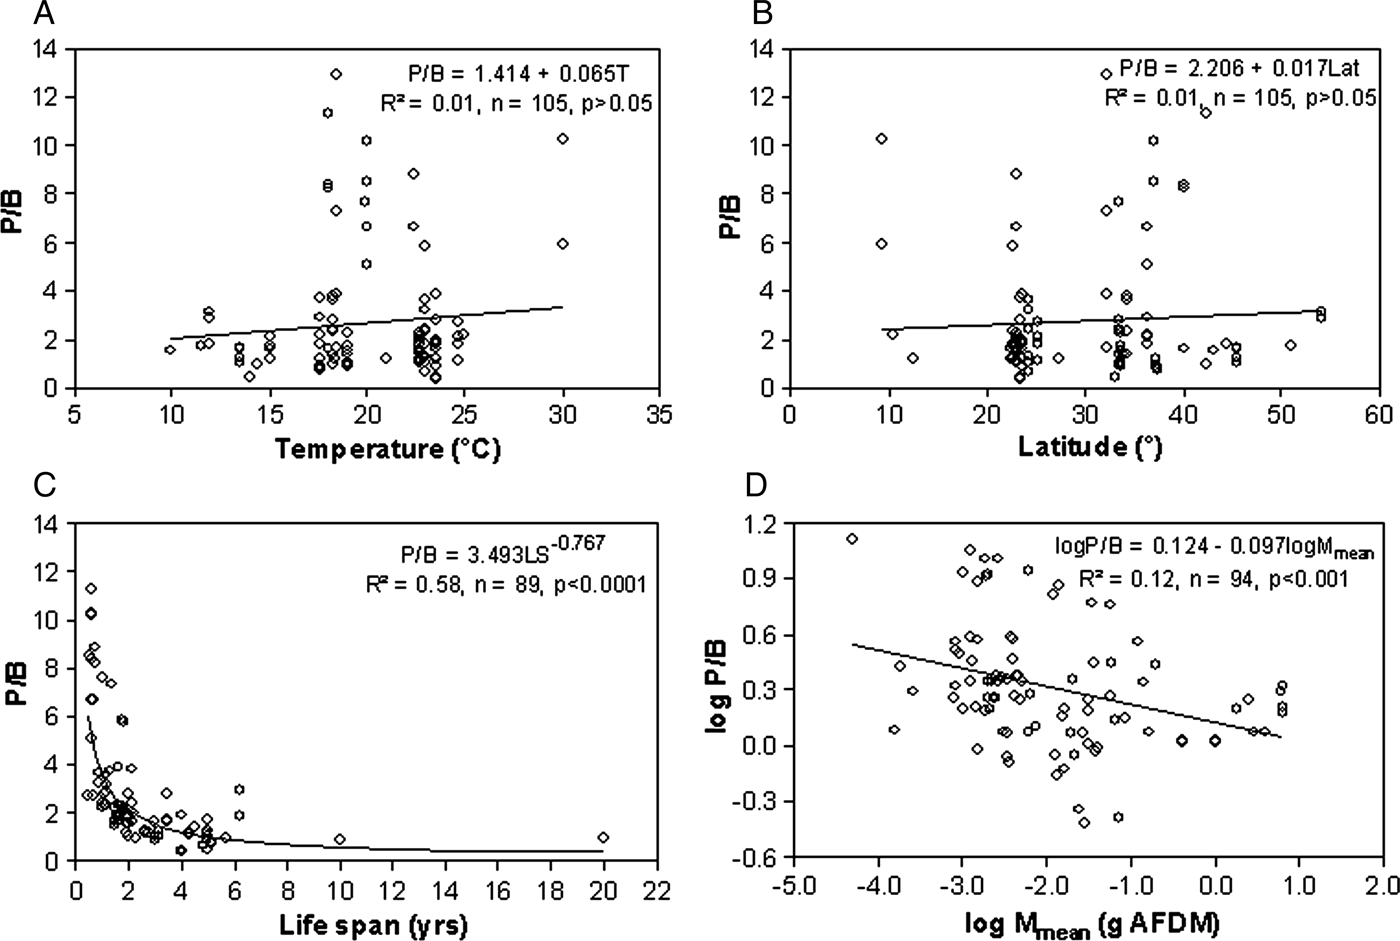
The P/B ratio of the macrofauna varied widely for the same temperature and latitude (Figure 2A,B). Variability was especially high for temperatures around 13, 18 and 23°C and at latitudes around 23° and 33°. Thus, latitude and mean annual seawater temperature were not related to P/B ratio, either for the macrofauna or for most of the taxonomic groups, except for Mollusca and Bivalvia (Table 1 and Figure 2A,B). Bivalve P/B ratios differed marginally according to temperature, and were higher in tropical/subtropical than in temperate beaches (ANCOVA, F 1,28 = 3.57, P = 0.06).
Linear and non-linear regressions between P/B ratio (y−1) of sandy-beach macrofauna populations and: (A) annual mean seawater temperature (°C), (B) latitude (°), (C) life span (LS: yrs), and (D) mean body mass (M mean: g AFDM).
Results of linear and non-linear regressions between annual P/B (P/B: y−1) and the variables: life span (LS: yrs), mean body mass (Mmean: g AFDW), mean annual seawater temperature (T: C°) and latitude (Lat) considering all data of sandy-beach macrofauna populations (M) and of populations discriminated by taxonomic groups, Mollusca (MO), Crustacea (C), Bivalvia (B), Gastropoda (G), Amphipoda (A), Isopoda (I), Decapoda (D), and Polychaeta (P).
Significant: (*, P < 0.05; ***, P < 0.001); not significant: ns.
In general, the biological descriptors did not differ according to the morphodynamic state of the beaches (dissipative versus intermediate/reflective). Likewise, biomass and production were not related to the grain size and beach slope, except for gastropods which showed a positive relationship between production and grain size (N = 13, r 2 = 0.51, P < 0.01). Amphipods showed a negative relationship between P/B ratio and beach slope (N = 13, r 2 = 0.34, P < 0.05).
The lack of statistical difference in production between bivalve populations of exposed (69.49 ± 25.57 g AFDM m−2.y−1 (±SE)) and sheltered beaches (2.29 ± 1.01 g AFDM m−2.y−1) was due to the high variances of the mean production of both categories. However, a marginally significant difference was obtained when a single datum was removed from the analysis (ANCOVA F 1,44 = 3.18, P = 0.07). When the crustacean filter-feeders of exposed beaches were included in this analysis, since the estimated production of this group did not differ from that of the bivalve filter-feeders (see below), a significant difference was obtained for production according to the degree of beach exposure (ANCOVA F 1,57 = 5.20, P < 0.05).
Trends of biomass, production, and P/B according to biotic variables, taxonomic and feeding groups
Among the biotic variables, life span was frequently and negatively related to the P/B ratios (Table 1 and Figure 2C). The P/B ratio showed a negative relationship with mean body mass of the macrofauna populations (Table 1 and Figure 2D). However, among all taxonomic groups, only P/B ratios of crustaceans were related to mean body mass (Table 1).
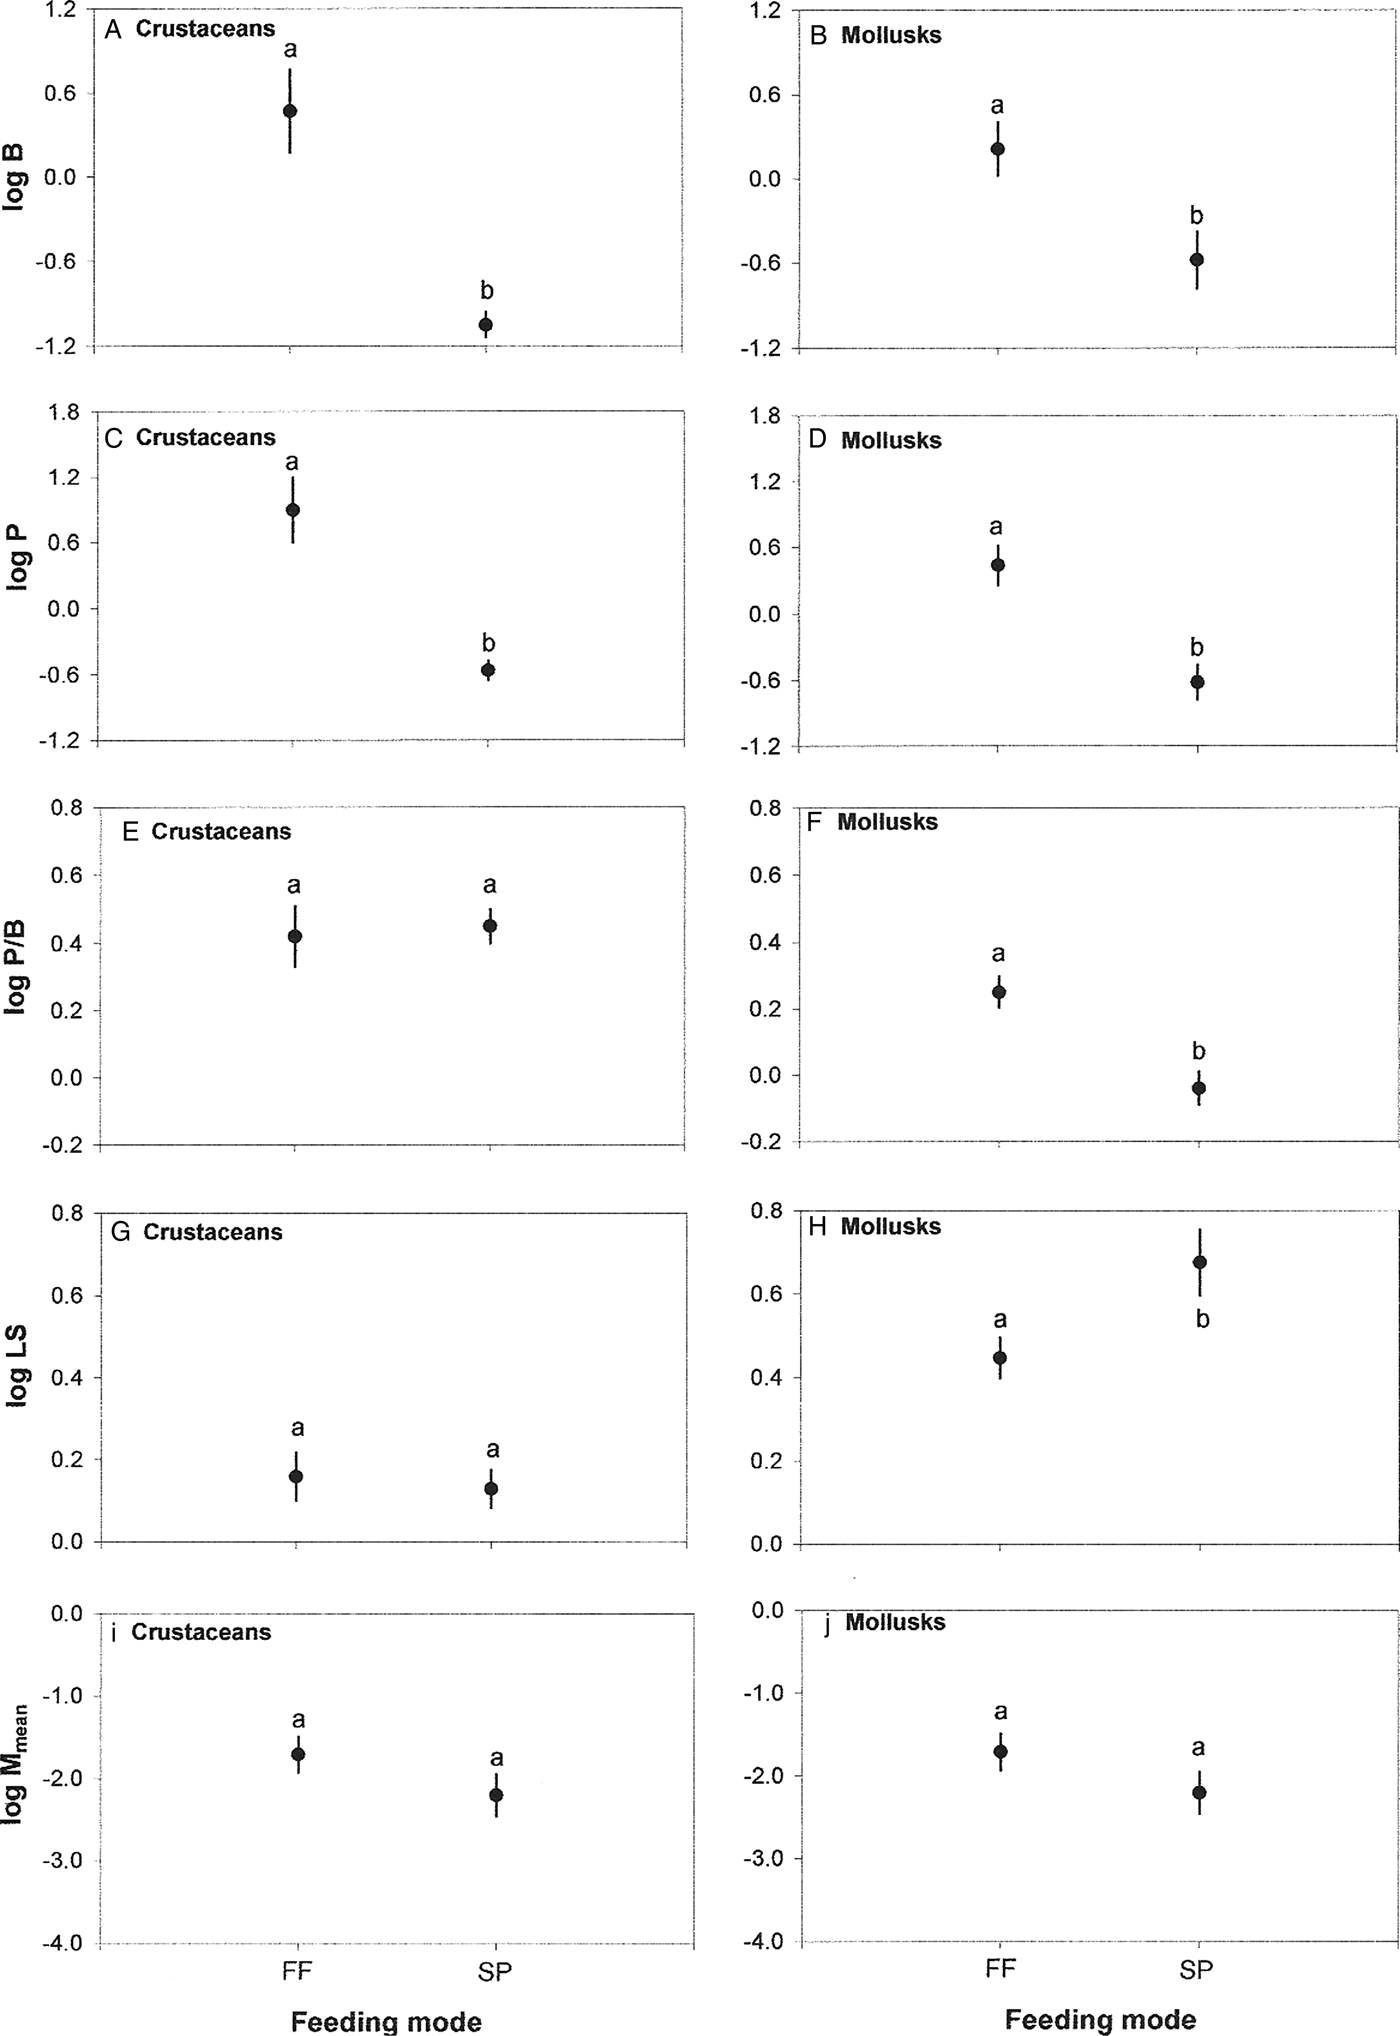
Considering the factors taxonomic groups (first level) and feeding mode, the values for biomass of molluscs and filter-feeders were higher than for crustaceans and scavengers/predators, respectively (Figure 3A,B). On the other hand, the values for production differed only according to the feeding mode, and were higher for filter-feeders than for scavengers/predators (Figure 3C,D). Inversely, the P/B ratio differed only between taxonomic groups, with higher values for crustaceans than for molluscs. A significant interaction between the factors was observed, since the P/B ratio of filter-feeders was higher than that of scavengers/predators only for molluscs (Figure 3E,F). Life span followed a pattern similar to the P/B ratio, differing only between taxonomic groups, with molluscs showing a longer mean life span than crustaceans. A significant interaction between the factors occurred, since the life span of filter-feeders was shorter than that of the scavengers/predators only for molluscs (Figure 3G,H). The body mass of molluscs was higher than that of crustaceans, and did not differ according to feeding mode for molluscs and crustaceans (Figure 3I,J).
Mean (±SE) values of: (A, B) mean annual biomass (B: log g AFDM m−2), (C, D) annual production (P: log g AFDM m−2.y−1), (E, F) annual P/B ratio (P/B: log y−1), (G, H) life span (LS: log years) and (I, J) mean body mass (M mean: log g AFDM) for sandy-beach macrofauna populations discriminated by taxonomic groups, Crustacea and Mollusca, and feeding mode, filter-feeders (FF) and scavengers/predators (SP), and results of post-hoc Tukey HSD test. Different letters above points differ significantly.
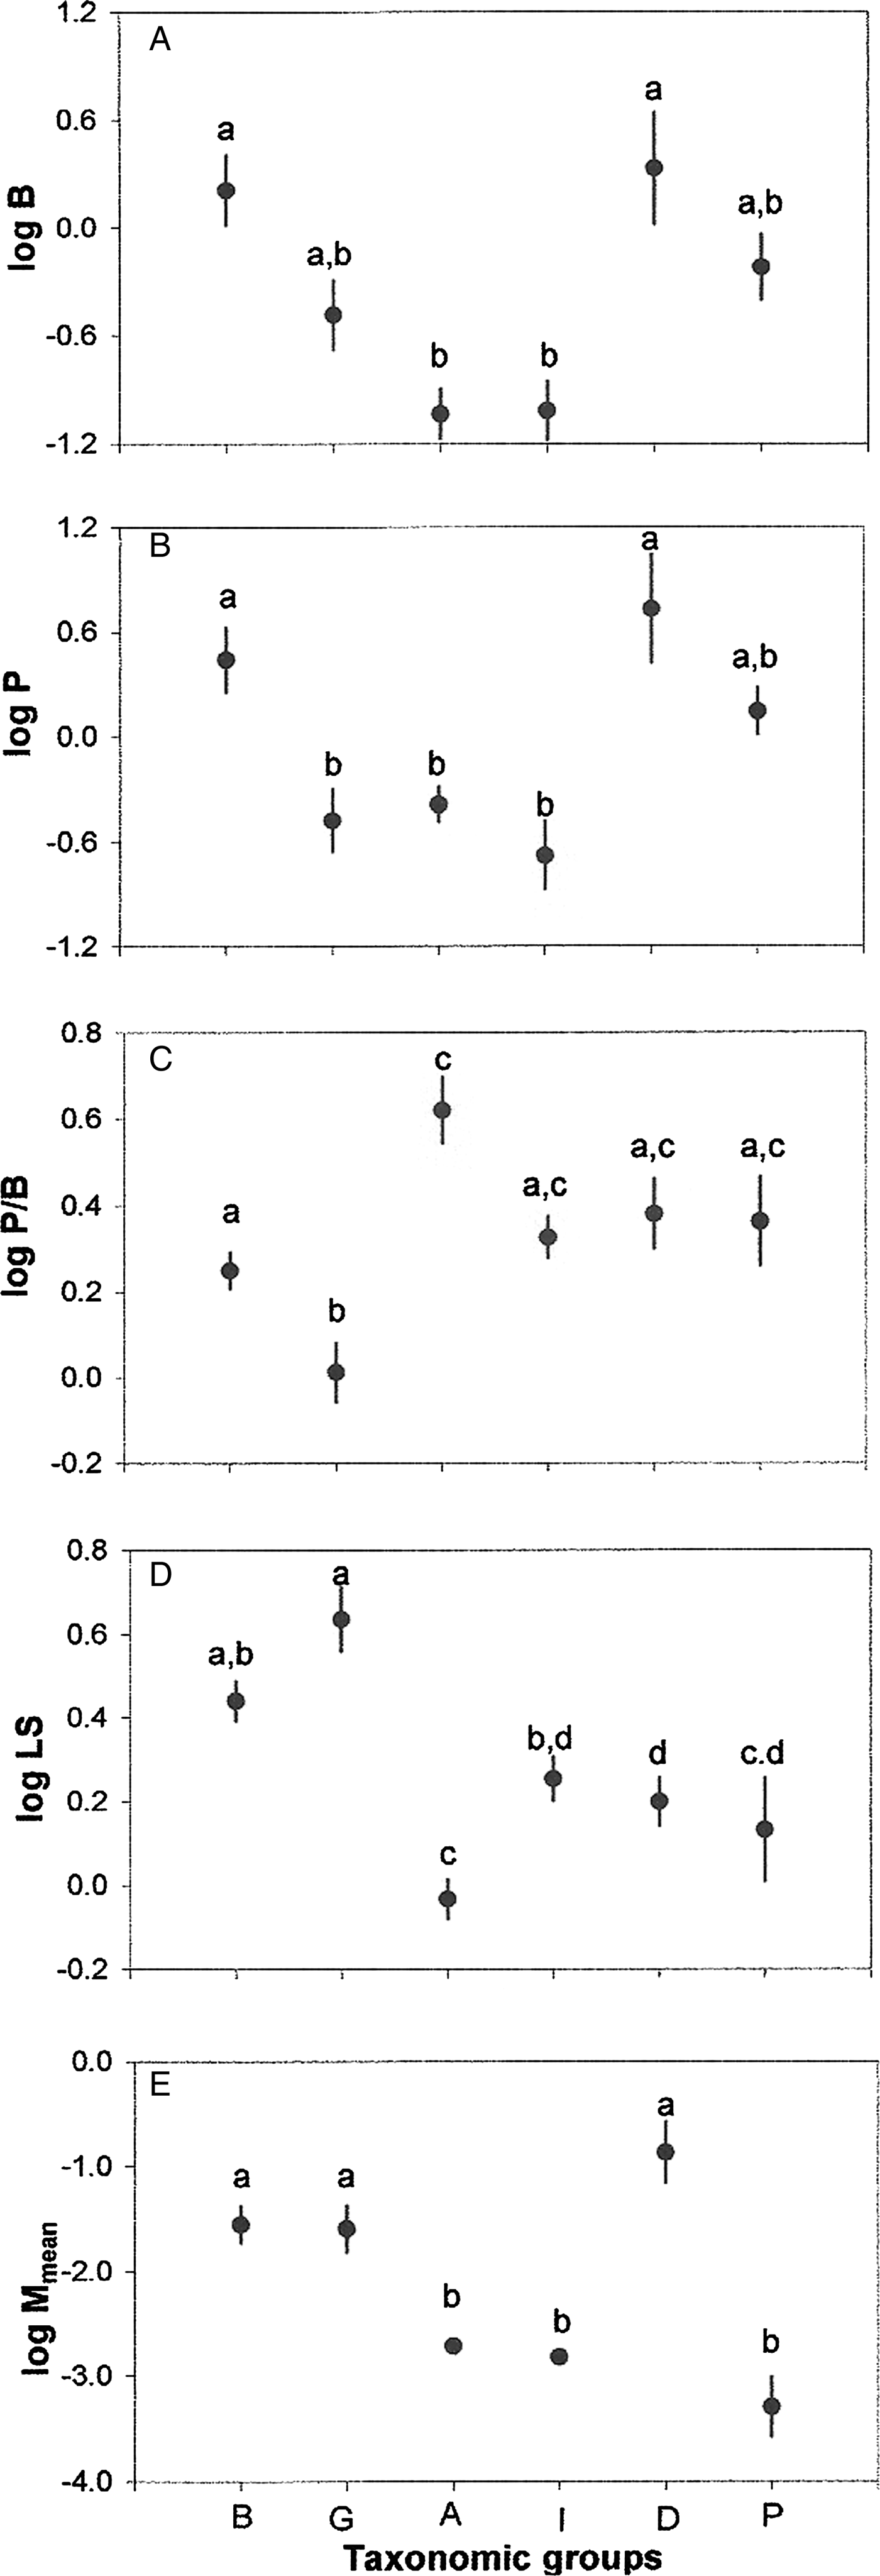
Considering the second taxonomic level, the values for biomass of bivalves and decapods were higher than for peracarids (isopods and amphipods) (ANCOVA F 5,95 = 8.07, P < 0.00001) (Tukey HSD test: P < 0.05; Figure 4A and Table 2). Production also differed between groups (ANCOVA F 5,95 = 6.95, P < 0.0001), being higher for bivalves and decapods (Tukey HSD test: P < 0.05; Figure 4B and Table 2). The P/B ratio for amphipods was higher than those for gastropods and bivalves, while gastropods showed the lowest P/B ratio of all groups (F 5,87 = 5.86, P < 0.0001) (Tukey HSD test: P < 0.05; Figure 4C and Table 2). The life span followed the opposite pattern, with amphipods showing a shorter life span than the other groups, except for polychaetes; while gastropods showed the longest mean life span of all groups (ANCOVA F 5,84 = 22.23, P < 0.0001) (Tukey HSD test: P < 0.05; Figure 4D and Table 2). The mean body mass also differed between groups (ANOVA F 5,84 = 16.24, P < 0.0001), with higher values for gastropods, bivalves, and decapods than for amphipods, isopods, and polychaetes (Tukey HSD test: P < 0.01; Figure 4E).
Mean (±SE) values of: (A) mean annual biomass (B: log g AFDM m−2), (B) annual production (P: log g AFDM m−2.y−1), (C) annual P/B ratio (P/B: log y−1), (D) life span (LS: log years) and (e) mean body mass (M mean: log g AFDM) for sandy-beach macrofauna populations discriminated by taxonomic groups, Bivalvia (B), Gastropoda (G), Amphipoda (A), Isopoda (I), Decapoda (D), and Polychaeta (P), and results of post-hoc Tukey HSD test. Different letters above points differ significantly.
Mean (±SE) and median values of mean annual biomass (B: g AFDM m−2), annual production (P: g AFDM m−2.y−1), and annual P/B ratio (y−1), life span (LS: years), and mean body mass (M mean) for all sandy-beach macrofauna populations (M) and for populations discriminated by taxonomic groups, Mollusca (MO), Bivalvia (B), Gastropoda (G), Crustacea (C), Amphipoda (A), Isopoda (I) and Decapoda (D), and Polychaeta (P).
DISCUSSION
In general, biomass, production and P/B ratio showed few trends according to the environmental variables considered. These results, however, are probably due more to the limited number of populations in the dataset than to the paucity of trends. For instance, the lack of relationships between the P/B ratio and temperature (except for bivalves) was unexpected, since it disagrees with the well-established negative relationship between these two variables (e.g. Cusson & Bourget, Reference Cusson and Bourget2005). This was probably due to: (i) the low representativeness of the estimates of P/B ratios according to latitude; and (ii) the high variability of the P/B ratio within the same range of temperature/latitude, which can be explained by the biological characteristics of the macrofauna such as life span, and taxonomic and functional groups (see below). For bivalves, the fact that most of the P/B data cover a considerable range of latitude and refer to species/populations of the genus Donax contributed to the significant relationships of P/B ratios with temperature and latitude found for this group.
The trend toward higher bivalve biomass and production in temperate beaches can be attributed to the higher body mass in these beaches. This trend for the body mass agrees with the worldwide trends for the sandy-beach macrofauna (Defeo & McLachlan, Reference Defeo and McLachlan2005). It agrees particularly with the observation of McLachlan et al. (Reference McLachlan, Dugan, Defeo, Ansell, Hubbard, Jaramillo and Penchaszadeh1996), that larger-sized bivalves with higher biomass dominate in temperate beaches, and smaller species dominate in subtropical beaches.
Regarding the observed trend for production according to the degree of beach exposure, the higher filter-feeder production in exposed beaches agrees with the idea that more food is available for filter-feeders in this type of beach, mainly dissipative and intermediate beaches, than in sheltered beaches, because of the abundant surf-zone phytoplankton in exposed beaches. In contrast to observations for sheltered beaches, extremely high production rates (>100 g AFDM m−2.yr−1) have been estimated for filter-feeders in exposed beaches, including reflective beaches. However, this pattern of production according to the beach exposure must be confirmed from a larger dataset.
Beach slope can be used as an appropriate measure of the morphodynamic state of beaches (Defeo & McLachlan, Reference Defeo and McLachlan2011). The negative relationship between the P/B ratio and slope for amphipods, which were represented mainly by a few species of supralittoral talitrids (Table S1), agrees with the Habitat Safety Hypothesis for supralittoral amphipods (Defeo & Gómez, Reference Defeo and Gómez2005). This hypothesis postulates that these supralittoral forms show higher mortality in dissipative than in reflective beaches (Defeo & Gómez, Reference Defeo and Gómez2005; Defeo & McLachlan, Reference Defeo and McLachlan2005). Since the P/B ratio is equal to the mortality rate (Allen, Reference Allen1971), higher P/B ratios for amphipods are expected in dissipative beaches, i.e. those with gentler slopes.
Most of the models developed to examine the relationship between macrobenthos productivity and biotic and abiotic variables have shown that the mean body mass is strongly and negatively related to the P/B ratio (e.g. Cusson & Bourget, Reference Cusson and Bourget2005). However, in the present study, these two variables showed weak relationships and were restricted to the macrofauna and to Crustacea. A possible explanation for the poor fit or lack of these relationships is that some larger-sized species, e.g. Donax serra (Röding, 1798) and D. obesulus Reeve, 1854 showed high P/B ratios, despite their high body mass. Moreover, several species with similar mean body mass, such as the talitrid amphipods, showed wide variation in P/B ratios. According to Huryn & Benke (Reference Huryn, Benke, Hildrew, Raffaelli and Edmonds-Brown2007), a poor fit between P/B and mean body mass can be due to the fact that taxa with a small body mass (such as amphipods in this study) exhibit a wide range of P/Bs, from very low to very high; while those with a large body mass tend to have a low P/B. The scarcity of production data for tropical beaches, where the organisms have a smaller size and mass and a higher P/B than their relatives on temperate beaches (Defeo & McLachlan, Reference Defeo and McLachlan2005), may have contributed to the weak relationships between P/B and the body mass for the sandy-beach macrofauna.
Unlike the mean body mass, life span generally explained most of the variations in the P/B ratio, showing stronger relationships for the macrofauna in general and for several taxonomic groups. This relationship between the P/B ratio and life span was observed previously for macrofauna from different habitats (e.g. Robertson, Reference Robertson1979; Benke & Huryn, Reference Benke and Huryn2010). Our findings are consistent with those by Cusson & Bourget (Reference Cusson and Bourget2005), that the biotic and, particularly, the life span were more important than environmental variables in explaining the variation in P/B ratios of marine macroinvertebrates.
Marked differences in biomass, production and P/B between the feeding and taxonomic groups were observed. The higher biomass and production of the filter-feeders than scavengers/predators, found for both crustaceans and molluscs, is expected since filter-feeders are the most productive group in both marine and freshwater habitats (Cusson & Bourget, Reference Cusson and Bourget2005; Benke & Huryn, Reference Benke and Huryn2010). On the other hand, the low production of the predators and scavengers can be attributed respectively to the predators’ higher position on food chains, and to the low quality of available food for the scavengers. Although molluscs have generally higher production than other groups (Cusson & Bourget, Reference Cusson and Bourget2005), the lack of a difference between the production of molluscs and crustaceans can be attributed to the high production of the filter-feeding decapods, mainly Emerita populations. These populations often have high biomass and rapid growth (e.g. Veloso & Cardoso, Reference Veloso and Cardoso1999; Petracco et al., Reference Petracco, Veloso and Cardoso2003). Thus, despite the higher biomass of molluscs, the faster growth of crustaceans, including larger forms such as Emerita, led to similar production estimates for these two taxonomic groups. Following the same line of thought, the higher P/B ratio of the crustaceans can also be attributed to faster growth, and agrees with their shorter life span. The low mollusc P/B ratio is consistent with the general pattern observed for marine macroinvertebrates (Cusson & Bourget, Reference Cusson and Bourget2005).
A strong correspondence can be established between the categories of molluscs and crustaceans, according to the feeding mode and the second-level taxonomic groups. While the filter-feeder crustaceans and molluscs were represented respectively by bivalves and decapods, the scavenger/predator crustaceans and molluscs were represented mainly by the peracarids (isopods and amphipods) and gastropods respectively. Thus, the differences in production within molluscs (bivalves versus gastropods) and crustaceans (decapods versus isopods and amphipods) follow the same pattern observed for the feeding mode.
The difference in the P/B ratio according to the feeding mode between the molluscs is ascribable to the longer life span of mollusc scavengers/predators, i.e. gastropods. On the other hand, generally both scavenger/predator and filter-feeding crustaceans have rapid growth and short life spans (Cardoso & Veloso, Reference Cardoso and Veloso1996; Petracco et al., Reference Petracco, Veloso and Cardoso2003, Reference Petracco, Cardoso and Corbisier2010, Reference Petracco, Cardoso, Turra and Corbisier2012), and therefore the P/B ratios of these groups are similar. The high P/B ratio of amphipods can be attributed to their shorter life span and high motility (Cusson & Bourget, Reference Cusson and Bourget2005). Conversely, the lower P/B ratio of gastropods results from their longer life span, slow individual growth, and low motility.
In summary, although the available dataset is small, some patterns of production and the P/B ratio according to environmental and biotic variables could be identified. The negative relationship between the P/B ratio and beach slope for the supralittoral amphipods agrees with the Habitat Safety Hypothesis (Gómez & Defeo, Reference Defeo and McLachlan2005), according to which these forms would show higher mortality in dissipative than in reflective beaches. The higher filter-feeder production in exposed beaches agrees with the idea that on this type of beach, mainly the dissipative/intermediate types, more food is available for species with this feeding mode than on sheltered beaches. The higher production of filter-feeders reinforces the importance of this group for production in marine environments. However, the high production of decapods, which often act as filter-feeders on sandy beaches, seems to be a peculiar feature of the sandy-beach macrofauna, and indicates the importance of the species of this group in these environments.
ACKNOWLEDGEMENTS
This paper is part of the postdoctoral of M.P. at Instituto Oceanográfico da Universidade de São Paulo (IOUSP). The authors express their deepest gratitude to Drs Omar Defeo, Anabella Covazzi Harriague and one anonymous referee for the critical reading and valuable suggestions on the manuscript. We thank several colleagues who provided information about their studies and thus contributed to the development of this study. Thanks are due to Dr Janet W. Reid for the English revision.
FINANCIAL SUPPORT
M. Petracco was supported by São Paulo Research Foundation (FAPESP: Process no. 2008/11053-0) and National Council for Scientific and Technological Development-Brazil (CNPq: Process no. 163181/2011-0)
Supplementary materials and methods
The supplementary material refered to in this article can be found online at journals.cambridge.org/mbi.