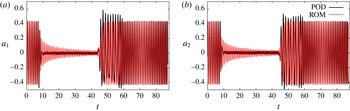
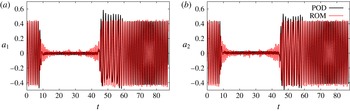
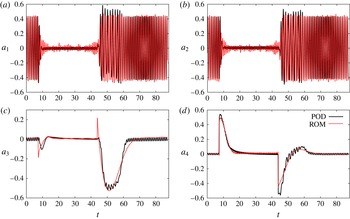
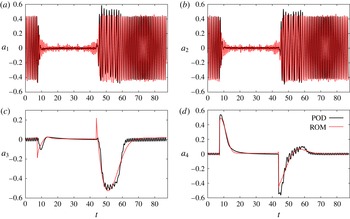
1 Introduction
Flow separation over airfoils with high-lift configuration can be efficiently delayed or mitigated using flow control strategies. For model-based flow control, reduced-order models (ROM) based on proper orthogonal decomposition (POD) are of major importance (e.g. Bergmann & Cordier Reference Bergmann and Cordier2008). As discussed in Noack, Tadmor & Morzyński (Reference Noack, Tadmor and Morzyński2004), a flow model capturing fast transients between the actuated and the unactuated state is then highly desirable. However, this requirement becomes more complicated to achieve when actuation is unsteady. The typical solution, referred to as the lifting method in the theory of partial differential equations (PDEs), involves homogenizing the boundary condition for the POD modes by including a suitably chosen function in the expansion of the velocity field. The current study proposes a hierarchy of reduced-order models derived from mean-field considerations and Galerkin projection with an increasing number of actuation modes and degrees of nonlinearity.
For aircraft, circulation control in combination with high-lift devices offers several advantages over traditional high-lift configurations. The basic concept of circulation control involves the Coanda principle, where energy is introduced into the flow by means of a thin jet ejected tangentially from a slot near the trailing edge. The main advantage of circulation control is an increased lift output, which makes shorter take-offs and landings possible. This technology was first patented by Davidson (Reference Davidson1960) and has since been repeatedly investigated (Lachmann Reference Lachmann1961; Wood & Nielson Reference Wood and Nielson1985; Nielson & Biggers Reference Nielson and Biggers1987; Englar Reference Englar2000). A circulation control wing (CCW) with steady jets, even at very small mass flow rates, has been shown to yield lift coefficients that are comparable or superior to conventional high-lift systems (Smith Reference Smith1975; Sexstone et al. Reference Sexstone, Huebner, Lamar, McKinley, Torres, Burley, Scott and Small1998). A particular variation of circulation control is the Coanda flap. Here, the flow is kept attached over a highly deflected flap by blowing a jet tangentially over its specially designed upper surface. This concept has been previously investigated and geometrically optimized in several previous studies (Jensch et al. Reference Jensch, Pfingsten, Radespiel, Schuermann, Haupt and Bauss2009; Radespiel, Pfingsten & Jensch Reference Radespiel, Pfingsten, Jensch, Radespiel, Rossow and Brinkmann2009). However, efficiency requirements demand that the lift gained through the use of circulation control be as large as possible in comparison to the momentum coefficient of the blown jet, which is usually acquired by engine bleed. This ratio is referred to as the lift gain factor. An increase in the lift gain factor can be achieved through periodic blowing. Two studies during the mid-1970s investigated pulsed blowing associated with circulation control (Oyler & Palmer Reference Oyler and Palmer1972; Walters, Myer & Holt Reference Walters, Myer and Holt1972). Results from these experiments indicated that pulsed blowing reduced the mass requirements for CCW. However, both experiments were limited in scope and little was revealed about the physics of the phenomena. More recently, periodic blowing on a circulation control wing with circular trailing edge was examined (Jones et al. Reference Jones, Viken, Washburn, Jenkins and Cagle2002). A 50 % reduction in the required mass flow for a required lift coefficient was achieved. It is worth to note that the benefits of periodic excitation targeting flow instabilities have also been demonstrated in other flow control applications, such as pulsed actuation over a flap (Becker et al. Reference Becker, King, Petz and Nitsche2007; Petz & Nitsche Reference Petz and Nitsche2007) and acoustic excitation (Seifert, Greenblatt & Wygnanski Reference Seifert, Greenblatt and Wygnanski2004; Greenblatt & Wygnanski Reference Greenblatt and Wygnanski2007).
Beside the numerical and theoretical investigations, the current research project entails a water tunnel experiment, which is presently under construction. Periodic excitation of the Coanda jet will be performed through oscillation of piezo-electric actuators installed over the jet exit slot, as illustrated in figure 1. The blue arrows in the figure illustrate the blown jet, whereas the red arrows illustrate the lip movement. This type of actuation enables fine tuning of the jet actuation frequency, amplitude and mean momentum. This flexibility coupled with high sensing capability from surface-mounted pressure and shear stress sensors enables closed-loop control, which promises further energy gains.
Schematic of the actuated lip movement over the jet exit slot.

Closed-loop flow control has been rapidly advanced over the past decades with the development of control theory, simulation methods and experimental techniques (Allan et al. Reference Allan, Juang, Seifert, Pack and Brown2000; Rowley & Williams Reference Rowley and Williams2006; Kim & Bewley Reference Kim and Bewley2007; Choi, Jeon & Kim Reference Choi, Jeon and Kim2008). Several control strategies can be found in the literature. A very simple strategy is a model-independent approach with direct sensor feedback (Joshi, Speyer & Kim Reference Joshi, Speyer and Kim1997; Rapoport et al. Reference Rapoport, Fono, Cohen and Seifert2003), or with sensor-based feedback, such as proportional-integral-derivative (PID) control (Roussopoulos Reference Roussopoulos1993). This method is simple to implement and requires only parameter tuning (Killingsworth & Krstić Reference Killingsworth and Krstić2006). The resulting control has been successfully applied to single-input single-output opposition and phasor control, but comes with no guaranteed performance or optimality property. Furthermore, the large number of tuneable parameters make this approach impractical for multiple actuators, multiple sensors and complex dynamics. A well-investigated model-based control design for multiple sensors and actuators directly uses the input/output signals (black box model) under strong linearity assumptions (Rowley & Williams Reference Rowley and Williams2006). For complex dynamics with unknown nonlinearities this control strategy has severe challenges. In contrast, optimal control (Gunzburger Reference Gunzburger2000; Scott et al. Reference Scott, Ghayour, Heinkenschloss, Ulbrich and Ulbrich2002) is based on a high-fidelity nonlinear Navier–Stokes discretization and minimizes a cost functional. The computational cost, however, exclude any real-time implementation in an experiment (Li et al. Reference Li, Navon, Hussain and Dimet2003).
Control-oriented reduced-order models resolving just the key nonlinear actuation mechanisms are a compromise between the online-capable black-box models geared towards linear dynamics and the accuracy of the computationally expensive nonlinear Navier–Stokes-based approaches. The starting point is a POD model derived from a Galerkin projection (Noack, Morzyński & Tadmor Reference Noack, Morzyński and Tadmor2011). Such models exist for virtually any unforced configuration starting with the pioneering wall-turbulence model by Aubry et al. (Reference Aubry, Holmes, Lumley and Stone1988). On the other hand, modelling actuated flows is more challenging. Volume forces can be easily integrated in the Galerkin projection (Lumley & Blossey Reference Lumley and Blossey1998), whereas wall-bounded actuation such as blowing and suction on a zero set ‘disappears’ in volume integrals of the Galerkin projection. Auxiliary techniques, called lifting methods, are necessary to resolve this form of forcing. A simple approach is an additional calibrated forcing term in the dynamical system (Luchtenburg et al. Reference Luchtenburg, Günther, Noack, King and Tadmor2009). The price of simplicity may be a reduced accuracy of the POD expansion in the neighbourhood of the actuators. A more accurate Galerkin model employs a more refined lifting method resolving the near-wall actuation with actuation modes. This approach has been employed for Galerkin models for over half a century (Ladyzhenskaya Reference Ladyzhenskaya1963). Application to POD models appears to have started with Graham, Peraire & Tang (Reference Graham, Peraire and Tang1999). Several subsequent studies followed, such as Rediniotis, Ko & Kurdila (Reference Rediniotis, Ko and Kurdila2002), where an ingenious transformation leads to a linear forcing term in the Galerkin system. Kasnakoğlu, Serrani & Efe (Reference Kasnakoğlu, Serrani and Efe2008) provided a frequently employed data-based method to derive actuation modes which elegantly simplify the Galerkin system. These aforementioned studies however have lumped all the actuation components (steady, unsteady and phase shifted) into a single function, which made it impossible to discern the different flow dynamics resulting from the various actuation components. This shortcoming becomes critical when the different actuation components excite different flow dynamics, which can result in a reduced-order model with a poor frequency resolution. In the present study, we extend these works and propose a hierarchy of lifting methods for different frequency components associated with the same actuation input. The subgrid turbulence modelling is bypassed by (i) respecting the model structure from mean-field considerations and a Galerkin projection and (ii) implementing a parameter identification of all Galerkin system coefficients with 4D-Var method (Navon Reference Navon, Park and Xu2009; Artana et al. Reference Artana, Cammilleri, Carlier and Mémin2012). This approach yields by construction the optimal model with the imposed structure for the transient dataset and has been proven to be surprisingly successful for complex flow dynamics (Cordier et al. Reference Cordier, Noack, Daviller, Delvile, Lehnasch, Tissot, Balajewicz and Niven2013).
Since the main focus of the current study is the development of reduced-order models, it is relevant to highlight their planned applications. The first usage of the proposed reduced-order models is to enable understanding of the flow physics by deriving least-order models that can correctly capture the flow dynamics. This analysis is detailed in §§ 3–6. The second usage targets flow control, which is planned to take place during the water tunnel experiment. Here, several possible flow control strategies are possible: (i) model-based open-loop control (Bergmann & Cordier Reference Bergmann and Cordier2008), (ii) model-based adaptive control (Luchtenburg et al. Reference Luchtenburg, Aleksić, Schlegel, Noack, King, Tadmor, Günther and Thiele2010), (iii) sparse Galerkin model tuneable for experiments (Luchtenburg et al. Reference Luchtenburg, Günther, Noack, King and Tadmor2009) or (iv) model-based on real-time control with variation of modelling approach (Gerhard et al. Reference Gerhard, Pastoor, King, Noack, Dillmann, Morzynski and Tadmor2003).
The manuscript is structured as follows. The configuration and numerical simulations are described in § 2. The Galerkin method is outlined in two sections for the kinematic modal expansion (§ 3) and for the dynamical system (§ 4). In particular, § 3 proposes a hierarchy of lifting methods for the Galerkin expansion. In § 4, mean-field and Galerkin models are derived. A hierarchy of Galerkin models is proposed and investigated in § 5. In § 6 the lift is estimated from the models and the robustness to different operating conditions is considered. The study is summarized in § 7.
2 Numerical simulations
The present investigations are based on one two-dimensional numerical simulation of an airfoil with a Coanda flap. The test case is selected for its aerodynamic characteristics, and includes two sudden transients for richer dynamics. The details of the airfoil configuration (§ 2.1), of the numerical set-up (§ 2.2) and of the transient flow solutions (§ 2.3) are presented in the following.
2.1 Configuration
The high-lift configuration, shown in figure 2, is a modified DLR F15 airfoil equipped with a highly deflected Coanda flap and a droop nose. The details of the airfoil design are described in Jensch et al. (Reference Jensch, Pfingsten, Radespiel, Schuermann, Haupt and Bauss2009) and Burnazzi & Radespiel (Reference Burnazzi and Radespiel2014), where the objective was to accomplish high lift coefficients during take-off and landing. The droop nose design is chosen to satisfy low noise emission restrictions, which exclude other leading edge devices, such as the Krüger slat. The leading edge geometry was reached after an iterative process that improved the airfoil stall behaviour, which is ruled by the suction peak. The highly deflected flap at
 $65^{\circ }$
has a chord length of
 $c_{fl}=0.25c$
, where
 $c$
is the main airfoil chord length with the retracted flap. The flap is specially designed with a round shoulder to enhance the Coanda effect. Henceforth, all physical variables are assumed to be non-dimensionalized with respect to the chord length
 $c$
, the incoming flow velocity
 $U_{\infty }$
and the constant density
 ${\it\rho}$
(constant outside the plenum). The numerical simulations are performed at Mach number
 $Ma=0.15$
and Reynolds number
 $Re=U_{\infty }c/{\it\nu}=12\times 10^{6}$
, where
 ${\it\nu}$
is the kinematic viscosity of the fluid. These flow parameters correspond to the expected conditions during landing.
Part of the numerical mesh surrounding the modified DLR F15 airfoil with a close up of the actuation duct.

Unsteady Coanda blowing is performed through an oscillatory lip motion, simulating the planned experimental device. This yields a velocity fluctuation at the jet exit whose magnitude can be prescribed as
 $$\begin{eqnarray}\displaystyle \Vert \boldsymbol{U}_{J}\Vert _{2}(t)\approx B_{0}+B_{1}\cos ({\it\omega}^{a}t), & & \displaystyle\end{eqnarray}$$
where
 ${\it\omega}^{a}$
is the angular actuation frequency,
 $B_{0}$
is the mean exit velocity,
 $B_{1}$
is the oscillatory actuation amplitude and
 $\Vert \cdot \Vert _{2}$
is the Euclidean vector norm. For simplicity, the jet velocity magnitude at the jet exit
 $\Vert \boldsymbol{U}_{J}\Vert _{2}$
will henceforth be referred to simply as
 $U_{J}$
. For the current test case, the corresponding actuation velocity parameters are
 ${\it\omega}^{a}=f^{a}c/U_{\infty }=1.96$
,
 $B_{0}=4.515$
and
 $B_{1}=0.07$
. The blowing intensity is characterized by the momentum coefficient,
 $$\begin{eqnarray}\displaystyle c_{{\it\mu}}(t)=\frac{U_{J}(t){\dot{m}}_{J}(t)}{\frac{1}{2}{\it\rho}U_{\infty }^{2}S_{ref}}, & & \displaystyle\end{eqnarray}$$
where
 ${\dot{m}}_{J}$
is the jet mass flow rate and
 $S_{ref}$
is the reference area. Similar to the jet exit velocity given by (2.1), the momentum coefficient can be expressed as
 $c_{{\it\mu}}(t)=C_{{\it\mu}0}+C_{{\it\mu}1}\cos ({\it\omega}^{a}t)$
, where
 $C_{{\it\mu}0}$
is the steady mean and
 $C_{{\it\mu}1}$
is the amplitude of oscillation. This yields a mean momentum coefficient of
 $C_{{\it\mu}0}=0.0295$
and amplitude
 $C_{{\it\mu}1}=0.0239$
. The non-dimensional actuation frequency (Seifert, Darabi & Wyganski Reference Seifert, Darabi and Wyganski1996; Seifert et al.
Reference Seifert, Greenblatt and Wygnanski2004) can be expressed as,
 $$\begin{eqnarray}\displaystyle F^{+}=\frac{f^{a}c_{fl}}{U_{\infty }}=\frac{{\it\omega}^{a}c_{fl}}{c}, & & \displaystyle\end{eqnarray}$$
where the flap chord length
 $c_{fl}$
is used as the length scale, since the flow is only separated over the flap. This definition yields a normalized actuation frequency of
 $F^{+}=0.49$
for the current test case. All actuation parameters are selected from a previous parametric study, where lift was maximized with respect to the steady blowing momentum coefficient.
2.2 Unsteady Reynolds-averaged Navier–Stokes simulations
The computational fluid dynamics (CFD) solver employed to perform the analysis is the DLR TAU-Code (Kroll et al. Reference Kroll, Rossow, Schwamborn, Becker and Heller2002; Schwamborn, Gerhold & Heinrich Reference Schwamborn, Gerhold and Heinrich2006). The two-dimensional unsteady Reynolds-averaged Navier–Stokes (URANS) equations are solved using a finite volume approach. The discretization schemes are the central scheme and the second-order upwind Roe scheme for the mean-flow inviscid flux and the convective flux of the turbulence transport equation, respectively. The turbulence model is that of Spalart–Allmaras with a curvature correction (Shur et al. Reference Shur, Strelets, Travin and Spalart2000) which allows the one-equation turbulence model to maintain a good accuracy in regions where the streamlines have a high curvature. This characteristic is fundamental for the simulation of the Coanda phenomenon, which is based on the equilibrium between the inertial forces and the momentum transport in the direction normal to the convex surface (Pfingsten et al. Reference Pfingsten, Jensch, Körber and Radespiel2007). The numerical scheme and the turbulence model were previously assessed by comparing the results to wind tunnel experiments (Pfingsten, Cecora & Radespiel Reference Pfingsten, Cecora and Radespiel2009; Pfingsten & Radespiel Reference Pfingsten and Radespiel2009). The lift, drag and pitching moment coefficients are determined by integrating the pressure and shear stress distributions over the airfoil surface. The contribution from the added jet momentum is not included.
The mesh density was determined by means of a mesh convergence exercise based on the Richardson extrapolation (Richardson & Gaunt Reference Richardson and Gaunt1927). This procedure provided an estimation of the space discretization error and of the minimum number of points that produced acceptable accuracy. Three different grid densities with
 ${\sim}70\,000$
, 230 000 and 920 000 points were tested. The corresponding maximum lift coefficients of 4.410, 4.456 and 4.480 were obtained for the three grids at
 ${\it\alpha}=3^{\circ }$
angle of attack. Based on these values, the Richardson extrapolation yielded a maximum lift coefficient of 4.496, which is an approximation of using an infinite large number of grid points. This extrapolated value was used as a reference lift coefficient to determine the grid resolution error, which was 1.91 %, 0.89 % and 0.36 % for the three grids, respectively. As such, the medium grid, with
 ${\sim}230\,000$
points was chosen, which represented a compromise between accuracy and computational cost.
The mesh is composed of a structured and an unstructured region, as the close up in figure 2 shows. The outer unstructured mesh has a C-block topology and extends 50 chord lengths in all directions. The structured grid extends from the airfoil surface outward to cover the region where the main viscous phenomena occur. The viscous sublayer is also resolved with
 $y_{+}<1$
everywhere over the airfoil surface. An important characteristic of the grid is the high grid density along the pressure side, where the stagnation point can be located, far from the leading edge. The structured region is also extended over a large area behind the highly deflected flap, in order to accurately capture the wake dynamics during the separated non-actuated period. Both the trailing edge and the edge of the slot lip are discretized by means of a local C-block topology.
The lip oscillation movement is numerically simulated by means of grid deformation, as shown in figure 3, where the black/blue lines denote the mesh domain boundaries for the lowest/highest position. To avoid a pressure surge in the plenum and a mesh singularity, no simulations are conducted with a fully closed lip. The total lip height movement is
 $2h$
(
 $3h/4$
below and
 $5h/4$
above neutral position), where
 $h=0.0006$
is the lip height at the neutral position. Both, the neutral lip height and the plenum geometry, are based on the results by Jensch et al. (Reference Jensch, Pfingsten, Radespiel, Schuermann, Haupt and Bauss2009), where a range of possible duct geometries was investigated.
Numerically simulated dynamic lip movement. The slot exit mid-point
 $\boldsymbol{x}_{J}$
is also shown.

The unsteady lip movement represents a constantly deforming non-homogeneous boundary condition and introduces additional complexity to any reduced-order model. As simplification, all snapshots are exported, a posteriori, onto a static mesh that is fixed at the neutral position. Critically, this procedure preserves all dynamical interactions between the moving lip wall and the incoming boundary layer over the lip edge along the suction side. All data presented henceforth are those exported on the static mesh. This approximation is deemed acceptable due to the spatially limited extent of the deformed mesh, as can be seen in figure 3. As a result, the unsteady non-homogeneous boundary condition is transferred to the Coanda jet flow across the exit location, which now acts as a boundary with periodic pressure/velocity fluctuation. The implications of such simplification on POD modelling will be discussed in § 3.1.
2.3 Transient flow solutions
Sudden transients between two flow states lead to rich dynamics. The current numerical simulation includes two sudden transients between the unactuated state and an actuated one. The unactuated flow field behind the deflected flap is characterized by massive separation, as seen in figure 4(a). The recirculation region behind the wake is associated with periodic vortex shedding with a dominant Strouhal number of
 $St_{fl}^{u}=f^{u}c_{fl}/U_{\infty }=0.23$
. With actuation, the effect on the flow field is the near complete attenuation of the natural shedding vortices and the emergence of a new attractor locked-in on the actuation frequency. This observation is also confirmed in the lift coefficient distribution in figure 5. During this state, the flow is attached over the flap length, with the exception of roll-off vortices generated at the jet exit. The averaged effect of this phenomenon is shown in figure 4(b), where a small recirculation region near the trailing edge of the flap can be observed. One can also see the more curved streamlines in comparison with the natural state, which are associated with elevated lift for that case.
Comparison between (a) the unactuated, and (b) the actuated (
 $C_{{\it\mu}0}=0.0295$
,
 $C_{{\it\mu}1}=0.0239$
and
 $F^{+}=0.49$
) mean-flow field visualized by streamlines. The black line surrounding the airfoil delimits the structured grid region.

The lift coefficient (black) and the jet exit velocity (grey) from the URANS data:
 $Re=12\times 10^{6}$
,
 $Ma=0.15$
, and
 ${\it\alpha}=0^{\circ }$
. Actuation is turned on at
 $t_{s}=7.395$
and turned off at
 $t_{e}=43.843$
.

A more accurate description of the flow behaviour throughout both transients is provided by the lift distribution. Figure 5 shows the lift coefficient (black) and the jet exit velocity (grey) from the URANS data. The simulation starts from the unactuated natural state until
 $t_{s}=7.395$
, when actuation is turned on. The exit velocity distributions rise sharply with oscillatory modulation. In other words, the lip starts oscillating at the same instant as the total pressure in the plenum is increased. The flow response to the sudden actuation is almost instantaneous, as seen by the quick increase in the lift coefficient. This initial response, hereafter called the off–on transient, is followed by a slow asymptotic convergence towards the new state, which is reached at
 $t_{c}\approx 39$
. Asymptotic behaviour is assumed reached when one lift coefficient period changes less than 0.1 % than its predecessor. The lift increase through actuation is 80 % (
 $C_{l}=1.92$
versus 3.47). Throughout this transition period the flow is locked on the actuation frequency
 ${\it\omega}^{a}$
, as seen in the
 $C_{l}$
frequency and in the flow field snapshots (not shown here). After the flow settles on the new attractor for 8 cycles, the actuation is suddenly turned off at
 $t_{e}=43.843$
and the flow is left to settle towards its natural state. Similar to the first transient, the flow response to the second transient called the on–off transient is immediate, and a sudden drop in the lift coefficient is observed. The flow transition from the actuation frequency to the natural shedding frequency (
 ${\it\omega}^{u}=0.919$
) is also near instantaneous. However, unlike the off–on flow response, the on–off transient is associated with an undershoot and an increased oscillation amplitude. These differences stem from the different damping mechanisms acting on the two transients. The oscillations following the on–off transient decay only through ‘natural’ damping from wall shear stress and the motion of the separation region, whereas those following the off–on transient have the added damping effect of the blown jet that increases the Reynolds stresses (Amitay, Smith & Glezer Reference Amitay, Smith and Glezer1998). Following this transition phase, the flow settles on the unactuated attractor at
 $t\approx 68$
.
3 Hierarchy of lifting methods
This section describes the employed lifting methods, where the unsteady Coanda blowing is incorporated in the Galerkin models as free dynamic input via actuation modes. Before detailing the proposed actuation modes, it is critical to note that there exists a large set of modes that could serve as actuation modes. Mathematically, they are only constrained by the following: (i) they must be divergence free, to retain the divergence-free property of the basis functions, (ii) they must satisfy the appropriate (homogeneous) boundary conditions on the unactuated boundaries. Contrary to Kasnakoğlu et al. (Reference Kasnakoğlu, Serrani and Efe2008) where the actuation modes were determined as the solution of an optimization problem from snapshots corresponding to the unactuated flow, here, we use actuated snapshots and rely on an heuristic approach that is generally employed in reduced-order modelling. This suggests that our selection of actuation modes might not be mathematically optimal but the main objective is that the actuation modes ‘properly’ describe the control action influence on the flow.
This section is organized as follows: first (§ 3.1), the constitutive equation of a Galerkin expansion with given actuation modes is discussed. In §§ 3.2–3.4, a hierarchy of actuation modes with increasingly refined resolution of the dynamic actuation is proposed. In § 3.2, a single actuation mode derived from the difference between actuated and unactuated mean flow is introduced. The second set of actuation modes (§ 3.3) distinguishes between the flow response from the steady and the oscillatory component of Coanda blowing. The third lifting method (§ 3.4) resolves phase-shifted flow structures from the oscillatory actuation.
3.1 Actuation modes as lifting method
A Galerkin model of fluid flow is based on an inner product in the observation region. In this study, a circular domain of five chord lengths surrounding the airfoil was chosen,
 $$\begin{eqnarray}\displaystyle {\it\Omega}:=\{(x,y):(x,y)\not \in \text{airfoil and }x^{2}+y^{2}\leqslant 5^{2}\}. & & \displaystyle\end{eqnarray}$$
This domain is large enough to resolve the main coherent structures and actuation effects, yet small enough to reduce long-term convection effects which are detrimental to the robustness of Galerkin models (Noack et al. Reference Noack, Morzyński and Tadmor2011).
The Galerkin expansion is defined in the space of square-integrable vector functions in the observation domain,
 $L^{2}({\it\Omega})$
. The corresponding inner product between two velocity fields
 $\boldsymbol{v}$
and
 $\boldsymbol{w}$
is defined by
 $$\begin{eqnarray}\displaystyle (\boldsymbol{v},\boldsymbol{w})_{{\it\Omega}}:=\int _{{\it\Omega}}\boldsymbol{v}\boldsymbol{\cdot }\boldsymbol{w}\,\text{d}\boldsymbol{x}, & & \displaystyle\end{eqnarray}$$
where the associated norm reads
 $\Vert \boldsymbol{v}\Vert _{{\it\Omega}}:=\sqrt{(\boldsymbol{v},\boldsymbol{ v})_{{\it\Omega}}}$
.
In
 $L^{2}({\it\Omega})$
, there exists a complete countable orthonormal basis
 $\{\boldsymbol{u}_{i}(\boldsymbol{x})\}_{i=1}^{\infty }$
, such that any velocity field can be arbitrarily closely approximated by a finite Galerkin expansion of
 $N$
modes. In the following search for the proper Galerkin expansion, we trade completeness for a minimal average residual of given snapshots
 $\boldsymbol{u}^{m}(\boldsymbol{x})$
,
 $m=1,\ldots ,M$
. This leads to the proper orthogonal decomposition
 $$\begin{eqnarray}\displaystyle \boldsymbol{u}(\boldsymbol{x},t)=\boldsymbol{u}_{0}(\boldsymbol{x})+\mathop{\sum }_{i=1}^{N}a_{i}(t)\boldsymbol{u}_{i}(\boldsymbol{x}), & & \displaystyle\end{eqnarray}$$
where
 $N$
is the number of retained POD modes,
 $\boldsymbol{u}_{0}$
denotes the mean flow,
 $\boldsymbol{u}_{i}$
are the spatial POD modes and
 $a_{i}$
are the temporal mode coefficients (Holmes et al.
Reference Holmes, Lumley, Berkooz and Rowley2012).
In the following, two averaging operators are defined.
 $\langle \cdot \rangle ^{u}$
denotes the time averaging operator of the unactuated flow between
 $t=0$
and
 $t_{s}$
, whereas
 $\langle \cdot \rangle ^{a}$
denotes that of the actuated flow between
 $t_{c}$
and
 $t_{e}$
. In this sense, the zeroth mode of (3.3) is defined as the mean base flow of the unactuated state
 $\boldsymbol{u}_{0}(\boldsymbol{x})=\langle \boldsymbol{u}(\boldsymbol{x},t)\rangle ^{u}$
.
Compared to unactuated flows, Galerkin expansions for actuated flows with a deforming surface face two additional challenges. First, the moving surface (oscillating lip in this case) and thus the domain
 ${\it\Omega}$
vary with time while the traditional approach of POD–Galerkin projection requires a fixed fluid domain. Second, the actuation does not enter explicitly as a free control command in the Galerkin expansion (3.3). The first challenge is solved by neglecting the small lip oscillations, since they are four orders of magnitude smaller than the chord length. Thus, all operations are performed on the steady domain corresponding to the unactuated state, as detailed in § 2.2, and the tiny lip motion is ignored in this Galerkin expansion. This simplification can be justified following the pioneering work of Bourguet, Braza & Dervieux (Reference Bourguet, Braza and Dervieux2011). In the Hadamard formulation, a solution of a partial differential equation (PDE) in a domain with small time-varying deformations is considered. The effect of these deformations can be approximated by a volume force in the PDE with a steady domain. This approximation leads to an additional linear actuation term in the Galerkin system.
The jet exit velocity at the slot exit mid-point
 $\boldsymbol{x}_{J}$
is selected as the free actuation command. Hence,
 $U_{J}$
given by (2.1) acts as boundary actuation for
 ${\it\Omega}$
, and
 $U_{J}\equiv 0$
represents unactuated flow. The standard lifting method (see § 3.2) constructs an actuation mode
 $\boldsymbol{u}_{-1}$
which describes the jet blowing such that
 $U_{J}(t)=a_{-1}(t)$
and
 $\Vert \boldsymbol{u}_{-1}(\boldsymbol{x}_{J})\Vert _{2}=1$
at the unsteady boundary, and vanishes at all other boundaries. Now,
 $\boldsymbol{u}_{0}+a_{-1}\boldsymbol{u}_{-1}$
satisfies the unsteady inhomogeneous boundary conditions at the airfoil and the oncoming flow at infinity. The POD decomposition is then applied to the modified snapshots, where
 $\boldsymbol{u}_{0}+a_{-1}\boldsymbol{u}_{-1}$
is subtracted. Thus, the POD modes – and arbitrary linear combinations thereof – also fulfil homogeneous boundary conditions. In the case of
 $N_{A}$
actuation modes, the general expression for the instantaneous velocity fields becomes
 $$\begin{eqnarray}\displaystyle \boldsymbol{u}(\boldsymbol{x},t)=\boldsymbol{u}_{0}(\boldsymbol{x})+\mathop{\sum }_{i=-N_{A}}^{-1}a_{i}^{[N_{A}]}(t)\boldsymbol{u}_{i}(\boldsymbol{x})+\mathop{\sum }_{i=1}^{N}a_{i}^{[N_{A}]}(t)\boldsymbol{u}_{i}^{[N_{A}]}(\boldsymbol{x}), & & \displaystyle\end{eqnarray}$$
where we change the notations of
 $a_{i}$
and
 $\boldsymbol{u}_{i}$
to emphasize in superscripts the dependence on the number of actuation modes
 $N_{A}$
. By construction (see §§ 3.2–3.4), the actuation modes
 $\boldsymbol{u}_{i}$
,
 $i=-N_{A},\ldots ,-1$
are independent of the number of actuation modes considered. In addition, the mode amplitude
 $a_{0}:=1$
has been introduced for convenience following Rempfer & Fasel (Reference Rempfer and Fasel1994). The flow at infinity and through the slot is described by the mean flow
 $\boldsymbol{u}_{0}$
and the actuation modes
 $\sum _{i=-N_{A}}^{-1}a_{i}^{[N_{A}]}\boldsymbol{u}_{i}$
, respectively. The POD modes
 $\boldsymbol{u}_{i}^{[N_{A}]}$
,
 $i=1,\ldots ,N$
satisfy homogeneous boundary conditions by construction. The actuation mode amplitudes
 $a_{i}^{[N_{A}]}$
,
 $i=-N_{A},\ldots ,-1$
represent free actuation commands.
For the purpose of homogenizing the boundary conditions of the POD modes, a single actuation mode
 $N_{A}=1$
enables a lifting of the boundary actuation into the Galerkin model. This actuation mode, however, lumps the flow response of the steady blowing and the oscillatory component. A refined analysis considers two actuation modes
 $N_{A}=2$
, one corresponding to steady blowing and one to the unsteady component. However, the convection of high-frequency structures also generates a phase-shifted flow response. Any harmonically oscillating coherent structures requires two modes for an accurate description. These considerations lead to three actuation modes
 $N_{A}=3$
. For easy reference, the corresponding Galerkin expansions (GE) for
 $N_{A}=1$
,
 $N_{A}=2$
and
 $N_{A}=3$
are termed GE
 $A$
,
 $B$
and
 $C$
, respectively. Figure 6 illustrates the link between these expansions and the decomposition of the actuation command. A preview on the corresponding computational algorithm is offered in figure 7 and will be explained in the following subsections.
Hierarchy of lifting methods visualized by the actuation velocity decomposition. The purpose behind each hierarchy level is explicated on the right-hand side.

Algorithm for computing the three Galerkin expansions. The definition of the mode amplitudes, the actuation modes and the resulting Galerkin expansion is provided on the left, centre and right, respectively.

3.2 Galerkin expansion A: standard lifting method with one actuation mode
The first actuation mode
 $i=-1$
resolves the difference between the actuated and the unactuated state and is computed in two steps:
 $$\begin{eqnarray}\displaystyle & \displaystyle \boldsymbol{u}_{-1}^{\ast }(\boldsymbol{x}):=\langle \boldsymbol{u}(\boldsymbol{x},t)\rangle ^{a}-\boldsymbol{u}_{0}(\boldsymbol{x}), & \displaystyle\end{eqnarray}$$
 $$\begin{eqnarray}\displaystyle & \displaystyle \boldsymbol{u}_{-1}(\boldsymbol{x}):=\frac{\boldsymbol{u}_{-1}^{\ast }(\boldsymbol{x})}{\Vert \boldsymbol{u}_{-1}^{\ast }(\boldsymbol{x}_{J})\Vert _{2}}. & \displaystyle\end{eqnarray}$$
 $$\begin{eqnarray}\displaystyle \Vert \boldsymbol{u}_{-1}(\boldsymbol{x}_{J})\Vert _{2}=1, & & \displaystyle\end{eqnarray}$$
and the fluctuating velocity at the exit can be expressed as
 $$\begin{eqnarray}\displaystyle \boldsymbol{U}_{J}(t):=\boldsymbol{u}^{\prime }(\boldsymbol{x}_{J},t)=a_{-1}^{[1]}(t)\boldsymbol{u}_{-1}(\boldsymbol{x}_{J}), & & \displaystyle\end{eqnarray}$$
where
 $\boldsymbol{u}^{\prime }(\boldsymbol{x},t)=\boldsymbol{u}(\boldsymbol{x},t)-\boldsymbol{u}_{0}(\boldsymbol{x})$
are the fluctuating velocity fields, and where the first actuation mode coefficient is defined as
 $$\begin{eqnarray}\displaystyle a_{-1}^{[1]}(t)=\left\{\begin{array}{@{}ll@{}}\displaystyle U_{J}(t)=B_{0}+B_{1}\cos ({\it\omega}^{a}t) & \text{during actuation;}\\ \displaystyle 0 & \text{otherwise.}\end{array}\right. & & \displaystyle\end{eqnarray}$$
In this case,
 $a_{-1}$
encompasses both the steady and the unsteady component of actuation.
The homogenized snapshots are then computed as
 $$\begin{eqnarray}\displaystyle \boldsymbol{u}_{A}^{[N_{A}]}(\boldsymbol{x},t):=\boldsymbol{u}^{\prime }(\boldsymbol{x},t)-a_{-1}^{[N_{A}]}(t)\boldsymbol{u}_{-1}(\boldsymbol{x}), & & \displaystyle\end{eqnarray}$$
with
 $N_{A}=1$
. By construction,
 $\boldsymbol{u}_{A}^{[1]}(\boldsymbol{x}_{J},t)\equiv \mathbf{0}$
, i.e. the homogeneous Dirichlet condition is fulfilled. This property carries over to the POD modes which are linear combinations of the snapshots. The Galerkin expansion reads
 $$\begin{eqnarray}\displaystyle \boldsymbol{u}(\boldsymbol{x},t)=\boldsymbol{u}_{0}(\boldsymbol{x})+a_{-1}^{[1]}(t)\boldsymbol{u}_{-1}+\mathop{\sum }_{i=1}^{N}a_{i}^{[1]}(t)\boldsymbol{u}_{i}^{[1]}(\boldsymbol{x}). & & \displaystyle\end{eqnarray}$$
We would like to emphasize that Galerkin expansion
 $A$
corresponds to the standard lifting procedure encountered in the literature (Graham et al.
Reference Graham, Peraire and Tang1999; Ravindran Reference Ravindran2000). It should be noted that (3.6) and a unit
 $L^{2}$
-norm are not compatible requirements. The physical interpretation of the mode coefficient is given higher priority over a
 $L^{2}$
unit norm.
3.3 Galerkin expansion B: two actuation modes for steady and unsteady blowing effects
With the addition of a second actuation mode, it becomes possible to divide the forcing term into its steady and fluctuating components. As such, the first actuation mode corresponds to steady blowing, whereas the second mode to oscillatory modulation. The definition of
 $\boldsymbol{u}_{-1}$
is the same as in GE
 $A$
, but with the mode coefficient defined as
 $$\begin{eqnarray}\displaystyle a_{-1}^{[2]}(t)=\left\{\begin{array}{@{}ll@{}}\displaystyle \langle U_{J}\rangle ^{a} & \text{during actuation;}\\ \displaystyle 0 & \text{otherwise.}\end{array}\right. & & \displaystyle\end{eqnarray}$$
The second actuation mode
 $i=-2$
is defined as
 $$\begin{eqnarray}\displaystyle \boldsymbol{u}_{-2}^{\ast }(\boldsymbol{x}):=\langle a_{-2}^{[2]}(t)\boldsymbol{u}_{A}^{[2]}(\boldsymbol{x},t)\rangle ^{a}, & & \displaystyle\end{eqnarray}$$
where
 $a_{-2}^{[2]}$
is the corresponding mode coefficient defined as
 $$\begin{eqnarray}\displaystyle a_{-2}^{[2]}(t)=\left\{\begin{array}{@{}ll@{}}\displaystyle U_{J}^{\prime }(t)\approx B_{1}\cos ({\it\omega}^{a}t) & \text{during actuation;}\\ \displaystyle 0 & \text{otherwise.}\end{array}\right. & & \displaystyle\end{eqnarray}$$
In an electric circuit analogy,
 $a_{-1}^{[2]}$
and
 $a_{-2}^{[2]}$
denote the direct current (DC) and alternating current (AC) components, respectively. The DC and AC components for GE
 $B$
are shown in figure 6. Similar to
 $\boldsymbol{u}_{-1}$
, the second actuation mode is normalized by its value at the slot exit,
 $$\begin{eqnarray}\displaystyle \boldsymbol{u}_{-2}(\boldsymbol{x}):=\frac{\boldsymbol{u}_{-2}^{\ast }(\boldsymbol{x})}{\Vert \boldsymbol{u}_{-2}^{\ast }(\boldsymbol{x}_{J})\Vert _{2}}. & & \displaystyle\end{eqnarray}$$
Thus, the fluctuating jet velocity reads,
 $$\begin{eqnarray}\displaystyle \boldsymbol{U}_{J}(t)=\boldsymbol{u}^{\prime }(\boldsymbol{x}_{J},t)=a_{-1}^{[2]}(t)\boldsymbol{u}_{-1}(\boldsymbol{x}_{J})+a_{-2}^{[2]}(t)\boldsymbol{u}_{-2}(\boldsymbol{x}_{J}). & & \displaystyle\end{eqnarray}$$
The POD is then computed from the homogenized snapshots,
 $$\begin{eqnarray}\displaystyle \boldsymbol{u}_{B}^{[2]}(\boldsymbol{x},t):=\boldsymbol{u}^{\prime }(\boldsymbol{x},t)-a_{-1}^{[2]}(t)\boldsymbol{u}_{-1}(\boldsymbol{x})-a_{-2}^{[2]}(t)\boldsymbol{u}_{-2}(\boldsymbol{x}) & & \displaystyle\end{eqnarray}$$
and the Galerkin expansion is expressed as,
 $$\begin{eqnarray}\displaystyle \boldsymbol{u}(\boldsymbol{x},t)=\boldsymbol{u}_{0}(\boldsymbol{x})+\mathop{\sum }_{i=-2}^{-1}a_{i}^{[2]}(t)\boldsymbol{u}_{i}(\boldsymbol{x})+\mathop{\sum }_{i=1}^{N}a_{i}^{[2]}(t)\boldsymbol{u}_{i}^{[2]}(\boldsymbol{x}). & & \displaystyle\end{eqnarray}$$
As discussed in § 3.2, an
 $L^{2}$
normalization of the actuation modes would obstruct the physical meaning of
 $a_{-1}^{[N_{A}]}$
and
 $a_{-2}^{[N_{A}]}$
. Following Kasnakoğlu et al. (Reference Kasnakoğlu, Serrani and Efe2008), one could envision, at minimum, an orthogonalization of the actuation mode with respect to each other and to the POD modes. This would simplify the resulting Galerkin system but has severe disadvantages. First, in Kasnakoğlu et al. (Reference Kasnakoğlu, Serrani and Efe2008), this orthonormalization is independent of the POD modes since the authors consider unactuated snapshots for determining the POD modes. In our approach, the POD modes are affected by the actuation modes. Second, we prefer to have identical actuation modes
 $\boldsymbol{u}_{-i}$
(
 $i=1,2,3$
) in Galerkin expansions
 $A$
,
 $B$
and
 $C$
. If the actuation modes are orthogonalized with respect to the POD modes, this independence is lost. Third, after the orthogonalization, the actuation modes would lose their physical meaning as correlated flow responses to the DC or AC actuation component.
3.4 Galerkin expansion C: three actuation modes for steady, unsteady and time-delayed blowing effects
The third actuation mode
 $i=-3$
is an additional unsteady mode that is time shifted with respect to the main unsteady actuation term. It is defined as,
 $$\begin{eqnarray}\displaystyle \boldsymbol{u}_{-3}^{\ast }(\boldsymbol{x}):=\langle a_{-3}^{[3]}(t)\boldsymbol{u}_{B}^{[2]}(\boldsymbol{x},t)\rangle ^{a}, & & \displaystyle\end{eqnarray}$$
where
 $$\begin{eqnarray}\displaystyle a_{-3}^{[3]}(t)=\left\{\begin{array}{@{}ll@{}}\displaystyle U_{J}^{\prime }(t-T/4)\approx B_{1}\sin ({\it\omega}^{a}t) & \text{during actuation;}\\ \displaystyle 0 & \text{otherwise,}\end{array}\right. & & \displaystyle\end{eqnarray}$$
and
 $T$
is one period of the actuated shedding cycle. The normalization of
 $\boldsymbol{u}_{-3}$
is less restricted than that of
 $\boldsymbol{u}_{-2}$
and
 $\boldsymbol{u}_{-1}$
, since the spatial evolution of the control is already represented by the first two actuation modes. Hence,
 $\boldsymbol{u}_{-3}$
must vanish at the exit (i.e.
 $\boldsymbol{u}_{-3}(\boldsymbol{x}_{J})=\mathbf{0}$
), and the fluctuating jet velocity reads,
 $$\begin{eqnarray}\displaystyle \boldsymbol{U}_{J}(t):=\boldsymbol{u}^{\prime }(\boldsymbol{x}_{J},t)=a_{-1}^{[3]}(t)\boldsymbol{u}_{-1}(\boldsymbol{x}_{J})+a_{-2}^{[3]}(t)\boldsymbol{u}_{-2}(\boldsymbol{x}_{J}), & & \displaystyle\end{eqnarray}$$
with
 $a_{-1}^{[3]}:=a_{-1}^{[2]}$
and
 $a_{-2}^{[3]}:=a_{-2}^{[2]}$
.
 $\boldsymbol{u}_{-3}$
is simply normalized by the same factor as the second actuation mode, i.e.
 $$\begin{eqnarray}\displaystyle \boldsymbol{u}_{-3}(\boldsymbol{x}):=\frac{\boldsymbol{u}_{-3}^{\ast }(\boldsymbol{x})}{\Vert \boldsymbol{u}_{-2}^{\ast }(\boldsymbol{x}_{J})\Vert _{2}}. & & \displaystyle\end{eqnarray}$$
This choice makes the fluctuation levels of the second and third actuation mode as an oscillatory flow response comparable.
The homogenized snapshots are determined as
 $$\begin{eqnarray}\displaystyle \boldsymbol{u}_{C}^{[3]}(\boldsymbol{x},t):=\boldsymbol{u}^{\prime }(\boldsymbol{x},t)-a_{-1}^{[3]}(t)\boldsymbol{u}_{-1}(\boldsymbol{x})-a_{-2}^{[3]}(t)\boldsymbol{u}_{-2}(\boldsymbol{x})-a_{-3}^{[3]}(t)\boldsymbol{u}_{-3}(\boldsymbol{x}) & & \displaystyle\end{eqnarray}$$
and the Galerkin expansion is expressed as
 $$\begin{eqnarray}\displaystyle \boldsymbol{u}(\boldsymbol{x},t)=\boldsymbol{u}_{0}(\boldsymbol{x})+\mathop{\sum }_{i=-3}^{-1}a_{i}^{[3]}(t)\boldsymbol{u}_{i}(\boldsymbol{x})+\mathop{\sum }_{i=1}^{N}a_{i}^{[3]}(t)\boldsymbol{u}_{i}^{[3]}(\boldsymbol{x}). & & \displaystyle\end{eqnarray}$$
For highly convective flows, the first POD modes are the most energetic. For the current flow, the first four POD modes contain 78 % of the total turbulent kinetic energy, and are deemed sufficient to represent the dynamics. The mean base flow, the first four POD modes and all three actuation modes for Galerkin expansion GE
 $C$
are shown in figure 8. By construction, the actuation modes are independent of
 $N_{A}$
, i.e. they are the same for GE
 $A$
and
 $B$
and therefore are not shown separately. All modes can be physically interpreted. Mode
 $\boldsymbol{u}_{0}$
represents the unactuated low-lift base flow. The first actuation mode
 $\boldsymbol{u}_{-1}$
displays the difference to the high-lift actuated equilibrium. The nearly circular streamlines clearly indicate the enhanced lift. The higher-order actuation modes
 $\boldsymbol{u}_{-2}$
and
 $\boldsymbol{u}_{-3}$
resolve the oscillatory flow response to the blowing modulation, as intended by construction.
The mean base flow, the first four POD modes and all three actuation modes for Galerkin expansion GE
 $C$
. The results are visualized by the vorticity fields and vortex lines.

The first two POD modes
 $\boldsymbol{u}_{1}^{[3]}$
and
 $\boldsymbol{u}_{2}^{[3]}$
represent von Kármán vortex shedding. The third and fourth mode
 $\boldsymbol{u}_{3}^{[3]}$
and
 $\boldsymbol{u}_{4}^{[3]}$
resolve slow transient base flow changes;
 $\boldsymbol{u}_{3}^{[3]}$
resolves global flow changes, while
 $\boldsymbol{u}_{4}^{[3]}$
is concentrated in the near wake. Their coefficients get non-vanishing amplitudes during change of the actuation and vanish with time. Thus, these modes can be considered as transient modes. Their impact on the Galerkin system dynamics will be elaborated in §§ 4 and 5.
The Galerkin expansion of the high-lift configuration by Luchtenburg et al. (Reference Luchtenburg, Günther, Noack, King and Tadmor2009) constitutes a good basis for comparison with the current study. In both models, the first POD mode pair resolves unactuated vortex shedding. Luchtenburg et al. (Reference Luchtenburg, Günther, Noack, King and Tadmor2009) incorporate the high-frequency flow response in modes 3 and 4. These modes resolve the forcing of the zero-net-mass-flux actuator and their amplitudes are determined by the Galerkin system. Base-flow changes in the Galerkin system are not kinematically resolved. In the present study, actuation modes
 $i=-2$
and
 $i=-3$
take on this role commanded by control. The response to steady and unsteady is kinematically and dynamically resolved with additional modes corresponding to the indices
 $i=-1$
,
 $-2$
and
 $-3$
.
The first four POD modes
 $\boldsymbol{u}_{i}$
(
 $i=1,\ldots ,4$
) depend hardly on the number of actuation modes considered for their determination. For this reason, we remove hereafter in our notation the explicit dependence of
 $N_{A}$
for the spatial POD modes
 $\boldsymbol{u}_{i}$
and the temporal mode coefficients
 $a_{i}$
.
4 Galerkin modelling
In this section, a low-dimensional Galerkin model with sparse, analytically tractable dynamics is derived. This derivation starts from the Galerkin expansion of § 3 and involves mean-field considerations and the Galerkin projection. The resulting models resolve key dynamic features of the high-lift configuration: a self-amplified, amplitude-limited oscillatory dynamics which is mitigated by actuation with steady and high-frequency components. Focus is placed on low-order state-space and sparse dynamical systems providing crisp intuitive access to the physical actuation mechanism. The structure of the Galerkin system is derived from a mean-field consideration (§ 4.1) and an analysis of the mean-field dynamics (§ 4.2), generalising Luchtenburg et al. (Reference Luchtenburg, Günther, Noack, King and Tadmor2009). The dynamics motivates a cubic term (§ 4.3) and a noise term (§ 4.4) as envisioned by the POD model of Aubry et al. (Reference Aubry, Holmes, Lumley and Stone1988). Section 4.5 introduces the most general Galerkin system from a Galerkin projection on the expansion (3.23) of § 3. These considerations lead to a hierarchy of investigated Galerkin models which are elaborated in § 5. The structure of all presented Galerkin models is motivated by first principles and assumed solution properties. Yet, we refrain from deriving the Galerkin system coefficients from Galerkin projection, subscale turbulence representations and actuation models (Noack et al. Reference Noack, Morzyński and Tadmor2011). Instead, these coefficients are identified with a 4D-Var method as described in appendix A. The resulting Galerkin models yield by definition the optimal performance achievable of physics-based approaches.
4.1 Derivation of the mean-field model
The following consideration contains two key components of mean-field theory (Stuart Reference Stuart1971), namely frequency decomposition and slaving. The resulting Galerkin expansion is based on a standard inner product of square-integrable fields in steady observation domain
 ${\it\Omega}$
as introduced in (3.2). We shall not pause to include a bifurcation expansion as this is irrelevant for a turbulent flow.
The mean-field model will be derived in four steps. First, a suitable mean-field expansion is developed (§ 4.1.1). Second, the dynamics of the natural frequency is derived (§ 4.1.2). Third, the dynamics of the forcing frequency is considered (§ 4.1.3). Finally, the base flow dynamics is investigated (§ 4.1.4).
4.1.1 Mean-field expansion
The considered flow has three frequency components: a slowly varying mean-field
 $\boldsymbol{u}^{b}$
(superscript ‘
 $b$
’ for base flow), a natural shedding component
 $\boldsymbol{u}^{u}$
(superscript ‘
 $u$
’ for unforced) and a forced high-frequency component
 $\boldsymbol{u}^{a}$
(superscript ‘
 $a$
’ for actuated):
 $$\begin{eqnarray}\displaystyle \boldsymbol{u}(\boldsymbol{x},t)=\boldsymbol{u}^{b}(\boldsymbol{x},t)+\boldsymbol{u}^{u}(\boldsymbol{x},t)+\boldsymbol{u}^{a}(\boldsymbol{x},t). & & \displaystyle\end{eqnarray}$$
Upon short-term averaging the terms with natural and high frequency vanish. The harmonic contribution at natural shedding frequency may be composed of two modes
 $\boldsymbol{u}_{1}$
,
 $\boldsymbol{u}_{2}$
,
 $$\begin{eqnarray}\displaystyle \boldsymbol{u}^{u}(\boldsymbol{x},t)=a_{1}(t)\boldsymbol{u}_{1}(\boldsymbol{x})+a_{2}(t)\boldsymbol{u}_{2}(\boldsymbol{x}). & & \displaystyle\end{eqnarray}$$
In what follows, POD modes 1 and 2 of figure 8 are taken as
 $\boldsymbol{u}_{i}$
,
 $i=1,2$
. These two modes may also be obtained from the real and imaginary part of the dominant Fourier mode, from the first two POD modes of natural shedding or from any other suitable filter. Higher harmonics tend to be small and are neglected. The corresponding mode amplitudes describe in good approximation a limit cycle
 $$\begin{eqnarray}\displaystyle a_{1}(t)=r\cos ({\it\phi}),\quad a_{2}(t)=r\sin ({\it\phi}),\quad \frac{\text{d}{\it\phi}}{\text{d}t}={\it\omega} & & \displaystyle\end{eqnarray}$$
were
 ${\it\phi}$
is the phase,
 ${\it\omega}$
a constant or slowly varying angular frequency and
 $r$
a constant or slowly varying amplitude. Without loss of generality,
 $a_{1}$
follows the cosine function. Otherwise, the origin of the time is shifted. Similarly,
 $a_{2}$
follows the sinus. Otherwise, the second mode
 $\boldsymbol{u}_{2}$
needs to be adjusted.
In completely analogous manner, the high-frequency contribution is characterized by
 $$\begin{eqnarray}\displaystyle \boldsymbol{u}^{a}(\boldsymbol{x},t)=a_{-2}(t)\boldsymbol{u}_{-2}(\boldsymbol{x})+a_{-3}(t)\boldsymbol{u}_{-3}(\boldsymbol{x}), & & \displaystyle\end{eqnarray}$$
and
 $$\begin{eqnarray}\displaystyle a_{-2}(t)=s\cos ({\it\omega}^{a}t),\quad a_{-3}(t)=s\sin ({\it\omega}^{a}t). & & \displaystyle\end{eqnarray}$$
In the choice of symbols for the modes and their amplitudes we have anticipated the use of actuations modes
 $-2$
and
 $-3$
of figure 8 for the flow response at forcing frequency.
The base flow is conceptualized as the sum of the steady Navier–Stokes solution
 $\boldsymbol{u}_{s}$
and a constant or slowly varying base-flow deformation
 $\boldsymbol{u}^{{\it\Delta}}$
, following mean-field theory and departing from the POD expansion of § 3,
 $$\begin{eqnarray}\displaystyle \boldsymbol{u}^{b}(\boldsymbol{x},t)=\boldsymbol{u}_{s}(\boldsymbol{x})+\boldsymbol{u}^{{\it\Delta}}(\boldsymbol{x},t). & & \displaystyle\end{eqnarray}$$
The unforced base-flow deformation may be characterized by a single mode
 $\boldsymbol{u}_{3}$
pointing from the steady solution to the unforced mean flow
 $\langle \boldsymbol{u}\rangle ^{u}$
, often called the shift mode (Noack et al.
Reference Noack, Afanasiev, Morzyński, Tadmor and Thiele2003; Tadmor et al.
Reference Tadmor, Lehmann, Noack and Morzyński2010). The corresponding shift mode amplitude
 $a_{3}$
is driven by the fluctuation of the vortex shedding and considered as a slowly varying quantity. Changes by steady blowing may be incorporated in a single actuation mode
 $\boldsymbol{u}_{-1}$
pointing from the unforced averaged velocity to the averaged actuated one
 $\langle \boldsymbol{u}\rangle ^{a}$
(Weller, Lombardi & Iollo Reference Weller, Lombardi and Iollo2009). The amplitude
 $a_{-1}$
determines the strength of blowing in the high-lift configuration. An additional mode
 $\boldsymbol{u}_{4}$
may be needed to capture transient effects parameterized by the amplitude
 $a_{4}$
. Summarizing, the mean-field deformation reads
 $$\begin{eqnarray}\displaystyle \boldsymbol{u}^{{\it\Delta}}(\boldsymbol{x},t)=a_{-1}(t)\boldsymbol{u}_{-1}(\boldsymbol{x})+a_{3}(t)\boldsymbol{u}_{3}(\boldsymbol{x})+a_{4}(t)\boldsymbol{u}_{4}(\boldsymbol{x}) & & \displaystyle\end{eqnarray}$$
and (4.1) becomes
 $$\begin{eqnarray}\displaystyle \boldsymbol{u}(\boldsymbol{x},t)=\boldsymbol{u}_{s}(\boldsymbol{x})+\mathop{\sum }_{i=-3}^{4}a_{i}(t)\boldsymbol{u}_{i}(\boldsymbol{x}). & & \displaystyle\end{eqnarray}$$
The resulting components of the mean-field expansion are catalogued in table 1.
Components of the mean-field expansion. The table comprises unforced (top) and forced components (bottom) contributing to the base flow
 $\boldsymbol{u}^{b}$
(left), the vortex shedding
 $\boldsymbol{u}^{u}$
(middle) and the high-frequency actuation
 $\boldsymbol{u}^{a}$
(right).

4.1.2 Dynamics of the natural frequency
The dynamics of the mean-field expansion may be inferred from the non-dimensionalized Navier–Stokes equation,
 $$\begin{eqnarray}\displaystyle \partial _{t}\boldsymbol{u}=\frac{1}{Re}{\rm\Delta}\boldsymbol{u}-\boldsymbol{{\rm\nabla}}\boldsymbol{u}\otimes \boldsymbol{u}-\boldsymbol{{\rm\nabla}}p. & & \displaystyle\end{eqnarray}$$
Here
 $\partial _{t}$
,
 $\boldsymbol{{\rm\nabla}}$
and
 ${\rm\Delta}$
denote the partial temporal derivative, the nabla operator and Laplace operator, respectively. The product sign
 $\otimes$
denotes an outer tensor product, also called dyadic vector product. We shall not pause to discuss the pressure term as it will vanish under Galerkin projection for sufficiently large domains (Deane et al.
Reference Deane, Kevrekidis, Karniadakis and Orszag1991; Noack, Papas & Monkewitz Reference Noack, Papas and Monkewitz2005).
The natural frequency component of (4.9) is described by
 $$\begin{eqnarray}\displaystyle \partial _{t}\boldsymbol{u}^{u}=\frac{1}{Re}{\rm\Delta}\boldsymbol{u}^{u}-\boldsymbol{{\rm\nabla}}\boldsymbol{u}^{b}\otimes \boldsymbol{u}^{u}-\boldsymbol{{\rm\nabla}}\boldsymbol{u}^{u}\otimes \boldsymbol{u}^{b}-\boldsymbol{{\rm\nabla}}p^{u}. & & \displaystyle\end{eqnarray}$$
All other terms of (4.8) vanish upon filtering at frequency
 ${\it\omega}$
. For the following, we assume that
 $\boldsymbol{u}_{1}$
and
 $\boldsymbol{u}_{2}$
are orthogonal,
 $(\boldsymbol{u}_{1},\boldsymbol{u}_{2})_{{\it\Omega}}=0$
. Otherwise, the modes may be orthogonalized. From (4.6) and (4.2), Galerkin projection on
 $\boldsymbol{u}_{i}$
and
 $i=1,2$
yields
 $$\begin{eqnarray}\displaystyle \frac{\text{d}}{\text{d}t}\left(\begin{array}{@{}c@{}}a_{1}\\ \displaystyle a_{2}\end{array}\right)=\unicode[STIX]{x1D63C}\left(\begin{array}{@{}c@{}}a_{1}\\ \displaystyle a_{2}\end{array}\right)\quad \text{where }\unicode[STIX]{x1D63C}=\unicode[STIX]{x1D63C}_{s}+a_{-1}\unicode[STIX]{x1D63C}_{-1}+a_{3}\unicode[STIX]{x1D63C}_{3}+a_{4}\unicode[STIX]{x1D63C}_{4}. & & \displaystyle\end{eqnarray}$$
Here, the system matrix
 $\unicode[STIX]{x1D63C}=\big(\begin{smallmatrix}\unicode[STIX]{x1D608}_{11} & \unicode[STIX]{x1D608}_{12}\\ \unicode[STIX]{x1D608}_{21} & \unicode[STIX]{x1D608}_{22}\end{smallmatrix}\big)$
depends affinely on
 $a_{-1}$
,
 $a_{3}$
and
 $a_{4}$
.
 $\unicode[STIX]{x1D63C}_{s}$
corresponds to the
 $2\times 2$
matrix from a linearization around the fixed point
 $\boldsymbol{u}_{s}$
,
 $\unicode[STIX]{x1D63C}_{3}$
characterises a change of the dynamics from an unforced mean-field deformation, and
 $\unicode[STIX]{x1D63C}_{-1}$
and
 $\unicode[STIX]{x1D63C}_{4}$
the corresponding change from actuation. The assumed ansatz (4.3) further restricts the system matrix to
 $$\begin{eqnarray}\displaystyle & \displaystyle \unicode[STIX]{x1D608}_{11}=\unicode[STIX]{x1D608}_{22}={\it\sigma}_{1}-{\it\beta}_{-1}a_{-1}-{\it\beta}_{3}a_{3}-{\it\beta}_{4}a_{4}, & \displaystyle\end{eqnarray}$$
 $$\begin{eqnarray}\displaystyle & \displaystyle -\unicode[STIX]{x1D608}_{12}=\unicode[STIX]{x1D608}_{21}={\it\omega}_{1}+{\it\gamma}_{-1}a_{-1}+{\it\gamma}_{3}a_{3}+{\it\gamma}_{4}a_{4}. & \displaystyle\end{eqnarray}$$
 ${\it\sigma}_{1}$
near the fixed point and its changes from mean-flow deformation parameterised by
 $a_{-1}$
,
 $a_{3}$
and
 $a_{4}$
. The second equation (4.12b
) is the analogue for the frequency.
4.1.3 Dynamics of the forcing frequency
In this study, the flow component at forcing frequency is kinematically imposed by the actuation command
 $a_{-2}$
and
 $a_{-3}$
and the corresponding actuation modes
 $\boldsymbol{u}_{-2}$
and
 $\boldsymbol{u}_{-3}$
. This is the most simple representation of the actuation component.
In Luchtenburg et al. (Reference Luchtenburg, Günther, Noack, King and Tadmor2009), the actuated flow follows an oscillatory dynamics described by a stable forced oscillator
 $$\begin{eqnarray}\displaystyle & \displaystyle \text{d}a_{3}/\text{d}t={\it\sigma}^{a}a_{3}-{\it\omega}^{a}a_{4}+g_{3}(t), & \displaystyle\end{eqnarray}$$
 $$\begin{eqnarray}\displaystyle & \displaystyle \text{d}a_{4}/\text{d}t={\it\sigma}^{a}a_{4}+{\it\omega}^{a}a_{3}+g_{4}(t), & \displaystyle\end{eqnarray}$$
 ${\it\sigma}^{a}$
and
 ${\it\omega}^{a}$
are the growth rate and frequency of a stable oscillator and
 $g_{3}$
and
 $g_{4}$
represent
 ${\it\omega}^{a}$
-periodic forcing. This refined model accounts for time delays from forcing to flow response. In this study, we choose the more simple kinematic representation because the high-frequency component was found to be small and the time delays are not critical.
4.1.4 Dynamics of the base flow
The slowly varying base flow near the fixed point is described by the linearized Reynolds equation,
 $$\begin{eqnarray}\displaystyle \partial _{t}\boldsymbol{u}^{{\it\Delta}}=\frac{1}{Re}{\rm\Delta}\boldsymbol{u}^{{\it\Delta}}-\boldsymbol{{\rm\nabla}}\boldsymbol{u}_{s}\otimes \boldsymbol{u}^{{\it\Delta}}-\boldsymbol{{\rm\nabla}}\boldsymbol{u}^{{\it\Delta}}\otimes \boldsymbol{u}_{s}-\boldsymbol{{\rm\nabla}}\langle \boldsymbol{u}^{u}\otimes \boldsymbol{u}^{u}\rangle -\boldsymbol{{\rm\nabla}}\langle \boldsymbol{u}^{a}\otimes \boldsymbol{u}^{a}\rangle -\boldsymbol{{\rm\nabla}}p^{b}.\quad & & \displaystyle\end{eqnarray}$$
This equation is obtained by substituting the mean-field expansion (4.8) in the Navier–Stokes equation (4.9), subtracting the steady Navier–Stokes equation for
 $\boldsymbol{u}_{s}$
, filtering out the natural and forced frequency terms and neglecting the second-order term
 $-\boldsymbol{{\rm\nabla}}\boldsymbol{u}^{{\it\Delta}}\otimes \boldsymbol{u}^{{\it\Delta}}$
. The first three terms on the right-hand side of (4.14) denote a linear operator in
 $\boldsymbol{u}^{{\it\Delta}}$
, the fourth one the Reynolds stress at the natural frequency and the fifth the analogue for the forcing frequency. The brackets denote short-time averages.
For simplicity, we assume that
 $\boldsymbol{u}_{3}$
and
 $\boldsymbol{u}_{4}$
are orthogonal to each other. A Galerkin projection of (4.14) on both shift modes yields
 $$\begin{eqnarray}\displaystyle & \displaystyle \frac{\text{d}a_{3}}{\text{d}t}=l_{3,-1}a_{-1}+l_{33}a_{3}+l_{34}a_{4}+{\it\alpha}_{3r}r^{2}+{\it\alpha}_{3s}s^{2}, & \displaystyle\end{eqnarray}$$
 $$\begin{eqnarray}\displaystyle & \displaystyle \frac{\text{d}a_{4}}{\text{d}t}=l_{4,-1}a_{-1}+l_{43}a_{3}+l_{44}a_{4}+{\it\alpha}_{4r}r^{2}+{\it\alpha}_{4s}s^{2}. & \displaystyle\end{eqnarray}$$
 $l_{ij}$
parameterise the linear operator for
 $\boldsymbol{u}^{{\it\Delta}}$
of (4.14). The coefficients
 ${\it\alpha}_{\star }$
represent the gain of the Reynolds stresses at natural and forced frequency on the shift-mode amplitudes. We did not include an evolution equation for
 $a_{-1}$
as the blowing is imposed in our high-lift configuration.
4.2 Dynamics of the mean-field model
Summarizing (4.11), (4.12) and (4.15), the resulting mean-field system reads
 $$\begin{eqnarray}\displaystyle & \displaystyle \frac{\text{d}a_{1}}{\text{d}t}={\it\sigma}a_{1}-{\it\omega}a_{2}, & \displaystyle\end{eqnarray}$$
 $$\begin{eqnarray}\displaystyle & \displaystyle \frac{\text{d}a_{2}}{\text{d}t}={\it\sigma}a_{2}+{\it\omega}a_{1}, & \displaystyle\end{eqnarray}$$
 $$\begin{eqnarray}\displaystyle & \displaystyle \frac{\text{d}a_{3}}{\text{d}t}=l_{3,-1}a_{-1}+l_{33}a_{3}+l_{34}a_{4}+{\it\alpha}_{3r}r^{2}+{\it\alpha}_{3s}s^{2}, & \displaystyle\end{eqnarray}$$
 $$\begin{eqnarray}\displaystyle & \displaystyle \frac{\text{d}a_{4}}{\text{d}t}=l_{4,-1}a_{-1}+l_{43}a_{3}+l_{44}a_{4}+{\it\alpha}_{4r}r^{2}+{\it\alpha}_{4s}s^{2}, & \displaystyle\end{eqnarray}$$
 $$\begin{eqnarray}\displaystyle & \displaystyle {\it\sigma}={\it\sigma}_{1}-{\it\beta}_{-1}a_{-1}-{\it\beta}_{3}a_{3}-{\it\beta}_{4}a_{4}, & \displaystyle\end{eqnarray}$$
 $$\begin{eqnarray}\displaystyle & \displaystyle {\it\omega}={\it\omega}_{1}+{\it\gamma}_{-1}a_{-1}+{\it\gamma}_{3}a_{3}+{\it\gamma}_{4}a_{4}, & \displaystyle\end{eqnarray}$$
 $$\begin{eqnarray}\displaystyle & \displaystyle r=\sqrt{a_{1}^{2}+a_{2}^{2}}, & \displaystyle\end{eqnarray}$$
 $$\begin{eqnarray}\displaystyle & \displaystyle s=\sqrt{a_{-2}^{2}+a_{-3}^{2}}. & \displaystyle\end{eqnarray}$$
 $a_{1}$
,
 $a_{2}$
,
 $a_{3}$
and
 $a_{4}$
are considered as dynamic state variables while the forcing parameters
 $a_{-1}$
,
 $a_{-2}$
and
 $a_{-3}$
are exogenous inputs.
Equation (4.16) describes a self-amplified, amplitude-limited oscillation which is mitigated by steady- or high-frequency actuation. In the following, we consider special cases which illuminate the role of the coefficients, the states and their dynamic interaction.
(1) Unforced equilibrium. By construction, i.e. the Galerkin expansion (4.8), the unforced fixed point
 $\boldsymbol{u}_{s}$
is a trivial solution of (4.16). This implies
 $a_{1}=a_{2}=a_{3}=a_{4}=0$
and the absense of actuation
 $a_{-1}=a_{-2}=a_{-3}=0$
. This is readily seen to satisfy the mean-field system.
(2) Linear unforced dynamics
 $(a_{-1}=a_{-2}=a_{-3}=a_{4}=0)$
. Linearizing the unforced dynamics around the fixed point yields an oscillator
 $$\begin{eqnarray}\displaystyle \frac{\text{d}a_{1}}{\text{d}t}={\it\sigma}_{1}a_{1}-{\it\omega}_{1}a_{2},\quad \frac{\text{d}a_{2}}{\text{d}t}={\it\sigma}_{1}a_{2}+{\it\omega}_{1}a_{1},\quad a_{3}=0. & & \displaystyle\end{eqnarray}$$
The assumed self-amplification requires a positive growth rate
 ${\it\sigma}_{1}>0$
. The shift-mode amplitude should be linearly stable
 $l_{33}<0$
as it is only driven by the Reynolds stresses.
(3) Unforced periodic dynamics
 $(a_{-1}=a_{-2}=a_{-3}=a_{4}=0)$
. The initial oscillations converge to a periodic limit cycle implying a vanishing growth rate
 ${\it\sigma}=0$
, converged shift-mode amplitude
 $\text{d}a_{3}/\text{d}t=0$
and
 ${\it\beta}_{3}>0$
. The resulting oscillation and shift-mode amplitude read
 $$\begin{eqnarray}\displaystyle r=\sqrt{\frac{-{\it\sigma}_{1}l_{33}}{{\it\alpha}_{3r}{\it\beta}_{3}}},\quad a_{3}=\frac{{\it\sigma}_{1}}{{\it\beta}_{3}}. & & \displaystyle\end{eqnarray}$$
(4) Unforced transient dynamics
 $(a_{-1}=a_{-2}=a_{-3}=a_{4}=0)$
. Inserting vanishing forcing in (4.16) yields a mean-field Galerkin model (Noack et al.
Reference Noack, Afanasiev, Morzyński, Tadmor and Thiele2003):
 $$\begin{eqnarray}\displaystyle & \displaystyle \frac{\text{d}a_{1}}{\text{d}t}=({\it\sigma}_{1}-{\it\beta}_{3}a_{3})a_{1}-({\it\omega}_{1}+{\it\gamma}_{3}a_{3})a_{2}, & \displaystyle\end{eqnarray}$$
 $$\begin{eqnarray}\displaystyle & \displaystyle \frac{\text{d}a_{2}}{\text{d}t}=({\it\sigma}_{1}-{\it\beta}_{3}a_{3})a_{2}+({\it\omega}_{1}+{\it\gamma}_{3}a_{3})a_{1}, & \displaystyle\end{eqnarray}$$
 $$\begin{eqnarray}\displaystyle & \displaystyle \frac{\text{d}a_{3}}{\text{d}t}=l_{33}a_{3}+{\it\alpha}_{3r}(a_{1}^{2}+a_{2}^{2}). & \displaystyle\end{eqnarray}$$
 $\text{d}a_{3}/\text{d}t=0$
in (4.19c
). This yields the descriptor system
 $$\begin{eqnarray}\displaystyle & \displaystyle \frac{\text{d}a_{1}}{\text{d}t}=({\it\sigma}_{1}-{\it\beta}_{r}r^{2})a_{1}-({\it\omega}_{1}+{\it\gamma}_{r}r^{2})a_{2}, & \displaystyle\end{eqnarray}$$
 $$\begin{eqnarray}\displaystyle & \displaystyle \frac{\text{d}a_{2}}{\text{d}t}=({\it\sigma}_{1}-{\it\beta}_{r}r^{2})a_{2}+({\it\omega}_{1}+{\it\gamma}_{r}r^{2})a_{1}, & \displaystyle\end{eqnarray}$$
 $$\begin{eqnarray}\displaystyle & \displaystyle a_{3}={\it\alpha}_{r}r^{2}, & \displaystyle\end{eqnarray}$$
 ${\it\alpha}_{r}=-{\it\alpha}_{3r}/l_{33}>0$
,
 ${\it\beta}_{r}={\it\alpha}_{r}{\it\beta}_{3}>0$
and
 ${\it\gamma}_{r}={\it\alpha}_{r}{\it\gamma}_{3}$
. The state lives on a mean-field paraboloid (4.20c
) centred around the fixed point (case 1), parallel to its stable manifold (case 2) and accommodating the limit cycle (case 3). The oscillation amplitude of (4.20) is described by the famous Landau equation
 $$\begin{eqnarray}\displaystyle \frac{\text{d}r}{\text{d}t}={\it\sigma}_{1}r-{\it\beta}_{r}r^{3}. & & \displaystyle\end{eqnarray}$$
The slaving assumption is found to be valid for the laminar cylinder wake at distinctly supercritical Reynolds numbers from direct numerical simulations (Noack et al.
Reference Noack, Afanasiev, Morzyński, Tadmor and Thiele2003) and from the identified parameters
 $|l_{33}|\gg {\it\sigma}_{1}$
(Tadmor & Noack Reference Tadmor and Noack2004). Experiments with turbulent wakes also corroborate the existence of a mean-field paraboloid (Bourgeois, Martinuzzi & Noack Reference Bourgeois, Martinuzzi and Noack2013; Hosseini, Martinuzzi & Noack Reference Hosseini, Martinuzzi and Noack2015). More complex mean-field Galerkin models with cubic terms have already been proposed by Aubry et al. (Reference Aubry, Holmes, Lumley and Stone1988) and elaborated by Podvin (Reference Podvin2009).
(5) Shedding suppression by steady actuation. The high-lift configuration is designed to stabilise vortex shedding with steady Coanda blowing
 $a_{-1}>0$
,
 $a_{-2}=a_{-3}=a_{4}=0$
. In the mean-field model (4.16), this stabilisation implies
 ${\it\sigma}<0$
for
 $a_{3}=a_{4}=0$
. For blowing
 $a_{-1}>0$
, negative growth rates can only be achieved with
 ${\it\beta}_{-1}>0$
. Summarizing, (4.16e
) determines the minimal blow rate for complete stabilisation:
 $$\begin{eqnarray}\displaystyle {\it\sigma}={\it\sigma}_{1}-{\it\beta}_{-1}a_{-1}<0\Rightarrow a_{-1}>\frac{{\it\sigma}_{1}}{{\it\beta}_{-1}}. & & \displaystyle\end{eqnarray}$$
The blow rate increases with natural growth rate
 ${\it\sigma}_{1}$
and decreases with the actuation gain
 ${\it\beta}_{-1}$
.
(6) Shedding suppression by high-frequency actuation. As a last case, we mention that (4.16) incorporates – in principle – the stabilizing effect of ‘pure’ high-frequency forcing (Glezer, Amitay & Honohan Reference Glezer, Amitay and Honohan2005; Luchtenburg et al.
Reference Luchtenburg, Günther, Noack, King and Tadmor2009), i.e.
 $a_{-1}\equiv 0$
and
 $s^{2}=a_{-2}^{2}+a_{-3}^{2}>0$
. High-frequency forcing introduces a Reynolds stress which changes the corresponding shift-mode amplitude
 $a_{4}$
as portrayed in (4.16d
). Without loss of generality, we can assume
 $a_{4}>0$
or change the sign of
 $\boldsymbol{u}_{4}$
. This base flow change affects the stability of vortex shedding (4.16e
). A minimal base-flow change for complete stabilisation is given by
 $$\begin{eqnarray}\displaystyle {\it\sigma}={\it\sigma}_{1}-{\it\beta}_{4}a_{4}<0\Rightarrow a_{4}>\frac{{\it\sigma}_{1}}{{\it\beta}_{4}} & & \displaystyle\end{eqnarray}$$
implying
 ${\it\beta}_{4}>0$
. This minimal mean-field deformation translates into a minimal actuation fluctuation level which can be derived from (4.16d
). This equation simplifies for stabilization,
 $r=a_{3}=0$
and equilibrium conditions,
 $\text{d}a_{4}/\text{d}t=0$
, to
 $$\begin{eqnarray}\displaystyle l_{44}a_{4}+{\it\alpha}_{4s}s^{2}=0, & & \displaystyle\end{eqnarray}$$
which defines another mean-field paraboloid for the forced dynamics.
We do not claim that pure high-frequency forcing will mitigate vortex shedding for the studied high-lift configuration – unlike another actuation study by Luchtenburg et al. (Reference Luchtenburg, Günther, Noack, King and Tadmor2009). But the mean-field model structure should also include this mechanism as the derivation assumes nothing about the particular form of actuation.
4.3 The need for a cubic term
The mean-field model (4.16) is based on a shift mode
 $\boldsymbol{u}_{3}$
for unforced dynamics. The construction of the shift mode requires the knowledge of the unstable solution which is an art in itself (Åkervic et al.
Reference Åkervic, Brandt, Henningson, Hœpffner, Marxen and Schlatter2006). In this study, the steady solution and hence the shift mode are not available, but accounted for by mean-field paraboloid (4.20c
). The result is a three-dimensional model:
 $$\begin{eqnarray}\displaystyle & \displaystyle \frac{\text{d}a_{1}}{\text{d}t}={\it\sigma}a_{1}-{\it\omega}a_{2}, & \displaystyle\end{eqnarray}$$
 $$\begin{eqnarray}\displaystyle & \displaystyle \frac{\text{d}a_{2}}{\text{d}t}={\it\sigma}a_{2}+{\it\omega}a_{1}, & \displaystyle\end{eqnarray}$$
 $$\begin{eqnarray}\displaystyle & \displaystyle \frac{\text{d}a_{4}}{\text{d}t}=l_{4,-1}a_{-1}+l_{44}a_{4}+{\it\alpha}_{4r}r^{2}+{\it\alpha}_{4s}s^{2}, & \displaystyle\end{eqnarray}$$
 $$\begin{eqnarray}\displaystyle & \displaystyle {\it\sigma}={\it\sigma}_{1}-{\it\beta}_{-1}a_{-1}-{\it\beta}_{4}a_{4}-{\it\beta}_{r}r^{2}, & \displaystyle\end{eqnarray}$$
 $$\begin{eqnarray}\displaystyle & \displaystyle {\it\omega}={\it\omega}_{1}+{\it\gamma}_{-1}a_{-1}+{\it\gamma}_{4}a_{4}+{\it\gamma}_{r}r^{2}. & \displaystyle\end{eqnarray}$$
 $-{\it\beta}_{r}r^{2}a_{1}$
in (4.25a
) replaces
 $-{\it\beta}_{3}a_{3}a_{1}$
from (4.16a
) using (4.20c
). An analogous statement holds for (4.25b
). In (4.25c
),
 $l_{43}a_{3}$
of (4.16d
) is incorporated in a changed value of
 ${\it\alpha}_{4r}$
, since
 $l_{43}a_{3}+{\it\alpha}_{4r}r^{2}=(l_{43}{\it\alpha}_{r}+{\it\alpha}_{4r})r^{2}$
. In (4.25d
), the
 $a_{3}$
-term of (4.16e
) has been transferred to the cubic term.
4.4 The need for a noise term
The mean-field model (4.16) elucidates how actuation suppresses vortex shedding. This includes the off–on transient from natural shedding to forced suppression. The on–off transient from suppression to natural shedding is more challenging. Once, vortex shedding is suppressed,
 $r=0$
, the equations have no resurrection mechanism and
 $a_{1},a_{2}$
will remain zero. Even if
 $r>0$
, the transient period would strongly depend on the numerical noise. A transient starting with
 $r=10^{-50}$
needs much more time to rich the limit cycle than one starting with
 $r=10^{-10}$
although both are effectively at the origin. This is an unphysical feature. In an experiment, turbulent fluctuations excite vortex shedding again. These fluctuations represent a well-defined noise level with well-defined transient times. Hence, we introduce a noise term in the first two equations of (4.16),
 $$\begin{eqnarray}\displaystyle & \displaystyle \frac{\text{d}a_{1}}{\text{d}t}={\it\sigma}a_{1}-{\it\omega}a_{2}+{\it\kappa}{\it\xi}_{1}(t), & \displaystyle\end{eqnarray}$$
 $$\begin{eqnarray}\displaystyle & \displaystyle \frac{\text{d}a_{2}}{\text{d}t}={\it\sigma}a_{2}+{\it\omega}a_{1}+{\it\kappa}{\it\xi}_{2}(t). & \displaystyle\end{eqnarray}$$
 ${\it\xi}_{i}(t)$
represents white noise with vanishing mean and unit variance while
 ${\it\kappa}$
denote noise gain. For simplicity a single noise gain is assumed for both evolution equations. No noise term is added to the shift-mode equations, e.g. (4.16c
) and (4.16d
) or (4.25c
), as the corresponding amplitudes are driven by fluctuation levels and are much less sensitive to noise.
The need for a noise term was postulated already in the first POD model of Aubry et al. (Reference Aubry, Holmes, Lumley and Stone1988). Bourgeois et al. (Reference Bourgeois, Martinuzzi and Noack2013) have implemented a noise term in a least-order Galerkin model to feature slow wake modulations.
The evolution equation (4.26) augmented by the shift-mode equation (4.25c ) and parameters (4.25d ), (4.25e ) can be considered as a physics-based, deterministic stochastic, least-order model which describes the off–on–off transient of § 2.
4.5 Galerkin projection
Section 4.4 provides the description of a robust control-oriented low-order Galerkin model, in which each state and each term has a well-defined effect. In this section, we pursue an alternative path starting with the Galerkin expansion (3.23). A Galerkin projection of the Navier–Stokes equations onto the mentioned subspace yields a Galerkin system of the form (Graham et al. Reference Graham, Peraire and Tang1999; Luchtenburg et al. Reference Luchtenburg, Günther, Noack, King and Tadmor2009; Noack et al. Reference Noack, Morzyński and Tadmor2011),
 $$\begin{eqnarray}\displaystyle \frac{\text{d}a_{i}}{\text{d}t}={\it\nu}\mathop{\sum }_{j=-N_{A}}^{N}l_{ij}^{{\it\nu}}a_{j}+\mathop{\sum }_{j,k=-N_{A}}^{N}q_{ijk}^{c}a_{j}a_{k}+\mathop{\sum }_{j=-N_{A}}^{-1}m_{ij}\frac{\text{d}a_{j}}{\text{d}t}. & & \displaystyle\end{eqnarray}$$
Here, we follow again the elegant compact nomenclature of Rempfer & Fasel (Reference Rempfer and Fasel1994) in which the basic mode is included as zeroth mode with
 $a_{0}\equiv 1$
. In (4.27), each actuation mode gives rise to an additional acceleration term
 $m_{ij}\,\text{d}a_{j}/\text{d}t$
, with
 $m_{ij}=(\boldsymbol{u}_{i},\boldsymbol{u}_{j})_{{\it\Omega}}$
,
 $j=-N_{A},\ldots ,-1$
. The dissipation term is characterized by the inverse Reynolds number
 ${\it\nu}=1/Re$
and
 $l_{ij}^{{\it\nu}}=(\boldsymbol{u}_{i},{\rm\Delta}\boldsymbol{u}_{j})_{{\it\Omega}}$
, while the convective term is determined from
 $q_{ijk}^{c}=(\boldsymbol{u}_{i},\boldsymbol{{\rm\nabla}}\boldsymbol{\cdot }[\boldsymbol{u}_{j}\otimes \boldsymbol{u}_{k}])_{{\it\Omega}}$
. The pressure term vanishes for many closed flows and is negligible for open flows with large observation domains. For smaller domains, the inclusion of the pressure term in the Galerkin method just modifies the coefficients of (4.27) (Noack et al.
Reference Noack, Papas and Monkewitz2005). In many cases, a calibrated linear term offers a good approximation of the Galerkin pressure term representation (Galletti et al.
Reference Galletti, Bruneau, Zannetti and Iollo2004).
The Galerkin system (4.27) allows us to track the influence of viscous and convective terms on the dynamics. The mean-field system of § 4.4 lumps both terms but distils the dynamic significance of each frequency component. By construction, the mean-field system lives on a manifold defined by the Reynolds equation. This gives rise to cubic terms which are not present in (4.27). Secondly, the mean-field system contains a noise term to account for high-frequency background turbulence. In principle, similar noise terms could be added to the Galerkin system. Equation (4.27) includes an actuation-induced acceleration term
 $m_{ij}\,\text{d}a_{j}/\text{d}t$
. This term vanishes for no or steady blowing. Periodic actuations lead to additional terms which may be lumped into the terms
 $q_{i0k}a_{k}$
,
 $k<0$
. Drastic changes like sudden blowing or reversal thereof are ignored by mean-field considerations. This will be reflected in the hierarchy of Galerkin models introduced in § 5.
5 Results
In this section we propose and investigate a hierarchy of Galerkin models incorporating lifting methods of § 3 and the mean-field considerations of § 4. This hierarchy comprises six models of increasing resolution ranging from a linear two-dimensional system to a nonlinear system with four degrees of freedom (§ 5.1). Sections 5.2–5.7 present the corresponding results.
5.1 Hierarchy of models
We compose a hierarchy of Galerkin models with increasing dynamic resolution. This hierarchy rests on the options of § 3 from a single actuation mode for steady blowing (expansion A) to three actuations modes resolving individually the steady and the high-frequency component of forcing (expansion C). The subsequent dynamical systems may range from a linear–quadratic model simplified by frequency considerations to the full linear–quadratic model obtained directly from Galerkin projection. These models may be enriched by a stabilizing cubic term featuring unresolved mean-field variations and destabilising noise term representing the high-frequency background turbulence. The considered spectrum of six control-oriented models ranges from a simple oscillator model to fully nonlinear four-state model with cubic and noise terms.
Galerkin model I. This minimal flow representation incorporates just the vortex shedding
 $N=2$
and one actuation mode
 $N_{A}=1$
. Frequency filtering (§ 4.1.2) yields an oscillator with actuation (
 $a_{-1}$
) dependent growth rate
 ${\it\sigma}$
and frequency
 ${\it\omega}$
:
 $$\begin{eqnarray}\displaystyle & \displaystyle \frac{\text{d}a_{1}}{\text{d}t}={\it\sigma}a_{1}-{\it\omega}a_{2}, & \displaystyle\end{eqnarray}$$
 $$\begin{eqnarray}\displaystyle & \displaystyle \frac{\text{d}a_{2}}{\text{d}t}={\it\sigma}a_{2}+{\it\omega}a_{1}, & \displaystyle\end{eqnarray}$$
 $$\begin{eqnarray}\displaystyle & \displaystyle {\it\sigma}={\it\sigma}_{1}-{\it\beta}_{-1}a_{-1}, & \displaystyle\end{eqnarray}$$
 $$\begin{eqnarray}\displaystyle & \displaystyle {\it\omega}={\it\omega}_{1}+{\it\gamma}_{-1}a_{-1}. & \displaystyle\end{eqnarray}$$
 $a_{3}=a_{4}=0$
. Evidently, equation (5.1) can describe a neutrally stable oscillation with
 ${\it\sigma}_{1}=0$
and suppression of vortex shedding with blowing
 $a_{-1}>0$
assuming
 ${\it\beta}_{-1}>0$
. The system fails to feature a globally stable limit cycle and the resurrection of vortex shedding after complete stabilization
 $a_{1}=a_{2}=0$
.
Galerkin model II. Following the reasoning of § 4.3, we add a stabilising cubic term to Galerkin system I, obtaining a Landau oscillator with globally stable limit cycle:
 $$\begin{eqnarray}\displaystyle & \displaystyle \frac{\text{d}a_{1}}{\text{d}t}={\it\sigma}a_{1}-{\it\omega}a_{2}, & \displaystyle\end{eqnarray}$$
 $$\begin{eqnarray}\displaystyle & \displaystyle \frac{\text{d}a_{2}}{\text{d}t}={\it\sigma}a_{2}+{\it\omega}a_{1}, & \displaystyle\end{eqnarray}$$
 $$\begin{eqnarray}\displaystyle & \displaystyle {\it\sigma}={\it\sigma}_{1}-{\it\beta}_{-1}a_{-1}-{\it\beta}_{r}r^{2}, & \displaystyle\end{eqnarray}$$
 $$\begin{eqnarray}\displaystyle & \displaystyle {\it\omega}={\it\omega}_{1}+{\it\gamma}_{-1}a_{-1}+{\it\gamma}_{r}r^{2}, & \displaystyle\end{eqnarray}$$
 $r=\sqrt{a_{1}^{2}+a_{2}^{2}}$
is the oscillation amplitude. The resulting system is a special case of (4.25) with
 $a_{4}\equiv 0$
, and does not describe the onset of vortex shedding after complete stabilization
 $a_{1}=a_{2}=0$
.
Galerkin model III. Following § 4.4, we add a noise term to Galerkin system II, obtaining a noisy Landau oscillator with globally stable limit cycle:
 $$\begin{eqnarray}\displaystyle & \displaystyle \frac{\text{d}a_{1}}{\text{d}t}={\it\sigma}a_{1}-{\it\omega}a_{2}+{\it\kappa}{\it\xi}_{1}(t), & \displaystyle\end{eqnarray}$$
 $$\begin{eqnarray}\displaystyle & \displaystyle \frac{\text{d}a_{2}}{\text{d}t}={\it\sigma}a_{2}+{\it\omega}a_{1}+{\it\kappa}{\it\xi}_{2}(t), & \displaystyle\end{eqnarray}$$
 $$\begin{eqnarray}\displaystyle & \displaystyle {\it\sigma}={\it\sigma}_{1}-{\it\beta}_{-1}a_{-1}-{\it\beta}_{r}r^{2}, & \displaystyle\end{eqnarray}$$
 $$\begin{eqnarray}\displaystyle & \displaystyle {\it\omega}={\it\omega}_{1}+{\it\gamma}_{-1}a_{-1}+{\it\gamma}_{r}r^{2}. & \displaystyle\end{eqnarray}$$
Galerkin model IV. Next, the POD expansion is increased from
 $N=2$
to
 $N=4$
, thus incorporating two POD modes which act as shift modes. Modes
 $i=3,4$
resolve the base-flow variation during off–on–off transients. The resulting Galerkin system corresponds to (4.25) with added noise (§ 4.4) and added acceleration term (§ 4.5):
 $$\begin{eqnarray}\displaystyle & \displaystyle \frac{\text{d}a_{1}}{\text{d}t}={\it\sigma}a_{1}-{\it\omega}a_{2}+{\it\kappa}{\it\xi}_{1}(t), & \displaystyle\end{eqnarray}$$
 $$\begin{eqnarray}\displaystyle & \displaystyle \frac{\text{d}a_{2}}{\text{d}t}={\it\sigma}a_{2}+{\it\omega}a_{1}+{\it\kappa}{\it\xi}_{2}(t), & \displaystyle\end{eqnarray}$$
 $$\begin{eqnarray}\displaystyle & \displaystyle \frac{\text{d}a_{3}}{\text{d}t}=l_{33}a_{3}+l_{34}a_{4}+l_{3,-1}a_{-1}+{\it\alpha}_{3r}r^{2}+m_{3,-1}\frac{\text{d}a_{-1}}{\text{d}t}, & \displaystyle\end{eqnarray}$$
 $$\begin{eqnarray}\displaystyle & \displaystyle \frac{\text{d}a_{4}}{\text{d}t}=l_{43}a_{3}+l_{44}a_{4}+l_{4,-1}a_{-1}+{\it\alpha}_{4r}r^{2}+m_{4,-1}\frac{\text{d}a_{-1}}{\text{d}t}, & \displaystyle\end{eqnarray}$$
 $$\begin{eqnarray}\displaystyle & \displaystyle {\it\sigma}={\it\sigma}_{1}-{\it\beta}_{-1}a_{-1}-{\it\beta}_{3}a_{3}-{\it\beta}_{4}a_{4}-{\it\beta}_{r}r^{2}, & \displaystyle\end{eqnarray}$$
 $$\begin{eqnarray}\displaystyle & \displaystyle {\it\omega}={\it\omega}_{1}+{\it\gamma}_{-1}a_{-1}+{\it\gamma}_{3}a_{3}+{\it\gamma}_{4}a_{4}+{\it\gamma}_{r}r^{2}. & \displaystyle\end{eqnarray}$$
Galerkin model V. Hitherto, the actuation frequency component has been neglected. This component is incorporated by increasing the number of actuation modes from
 $N_{A}=1$
to
 $N_{A}=3$
. This adds new actuation commands and new terms in Galerkin system IV. The resulting dynamics corresponds to (4.16) with added noise and acceleration term
 $$\begin{eqnarray}\displaystyle & \displaystyle \frac{\text{d}a_{1}}{\text{d}t}={\it\sigma}a_{1}-{\it\omega}a_{2}+{\it\kappa}{\it\xi}_{1}(t), & \displaystyle\end{eqnarray}$$
 $$\begin{eqnarray}\displaystyle & \displaystyle \frac{\text{d}a_{2}}{\text{d}t}={\it\sigma}a_{2}+{\it\omega}a_{1}+{\it\kappa}{\it\xi}_{2}(t), & \displaystyle\end{eqnarray}$$
 $$\begin{eqnarray}\displaystyle & \displaystyle \frac{\text{d}a_{3}}{\text{d}t}=l_{33}a_{3}+l_{34}a_{4}+l_{3,-1}a_{-1}+{\it\alpha}_{3r}r^{2}+{\it\alpha}_{3s}s^{2}+m_{3,-1}\frac{\text{d}a_{-1}}{\text{d}t}, & \displaystyle\end{eqnarray}$$
 $$\begin{eqnarray}\displaystyle & \displaystyle \frac{\text{d}a_{4}}{\text{d}t}=l_{43}a_{3}+l_{44}a_{4}+l_{4,-1}a_{-1}+{\it\alpha}_{4r}r^{2}+{\it\alpha}_{4s}s^{2}+m_{4,-1}\frac{\text{d}a_{-1}}{\text{d}t}, & \displaystyle\end{eqnarray}$$
 $$\begin{eqnarray}\displaystyle & \displaystyle {\it\sigma}={\it\sigma}_{1}-{\it\beta}_{-1}a_{-1}-{\it\beta}_{3}a_{3}-{\it\beta}_{4}a_{4}-{\it\beta}_{r}r^{2}-{\it\beta}_{s}s^{2}, & \displaystyle\end{eqnarray}$$
 $$\begin{eqnarray}\displaystyle & \displaystyle {\it\omega}={\it\omega}_{1}+{\it\gamma}_{-1}a_{-1}+{\it\gamma}_{3}a_{3}+{\it\gamma}_{4}a_{4}+{\it\gamma}_{r}r^{2}+{\it\gamma}_{s}s^{2}. & \displaystyle\end{eqnarray}$$
 $s>0$
may change the shift-mode amplitudes and the stability of the oscillator via the
 $-{\it\beta}_{s}s^{2}$
term in (5.5e
).
Galerkin model VI. In the final generalisation, we allow for all constant, linear and quadratic terms of the Galerkin system (4.27), also those which have been ruled out by mean-field considerations:
 $$\begin{eqnarray}\displaystyle & \displaystyle \frac{\text{d}a_{1}}{\text{d}t}=\mathop{\sum }_{j,k=-3}^{4}q_{1jk}a_{j}a_{k}-{\it\beta}_{r}r^{2}a_{1}+{\it\kappa}{\it\xi}_{1}(t), & \displaystyle\end{eqnarray}$$
 $$\begin{eqnarray}\displaystyle & \displaystyle \frac{\text{d}a_{2}}{\text{d}t}=\mathop{\sum }_{j,k=-3}^{4}q_{2jk}a_{j}a_{k}-{\it\beta}_{r}r^{2}a_{2}+{\it\kappa}{\it\xi}_{2}(t), & \displaystyle\end{eqnarray}$$
 $$\begin{eqnarray}\displaystyle & \displaystyle \frac{\text{d}a_{3}}{\text{d}t}=\mathop{\sum }_{j,k=-3}^{4}q_{3jk}a_{j}a_{k}+m_{3,-1}\frac{\text{d}a_{-1}}{\text{d}t}, & \displaystyle\end{eqnarray}$$
 $$\begin{eqnarray}\displaystyle & \displaystyle \frac{\text{d}a_{4}}{\text{d}t}=\mathop{\sum }_{j,k=-3}^{4}q_{4jk}a_{j}a_{k}+m_{4,-1}\frac{\text{d}a_{-1}}{\text{d}t}. & \displaystyle\end{eqnarray}$$
 $q_{ijk}$
lumps the viscous and convective term of (4.27) into constant (
 $q_{i00}$
), linear (
 $q_{i0j}$
,
 $q_{ij0}$
,
 $j\not =0$
) and quadratic terms (
 $q_{ijk}$
,
 $j\not =0$
,
 $k\not =0$
) remembering
 $a_{0}\equiv 1$
. Evidently, equation (5.6) can describe a much richer dynamics than imposed by mean-field considerations. In principle, even a forced chaotic dynamics would be possible.
Comparison between the first two POD mode amplitudes (solid black curve) and those of the reduced-order model (dashed red curve) from GM I (5.1).

The proposed hierarchy of Galerkin models become increasingly general, incorporating qualitatively new behaviour. GM I is a subset of GM II, GM II a subset of GM III etc. Or, symbolically,
 $$\begin{eqnarray}\displaystyle \text{GM I}\subset \text{GM II}\subset \text{GM III}\subset \text{GM IV}\subset \text{GM V}\subset \text{GM VI}. & & \displaystyle\end{eqnarray}$$
Many other hierarchies starting with GM I and arriving at GM VI are possible, e.g. the noise term may be added in the last step. The proposed hierarchy gives emphasis to the most relevant features in the most simple models.
The coefficients of these Galerkin systems are determined with the 4D-Var method described in appendix A. This method identifies the best model behaviour as permissible by the structure and as quantified by the cost function. Alternatively the model may be derived by a Galerkin projection using the Navier–Stokes equation. The alternative approach would require us to neglect many terms not consistent with the mean-field model, a calibration of the cubic and noise term and would need to be augmented by a subscale turbulence term (Östh et al. Reference Östh, Noack, Krajnović, Barros and Borée2014).
5.2 Galerkin model I
The dynamics of the actuation off–on–off transient is illustrated in figure 9. The first two POD mode amplitudes of the simulation are depicted as solid black curve, the analogue quantities of the model (5.1) are marked as dashed red curve. The temporal behaviour of the POD mode amplitudes is consistent with the spatial mode structures shown in figure 8. During the unactuated phase, the POD mode coefficients
 $a_{1}$
and
 $a_{2}$
oscillate at the natural shedding frequency
 ${\it\omega}^{u}=0.919$
. When actuation is turned on, these natural oscillations are suppressed. The simulation shows small fluctuations at the actuation frequency
 ${\it\omega}^{a}=1.96$
.
The basic Galerkin model I performs as expected. The natural vortex shedding is well represented until the actuation is turned on. The dynamical system has no mechanism to revert to the unforced limit-cycle dynamics.
5.3 Galerkin model II
The cubic term of (5.2) features a robust limit-cycle dynamics. In GM I, the initial growth rate
 ${\it\sigma}_{1}$
was approximately zero, while the analogue value of GM II is
 $2.116$
. Figure 10 shows the model dynamics. The ‘resurrection’ of vortex shedding in the on–off transient was unexpected. The 4D-Var method underpredicts the damping
 ${\it\sigma}$
to allow for a residual fluctuation when actuation is turned on. The price for the poorer performance during the actuation phase is over-compensated by resolving the limit-cycle dynamics in the final unforced state. This unexpected behaviour can be considered as over-fitting, as the growth rate calibration anticipates the length of actuation phase, a transient-dependent control decision which should not be incorporated in the model parameters. A significantly increased actuation period, for instance, would have lead to expected irreversible decay of vortex shedding.


5.4 Galerkin model III
The behaviour of GM III is displayed in figure 11. The off–on transient time for suppression of vortex shedding by forcing is much closer to the simulation reference data than the analogue data of GM II. Now, the noise term allows the onset of vortex shedding after suppression. The rise of fluctuations before actuation is turned off may be considered as an indication of over-fitting of the model parameter for this particular transient.
5.5 Galerkin model IV
The performance of GM IV is illustrated in figure 12. The oscillatory dynamics of
 $a_{1}$
and
 $a_{2}$
of GM III and GM IV have comparable accuracy. A new feature is the surprisingly accurate tracking of the shift-mode amplitudes
 $a_{3}$
and
 $a_{4}$
. The actuation mode
 $a_{-1}$
(blowing) changes sharply while the base flow needs time to adjust. The shift-mode amplitudes
 $a_{3}$
and
 $a_{4}$
parameterize the near-field and far-field relaxation. The terms
 $m_{i,-1}\,\text{d}a_{-1}/\text{d}t$
,
 $i=3,4$
provide delta impulses in (5.4c
) and (5.4d
) allowing the tracking of the large initial gradients of the simulation-based amplitudes. Both shift mode amplitudes relax to zero after this impulse.
 $a_{3}$
resolves the near-field change and is mainly active during the on–off transient. The positive and negative delta-impulse is briefly visible only in the model, not in the simulation reference. Apart from these instances, the tracking accuracy can be considered good.
 $a_{4}$
resolves the far-field transients and has opposite signs during off–on and on–off transient.

5.6 Galerkin model V
Figure 13 shows the performance of GM V with high-frequency actuation modes
 $i=-2,-3$
added. GM IV and V are comparable indicating that the (small) high-frequency modulation is a second-order effect on the vortex shedding. Yet, the flow response can be felt in the lift coefficients (see § 6).

5.7 Galerkin model VI
Figure 14 depicts the behaviour of GM VI with many additional constant, linear and quadratic terms. GM IV, V and VI track the reference simulations similarly well. There is not a single feature which is improved. Even the overshoot of the oscillation amplitude during the on–off transient is not resolved by the last three Galerkin models. This comparison corroborates that Galerkin model IV incorporates the natural dynamics and main actuation mechanisms. Adding the high-frequency actuation component or adding many more terms does not visibly improve the model performance. In retrospect, this hierarchy of Galerkin models justify the mean-field assumptions for the derivation of sparse propagators with a small number of terms. An alternative data-driven approach for sparse dynamic representations has recently been proposed by Brunton, Proctor & Kutz (Reference Brunton, Proctor and Kutz2016).

6 Discussion
The model predictions can be related to any aerodynamic quantity. Since one of the main objectives of the project is to implement flow control to increase the lift gain factor, it is natural to evaluate the models’ ability in predicting the lift coefficient
 $C_{l}$
. This coefficient will be inferred from the reduced-order model by assuming that it is function of the actuation and the POD mode amplitudes i.e.
 $C_{l}=C_{l}(a_{-3},\ldots ,a_{4})$
(see Bergmann & Cordier Reference Bergmann and Cordier2008; Luchtenburg et al.
Reference Luchtenburg, Günther, Noack, King and Tadmor2009). We assume that the lift coefficient is a polynomial expression, where (i) the steady and unsteady actuation inputs are modelled by a linear combination of
 $a_{-3}$
,
 $a_{-2}$
and
 $a_{-1}$
, (ii) the oscillatory behaviour of the lift coefficient is modelled by a linear combination of
 $a_{1}$
,
 $a_{2}$
,
 $a_{3}$
and
 $a_{4}$
, (iii) the influence of the mean-field deformation during transients is taken into account by a Taylor series of second order in
 $r^{2}$
and
 $s^{2}$
. Thus, the lift coefficient equation is assumed to be of the following form:
 $$\begin{eqnarray}\displaystyle C_{l}(t)=C_{l0}+\mathop{\sum }_{i=-N_{A}}^{-1}k_{i}a_{i}(t)+\mathop{\sum }_{i=1}^{N}k_{i}a_{i}(t)+k_{5}r^{2}+k_{6}s^{2}+k_{7}r^{4}+k_{8}s^{4}, & & \displaystyle\end{eqnarray}$$
where
 $C_{l0}$
is a constant. The values of
 $N_{A}$
and
 $N$
are dependent of the model that is considered. The first part of (6.1) up to the quadratic terms follows directly from the Galerkin expansion (4.27) and the Navier–Stokes equations. The two remaining fourth-order terms are conjectured to account for unmodelled mode deformations. The parameters
 $k_{-3},\ldots ,k_{8}$
were determined from a least-squares fit from the training data with the two transients. Their values are presented in table 2 for Galerkin model V.
Figure 15 compares the reference URANS lift coefficient (black) with the reconstructed lift coefficient (red) based on the six Galerkin models presented in §§ 5.2–5.7. The accuracy of the predicted lift coefficients mirror the previous behaviour, where a gradual improvement from Galerkin model I to Galerkin model V and VI is observed. However, since
 $C_{l}$
is function of all actuation and POD modes, a more global picture of the models’ performance now emerges. Most noteworthy are the resolutions of the second transient and of the high-frequency forcing. It is now much clearer how the addition of mode 3 and 4 (starting with model IV) acts as a necessary enabler to resolve the transient dynamics, especially the on–off transient. The benefits of including higher-order actuation terms can also be observed, where only Galerkin model V and VI were capable of capturing the high-frequency forcing.
The reference URANS lift coefficient (black) compared with the reconstructed lift coefficient (red) based on the six presented Galerkin models.

Identified parameters of the lift coefficient equation (6.1) for Galerkin model
 $V$
.

Robustness is a critical criterion for reduced-order models. Two additional numerical simulations (on–off–on) with different forcing conditions were therefore conducted. The different forcing conditions were accomplished through variations in the lip nominal position and amplitude, which translate into variations in the mean blowing intensity
 $C_{{\it\mu}0}$
and the blowing amplitudes
 $C_{{\it\mu}1}$
(§ 2.1). The first validation case was performed with
 $C_{{\it\mu}0}=0.027$
and
 $C_{{\it\mu}1}=0.023$
, whereas the second case with
 $C_{{\it\mu}0}=0.032$
and
 $C_{{\it\mu}1}=0.026$
. Both simulations were performed with the same lip actuation frequency of
 ${\it\omega}^{a}=1.96$
. All flow conditions (angle of attack, Reynolds number, Mach number) were kept similar to those of the training dataset.
Figure 16 compares the reference URANS lift coefficient (black) with the reconstructed lift coefficient (red) based on Galerkin model V. The first validation case is shown in (a), and the second case in (b). As can be seen, the agreement between the reference and the reconstructed lift coefficient is favourable. The actuated state, the unactuated state, as well as the transients between them are well captured.
The reference URANS lift coefficient (black) compared with the reconstructed lift coefficient (red) based on Galerkin model
 $V$
: (a) is validation case 1; (b) is validation case 2.

7 Conclusions
The study focuses on transient and post-transient flow around an actuated high-lift configuration. The actuation is an unsteady Coanda blowing over the flap which mitigates von Kármán vortex shedding and increases lift by 80 %. We assess a range of POD-based reduced-order models resolving unactuated and actuated states as well as off–on and on–off transients. The departure point is a POD model with a single actuation mode following Graham et al. (Reference Graham, Peraire and Tang1999) and Weller et al. (Reference Weller, Lombardi and Iollo2009). This actuation mode resolves the Coanda blowing with strong steady and small oscillatory component. In this study, we propose a generalized actuation mode concept as a key enabler for an accurate least-order model. We also offer model improvements through a stabilizing cubic term representing the mean-field variations and a noise term modelling the high-frequency background turbulence.
The structure of the dynamical Galerkin system is inferred from mean-field considerations, while the model parameters are identified with a 4D-Var method. Typical issues associated with subgrid turbulence and pressure term representation are bypassed, since these terms are optimally incorporated in the resulting Galerkin system. Targeting a least-order model, a range of possible dynamical systems with increasing dynamical resolution ranging from a linear–quadratic to the full linear–quadratic model was investigated. Only the first four POD modes are retained. The first two modes represent von Kármán vortex shedding, whereas the third and fourth modes describe transient base-flow changes under change of actuation. The third mode is concentrated in the near field while the fourth mode resolves the far-wake changes.
The simplest model in our hierarchy (GM I) is nothing but a simple oscillator with an actuation term. It describes the vortex shedding and the first off–on transient. Expectedly, it fails to resurrect the vortex shedding after complete stabilization following actuation. The addition of a cubic term (GM II) offers a substitute to the missing shift mode and consequently a globally stable limit cycle. The first ability of the Landau oscillator to solve the off–on–off transient is with the introduction of the noise term (GM III), which simulates the turbulent fluctuations present in a real flow. Improved modelling of the transient dynamics and the ability for variable growth rate and variable oscillation frequency are introduced with the addition of mode 3 and 4 (GM IV). The resolution of the forced high-frequency component is enabled with the inclusion of higher-order actuation terms,
 $a_{-2}$
and
 $a_{-3}$
(GM V). Including all constant, linear and quadratic terms of Galerkin model (GM VI) does not improve its performance.
Table 3 provides an overview of the model hierarchy and the features added by a higher-order representation. The table also includes the number of coefficients computed by the 4D-Var method. We emphasize that the number of coefficients for the first 5 models is quite modest, ranging from
 $4$
to
 $23$
. Each of these coefficients characterizes a well-defined feature exhibited by the numerical simulation. The numerical values of these coefficients hardly changes in higher-order models with new features. Hence, the danger of over-fitting is mitigated by the low number of tuneable coefficients, by the simple analytical structure of the model, and by the numerical observation of consistent calibration results. Only the highest-order GM VI has a substantial number of
 $148$
coefficients making it prone to overfitting. Yet, the additional coefficients almost vanish and do not give rise to any noticeable change in the behaviour.
Hierarchy of Galerkin models. The table lists the number of the model, the equation, the number of parameters and the added features with respect to the previous model. For instance, GM III has also the features of GM I and GM II.

The models with a single actuation mode reproduce the transient and post-transient flow dynamics, yet the speed of the transients and the amplitude of the base flow changes are quantitatively under-predicted. The accuracy of the Galerkin model is significantly increased by transferring the frequency-filtering approach for expansions modes (Noack et al. Reference Noack, Schlegel, Morzyński and Tadmor2010) to the actuation modes. This yields an actuation command with steady and oscillatory components giving rise to a steady and a different oscillatory flow response. Hence, this response is resolved with three actuation modes, one for the DC component, and two for the oscillatory one. In hindsight, one cannot expect a single actuation mode to represent steady blowing and high-frequency fluctuations. The Galerkin expansion comprising the unactuated mean flow, all four expansion modes, the cubic term and the noise term (model V) constitutes a robust flow estimation which is optimally correlated with actuation and is capable of modelling fast transients.
To the best of our knowledge, the present study is the first to present a lifting method of POD models that captures the actuation response of different frequencies from a single actuator. We conjecture that this frequency separation is a good practice for reduced-order modelling of other shear flows. The hierarchy of investigated models with the multitude of possible combinations (with or without a noise term, with or without a cubic term, with or without a shift modes) can be envisaged as building blocks to model a wide range of possible flows. The success of the generalized mean-field model underlines the large importance of equivalent linear parameter varying models for control design. A linear model which reacts to base-flow changes is often found to be an adequate plant for control design (Brunton & Noack Reference Brunton and Noack2015). Future efforts involve a control design for a companion experiment at the Collaborative Research Centre (CRC 880), ‘Fundamentals of High Lift of Future Civil Aircraft’ at the Technical University of Braunschweig. A key challenge is to implement closed-loop flow control that further increases the lift gain factor towards a viable STOL aircraft.
Acknowledgements
We acknowledge the funding and excellent working conditions of our respective German and French institutions: (1) the Collaborative Research Centre (CRC 880) ‘Fundamentals of High Lift of Future Civil Aircraft’ supported by the Deutsche Forschungsgemeinschaft (DFG) and hosted at the Technical University of Braunschweig, (2) the Senior Chair of Excellence ‘Closed-loop control of turbulent shear flows using reduced-order models’ (TUCOROM) supported by the French Agence Nationale de la Recherche (ANR) and hosted by Institute PPRIME, and (3) the ONERA/Carnot INTACOO project for supplementary funding. We also acknowledge the support of Rolf Radespiel and illuminating discussions with Steven Brunton, Herrmann Matthies and Marek Morzyński. We thank the Ambrosys Ltd. Society for Complex Systems Management, the Bernd Noack Cybernetics Foundation for additional support.
Appendix A. Model identification with 4D-Var
In § 4, reduced-order models based on mean-field considerations and Galerkin projection of the Navier–Stokes equations onto the Galerkin expansion have been presented. For the traditional Galerkin approach, the system coefficients can be in principle determined directly from the Navier–Stokes equations. A subscale turbulence model that accounts for the unresolved fluctuations is generally required. In this study, a different path is pursued and the coefficients of the different models are determined from the flow data. Following Cordier et al. (Reference Cordier, Noack, Daviller, Delvile, Lehnasch, Tissot, Balajewicz and Niven2013), a 4D-variational data assimilation (4D-Var) methodology is used as a parameter identification technique. 4D-Var is a method widely used in meteorology (Navon Reference Navon, Park and Xu2009; Artana et al. Reference Artana, Cammilleri, Carlier and Mémin2012) to combine different sources of inhomogeneous information: a simplified model, noisy and sparse observations and an a priori knowledge of the solution. The resulting parameter identification problem is formulated as an optimisation problem, which includes the initial conditions of the mode amplitudes and the Galerkin system coefficients.
In all considered cases, the Galerkin system is written in the following general form:
 $$\begin{eqnarray}\displaystyle \left.\begin{array}{@{}l@{}}\displaystyle \frac{\text{d}\boldsymbol{a}}{\text{d}t}=\boldsymbol{f}(\boldsymbol{a},\boldsymbol{c}),\\ \displaystyle \boldsymbol{a}(0)=\boldsymbol{a}^{\bullet }(0)+\boldsymbol{{\it\eta}},\end{array}\right\} & & \displaystyle\end{eqnarray}$$
where
 $\boldsymbol{c}$
contains all model coefficients,
 $\boldsymbol{a}^{\bullet }$
denotes the POD reference value and
 $\boldsymbol{{\it\eta}}$
is a perturbation of the initial conditions employed to improve the identification process.
The 4D-Var method seeks
 $(\boldsymbol{{\it\eta}},\boldsymbol{c})$
that minimizes the cost functional
 $$\begin{eqnarray}\displaystyle \mathscr{J}^{4D\text{-}Var}(\boldsymbol{{\it\eta}},\boldsymbol{c},\boldsymbol{a})=\frac{1}{2}\int _{0}^{T_{o}}\Vert \mathbb{H}(\boldsymbol{a})-\mathbf{\mathscr{Y}}\Vert _{\unicode[STIX]{x1D64D}^{-1}}^{2}\,\text{d}t+\frac{1}{2}\Vert \boldsymbol{{\it\eta}}\Vert _{\unicode[STIX]{x1D63D}^{-1}}^{2}+\frac{1}{2}\Vert \boldsymbol{c}-\boldsymbol{c}^{Bg}\Vert _{\unicode[STIX]{x1D63E}^{-1}}^{2}, & & \displaystyle\end{eqnarray}$$
where
 $\mathbf{\mathscr{Y}}$
are observations and
 $T_{o}$
is the time horizon of optimization. The nonlinear operator
 $\mathbb{H}$
, called the observation operator allows the passage from the state space to the observation space.
 $\unicode[STIX]{x1D64D}$
,
 $\unicode[STIX]{x1D63D}$
and
 $\unicode[STIX]{x1D63E}$
are covariance tensors associated with the observation, the initial conditions and the model coefficients, respectively. The norms
 $\Vert \cdot \Vert _{\unicode[STIX]{x1D64D}^{-1}}$
,
 $\Vert \cdot \Vert _{\unicode[STIX]{x1D63D}^{-1}}$
,
 $\Vert \cdot \Vert _{\unicode[STIX]{x1D63E}^{-1}}$
, are induced respectively by the inner products associated with the weight matrices
 $\unicode[STIX]{x1D64D}^{-1}$
,
 $\unicode[STIX]{x1D63D}^{-1}$
and
 $\unicode[STIX]{x1D63E}^{-1}$
. For instance, the inner product associated with the state perturbations of
 $\boldsymbol{{\it\eta}}$
,
 $\boldsymbol{{\it\eta}}^{\prime }$
is given by
 $$\begin{eqnarray}\displaystyle (\boldsymbol{{\it\eta}},\boldsymbol{{\it\eta}}^{\prime })_{\unicode[STIX]{x1D63D}^{-1}}=(\boldsymbol{{\it\eta}},\unicode[STIX]{x1D63D}^{-1}\boldsymbol{{\it\eta}}^{\prime })_{2}=\boldsymbol{{\it\eta}}^{\text{T}}\unicode[STIX]{x1D63D}^{-1}\boldsymbol{{\it\eta}}^{\prime }. & & \displaystyle\end{eqnarray}$$
The other inner products are defined analogously. The role of these norms is to give more or less confidence in each source of information. The background coefficients
 $\boldsymbol{c}^{Bg}$
represent a priori knowledge of the model coefficients which can be provided by Galerkin projection, by a previous identification, or by another knowledge of the system. Here, the background coefficients
 $\boldsymbol{c}^{Bg}$
are determined by phenomenological considerations, such that the original dynamics is roughly reproduced. As background model, we consider a simplified version of (5.4) i.e.
 $$\begin{eqnarray}\displaystyle \left.\begin{array}{@{}l@{}}\displaystyle \frac{\text{d}a_{1}}{\text{d}t}={\it\sigma}^{Bg}a_{1}-{\it\omega}^{Bg}a_{2}+{\it\kappa}^{Bg}{\it\xi}_{1}(t),\\ \displaystyle \frac{\text{d}a_{2}}{\text{d}t}={\it\sigma}^{Bg}a_{2}+{\it\omega}^{Bg}a_{1}+{\it\kappa}^{Bg}{\it\xi}_{1}(t),\\ \displaystyle \frac{\text{d}a_{3}}{\text{d}t}=l_{33}^{Bg}a_{3}+l_{34}^{Bg}a_{4}+q_{344}^{Bg}a_{4}^{2},\\ \displaystyle \frac{\text{d}a_{4}}{\text{d}t}=l_{44}^{Bg}a_{4}+m_{4,-1}^{Bg}\frac{\text{d}a_{-1}}{\text{d}t},\\ \displaystyle {\it\sigma}^{Bg}={\it\sigma}_{1}^{Bg}-{\it\beta}_{r}^{Bg}r^{2}-{\it\beta}_{-1}^{Bg}a_{-1},\end{array}\right\} & & \displaystyle\end{eqnarray}$$
where the parameters are given in table 4. For all the other parameters appearing in the Galerkin models of § 5 and not belonging to (A 4), their background values are zero. In addition, all terms appearing in the background model (A 4) and not considered in the hierarchy of Galerkin models presented in § 5, are simply ignored.
Background parameters of model (A 4).

Considering full knowledge of the dynamics, a natural starting point for model identification is based on full-state observation where we have
 $$\begin{eqnarray}\displaystyle \mathbf{\mathscr{Y}}=(a_{1}^{\bullet },a_{2}^{\bullet },a_{3}^{\bullet },a_{4}^{\bullet })^{\text{T}}\quad \text{and}\quad \mathbb{H}(\boldsymbol{a})=(a_{1},a_{2},a_{3},a_{4})^{\text{T}}. & & \displaystyle\end{eqnarray}$$
We refrain from such a full-state observation, as this would imply a model identification with a tracking of the oscillation phase over
 $O(100)$
periods. Such a phase tracking is neither necessary for the reproduction of the dominant slow dynamics nor for closed-loop control in which a model prediction horizon of only few periods is required. Instead, the observations
 $\mathbf{\mathscr{Y}}$
are chosen to represent only the slowly varying dynamics. Modes
 $a_{1}$
and
 $a_{2}$
are identified to be fast oscillatory modes which can be parameterized by a radius
 $r=\sqrt{a_{1}^{2}+a_{2}^{2}}$
and an angle
 ${\it\theta}=\arctan (a_{1}/a_{2})$
, as in Protas, Noack & Morzyński (Reference Protas, Noack and Morzyński2014). In contrast to
 ${\it\theta}$
,
 $r$
is assumed to vary slowly in time. For the Galerkin models of § 5 where
 $a_{i}$
,
 $i=1,\ldots ,4$
, are considered i.e. for (5.4)–(5.6), we thus define as observations
 $$\begin{eqnarray}\displaystyle \mathbf{\mathscr{Y}}=((a_{1}^{\bullet })^{2}+(a_{2}^{\bullet })^{2},a_{3}^{\bullet },a_{4}^{\bullet })^{\text{T}}\quad \text{and}\quad \mathbb{H}(\boldsymbol{a})=((a_{1})^{2}+(a_{2})^{2},a_{3},a_{4})^{\text{T}} & & \displaystyle\end{eqnarray}$$
while for the Galerkin models with only
 $a_{1}$
and
 $a_{2}$
, i.e. for (5.1), (5.2) and (5.3), we define as observations
 $$\begin{eqnarray}\displaystyle \mathbf{\mathscr{Y}}=((a_{1}^{\bullet })^{2}+(a_{2}^{\bullet })^{2})^{\text{T}}\quad \text{and}\quad \mathbb{H}(\boldsymbol{a})=((a_{1})^{2}+(a_{2})^{2})^{\text{T}}. & & \displaystyle\end{eqnarray}$$
The covariance tensors are chosen as
 $\unicode[STIX]{x1D64D}^{-1}=\mathbb{I}$
,
 $\unicode[STIX]{x1D63D}^{-1}=\unicode[STIX]{x1D63E}^{-1}={\it\sigma}\mathbb{I}$
, where
 $\mathbb{I}$
is the identity matrix and
 ${\it\sigma}$
is a scalar value chosen a posteriori using the classical L-curve method (Hansen Reference Hansen1992; Cordier, Abou El Majd & Favier Reference Cordier, Abou El Majd and Favier2010). 4D-Var minimization of (A 2) is then solved iteratively using an adjoint method (Cordier et al.
Reference Cordier, Noack, Daviller, Delvile, Lehnasch, Tissot, Balajewicz and Niven2013).