I. INTRODUCTION
Since their discovery by Duwez and coworkers in 1960,Reference Klement, Willens and Duwez1 metallic glasses have attracted considerable research interest on both a fundamental scientific and an engineering level. Because of their unique materials propertiesReference Ashby and Greer2 and spurred along by the significant progress in alloy development over the last few decades,Reference Löffler3 metallic glasses have proved to be promising materials for both functional and structural applications,Reference Telford4 especially in bulk form. Owing to a complex, disordered atomic structure, however, the fundamental processes and mechanisms governing their properties remain in many cases poorly understood. This applies particularly to the field of mechanical properties, which has received broad attention in recent years.Reference Schuh, Hufnagel and Ramamurty5–Reference Pampillo and Chen7 While some early attempts at clarification focused on transferring concepts of dislocation theory developed for crystalline metals to disordered media,Reference Gilman8 it is now commonly understood that the nature and atomic-scale mechanisms of plastic flow in amorphous metals must be fundamentally different to their crystalline counterparts. Following from early work conducted by ArgonReference Argon9 as well as Spaepen et al.,Reference Spaepen and Turnbull10, Reference Spaepen11 a concept that has now gained increasing popularity is that of plasticity governed by shear-induced, local structural rearrangements of atomic clusters, so-called shear transformation zones (STZs).Reference Falk and Langer12 However, establishing experimental evidence for the validity of this atomic-scale flow model remains difficult, whereas, for example, at a much larger scale, analogous behavior of particle rearrangements can be captured in colloidal glasses.Reference Schall, Weitz and Spaepen13 For metallic glasses, additional experimental difficulties reside in a strong localization of plastic flow in both time and space, typically observed at low homologous temperatures at which shear banding prevails.Reference Spaepen11 Understanding the process of flow localization is hence crucial to unveiling the fundamental plastic flow mechanisms in metallic glasses.
Flow localization in shear bands is most generally found to be present in materials that show a nonmonotonic stress versus strain-rate relationship, allowing regions of different plastic strain rate to coexist at a common stress.Reference Spenley, Yuan and Cates14 In many systems, this is also accompanied or even induced by time- and strain-dependent processes, which may include softening resulting from structural disordering as a function of strain or thermal effects. This leads to a complex rheological net response where cause and consequence of localization is often not discernable.Reference Schall and van Hecke15 Shear bands may in fact be formed in a wide range of materials, and they have been studied most extensively in complex fluids.Reference Schall and van Hecke15, Reference Ovarlez, Rodts, Chateau and Coussot16 In the latter, the time and length scales involved permit detailed in-situ monitoring of the evolution of inhomogeneous velocity profiles during shear using a wide range of experimental techniques.Reference Manneville17 Consequently, the physical origin and mechanism of flow localization in complex fluids are much better understood. By contrast, capturing shear bands in-situ in metallic glasses during conventional mechanical testing has proved to be very difficult because of their low thickness (≈20 nmReference Masumoto and Maddin18) and apparent short life-time (<2–3 ms19). Most experimental attempts have involved various high-speed imaging techniques, which generally suffered from insufficient time and spatial resolution.Reference Neuhäuser19–Reference Song, Bei, Wadsworth and Nieh21 Because of these experimental restraints, fundamental questions as to the mechanism of shear banding in metallic glasses remain open and vividly debated. These include:
(i) How does a shear band nucleate and propagate across a sample and how do atomic-scale clusters transform at a microscopic level to yield permanent shear deformation at a macroscopic scale?Reference Schuh, Hufnagel and Ramamurty5, Reference Wright, Samale, Hufnagel, LeBlanc and Florando22
(ii) What are the time scales involved in shear-band operation and how can local strain rates be estimated?Reference Neuhäuser19, Reference Vinogradov23
(iii) Does significant adiabatic heating accompany shear banding, leading to autocatalytic softening within the band itself?Reference Lewandowski and Greer24
In this article, we will compile and extend recent progress made in addressing the above questions. We will show an alternative approach to direct imaging and describe how time-resolved characterization of serrated flow can be used to quantify the dynamics of shear-band propagation in metallic glasses. Focusing on temperature dependence, the insights thus gained can be used to establish a better understanding of shear banding and plastic deformation in metallic glasses.
We shall begin by briefly reviewing the fundamentals of serrated plastic flow in metallic glasses, drawing a phenomenological analogy to stick-slip processes, such as solid-state friction. We will proceed by detailing how the dynamics of individual slip instabilities can be captured experimentally and quantified with the aid of different models of shear-band propagation. The results thus obtained will be presented and discussed with respect to their implications for the fundamental mechanisms of strain localization and plastic flow in metallic glasses.
II. SERRATED FLOW AND STICK-SLIP ANALOGIES
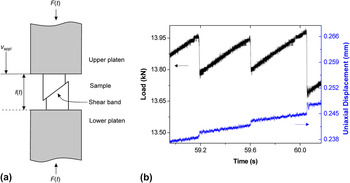
Despite the fact that similar deformation behavior can be observed under various loading geometries such as bending, tearing, or nanoindentation,Reference Wright, Saha and Nix25–Reference Kimura and Masumoto30 we will limit the following discussion to uniaxial compression testing of bulk samples as shown schematically in Fig. 1(a). A sample is positioned between two compression platens and a constant crosshead velocity v appl is applied, and load F(t) and, with the aid of strain gauges, sample length l(t) are continuously monitored. As first observed by Kimura and Masumoto,Reference Kimura and Masumoto31 once the yield stress is exceeded, typical load drops (serrations) coinciding with discrete displacement bursts can be detected. This is depicted in Fig. 1(b) for a Zr-based bulk metallic glass tested at room temperature and a strain rate of 10−3 s−1. The flow serrations are due to intermittency in shear-band propagation, that is, the crosshead velocity v appl used in the test is not fully transferred to the deforming band, which rather undergoes alternating cycles of negligible (v ≪ v appl) and rapid deformation rates (v ≫ v appl). As subtly indicated in recent work,Reference Cheng, Han, Li and Ma32–Reference Sun, Yu, Jiao, Bai, Zhao and Wang35 this behavior is a typical characteristic of a system undergoing stick-slip motion. It is remarked that for stick (v ≪ v appl) it should not necessarily be concluded that the band is fully at rest (v = 0), since some slow creep motion may still be expected. For serrated flow in metallic glasses, this slow motion is likely to be below the test resolution as the reloading segments appear to reflect a fully elastic response of the system.
(a) Typical compression setup: A sample is inserted between two compression platens and a constant crosshead velocity v appl is applied. Sample length l(t) and load F(t) are continuously monitored during the test. (b) Time-resolved load and displacement data showing discrete load serrations and displacement bursts. The test was conducted on Zr52.5Ti5Cu17.9Ni14.6Al10 (Vit105) at room temperature and a strain rate of 10−3 s−1.

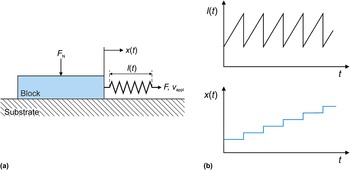
The principles of stick-slip are best understood by considering the well-studied example of solid-state friction (e.g., see Ref. Reference Persson36), typically monitored using a block-slider setup [see Fig. 2(a)]. In such a system, a block is positioned on a solid substrate with an optional normal load F N applied. The block is laterally connected to a drive system by an extension spring. During a test, a constant drive velocity v appl is applied and the position x(t) of the block and the extension of the spring l(t) (proportional to the load F applied) are recorded as a function of time t. The dynamics of the block may then be described by two distinct states: During stick, the block remains (approximately) stationary, while the spring extends at a constant rate set by v appl. Hence, the force applied to the system and the elastic energy stored within the spring increase over time. At a critical limit, the block begins to slide rapidly, while part of the stored elastic energy is consumed to propel its motion. This corresponds to the slip-stage. The spring partly relaxes elastically until the block arrests at some lower limit in force and a new period of stick is initiated. Thus, the process repeats iteratively.
(a) Schematic block-slider setup used to characterize solid-state friction (adapted from Ref. Reference Persson36). A solid block resting on a substrate is connected to a drive system via an extension spring. A constant velocity v appl is used, and block position x(t) and spring extension l(t) (proportional to the load F applied) are monitored during the test as a function of time t. (b) Typical curves of spring extension l(t) and block position x(t) as a function of time t. Stick cycles in which the block is at rest precede cycles of rapid slip in which the spring relaxes.

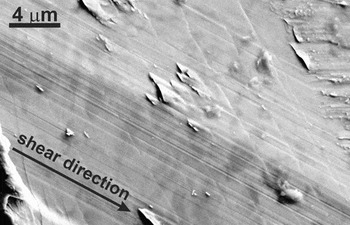
It is interesting to note that typical curves of spring extension (equivalent to the load applied) and block position, as displayed schematically in Fig. 2(b), show the same characteristic features (i.e., serrations and discrete jumps) as the load and displacement plots for the metallic glass [see Fig. 1(b) for comparison]. This is because analogous to the extension spring in the block-slider system, the compliant load frame of the compression machine in combination with the major fraction of the sample volume acts as a mediating component between the drive system and the deforming body, thus leading to intermittency by storing elastic energy during stick and releasing energy to the shear band to drive its propagation during rapid slip. Hence, a single serration in Fig. 1(b) can be taken to represent a full cycle of shear-band operation. This includes shear-band initiation at peak stress, its propagation at high velocity under decreasing load, and shear-band arrest at a lower limit in stress. Additional evidence for intermittency in shear-band propagation is found by inspecting the surfaces exposed during shear using electron microscopy. An example is given in Fig. 3. Characteristic striations, similar to those formed during incremental fatigue-crack propagation, are observed. Their spacing roughly corresponds to the distance by which the band propagates during each shear event.Reference Song, Bei, Wadsworth and Nieh21, Reference Han and Li37
Scanning electron microscopy image illustrating characteristic striations found on the glide surface exposed during shear. The spacing roughly corresponds to the glide distance during each cycle, demonstrating the intermittent nature of shear-band propagation.

Having identified stress drops to correspond to the stage of shear-band propagation, we are now interested in addressing the question of how fast these slip instabilities actually are. This can be done by performing time-resolved measurements of load serrations and strain bursts. In the next section, we shall outline the technical requirements for performing these experiments.
Before proceeding to the next part, however, it shall be pointed out that serrated flow during mechanical testing, independent of the testing geometry chosen, does not appear to be a universal characteristic of metallic glasses. Most metallic glasses actually fail catastrophically at their yield stress, even under uniaxial compressive conditions. Explaining the origin of “stable shear banding” is directly linked to understanding why some metallic glasses achieve some apparent ductility. Despite the extensive work done in this field, no convincing theory has been established yet. A wide range of possible influences and causes have been proposed and the reader is referred to Ref. Reference Chen6 for a detailed review of this topic and to Ref. Reference Han, Wu, Li, Wei and Gao38 for a more recent study investigating the possible effect of sample size and machine stiffness on shear-band stability.
III. TIME-RESOLVED COMPRESSION TESTING: EXPERIMENTAL CONSIDERATIONS
Preliminary work aimed at estimating the time scales of shear-band propagation by time-resolved compression testing was performed by Wright et al.Reference Wright, Schwarz and Nix39 using strain gauges directly attached to the sample. This study was later refined in Ref. Reference Wright, Samale, Hufnagel, LeBlanc and Florando22. Following from this work, other researchers adopted similar techniques.Reference Song and Nieh40–Reference Klaumünzer, Maass, Dalla Torre and Löffler43
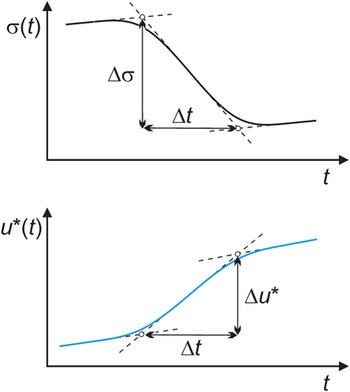
In performing time-resolved compression tests, care must be taken to achieve a sufficiently high resolution in the load and displacement signals recorded. This is primarily done by using high acquisition rates (>10 kHz) in combination with eliminating any filtering procedure, which could otherwise distort the signal. Additionally, using a piezoelectric load cell is vital to accurately detect dynamic changes in load. As stressed by Wright et al.Reference Wright, Samale, Hufnagel, LeBlanc and Florando22 and confirmed in Ref. Reference Dalla Torre, Klaumünzer, Maaß and Löffler33, these means are essential to record load and displacement correctly at submillisecond resolution. Following the above procedures allows for determining the duration Δt of stress drops and displacement bursts as well as their respective magnitudes Δσ and Δu*. These parameters are schematically represented in Fig. 4 along with the linear fitting procedure applied.
Schematic showing the linear fitting procedure applied to time-resolved stress drops (upper curve) and displacement bursts (lower curve) to extract the respective magnitudes Δσ and Δu*, as well as their duration Δt.

It is important to remark that the displacement generated during shear-band propagation is controlled by an elastic recovery of the load-frame-sample assembly, as described in the previous section. A relationship between the load-drop magnitude ΔF (= AΔσ, with A being the cross-sectional area) and the total displacement generated, Δu, can be shown to take the form

where κ corresponds to the system’s compliance. Modeling the load-frame-sample assembly by two springs in seriesReference Han, He, Zhong and Hou44 yields

where C m and C s are the compliances of machine and sample, respectively. With an additional simplifying assumption that the shear-band velocity v >> v appl, Eq. (1) follows from an integration of the so-called machine equation used to characterize stick-slip systems (e.g., see Ref. Reference Persson36):

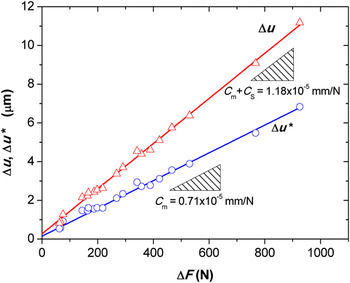
As pointed out in Ref. Reference Maaß, Klaumünzer and Löffler45, due to the nature of a typical compression setup, only the displacement recovered by the load-frame C mΔF is measured using strain gauges to monitor sample length. In Fig. 5, this is confirmed by plotting the measured values Δu* against ΔF (blue circles) with the slope reproducing the load-frame compliance C m. Hence, it is essential to correct the measured values of displacement burst to account for the sample contribution C sΔF as indicated by the red line and triangles in Fig. 5.
Blue circles: Experimentally determined values of displacement burst magnitude Δu* versus load-drop magnitude ΔF, showing a linear trend with the slope reproducing the load-frame compliance C m (blue fit). Red triangles: Corrected values of total displacement burst magnitude Δu taking into account the compliance of the entire system κ = (C m + C s), with C s being the compliance of a 5-mm-diameter sample. The compliance of the entire system, κ, corresponds to the slope of the red line.

Equation (1) demonstrates that the magnitude of displacement bursts is not a property of the metallic glass, but rather depends on both sample dimensions and machine characteristics, as also confirmed for small length scales in Ref. Reference Bharathula, Lee, Wright and Flores46. It is noted that this dimensional scaling is inherent to all stick-slip systems, as understood by inspecting the machine equation.
In characterizing the dynamics of discrete shear events in metallic glasses using the above methodology, it is important to bear in mind that shear-band propagation is driven by the recovery of excess elastic energy stored in the load-frame-sample assembly. An upper limit in shear-band velocity may therefore be thought to correspond to the maximum rate at which this elastic energy can be released, being approximately equal to the velocity of sound in the respective materials (of the order of 103 m/s). This argument will become important when assessing the resolution of the setup.
We will now proceed by discussing different models of shear-band propagation used to relate Δu and Δt to determine values of shear-band velocity.
IV. MODEL PICTURE OF SHEAR-BAND PROPAGATION
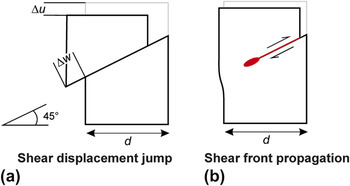
Because of the experimental difficulties of capturing shear banding in-situ, no common agreement has been reached regarding the actual mechanism of shear-band propagation. Two different models have been proposed in the literature. Following the notation by Wright et al.,Reference Wright, Samale, Hufnagel, LeBlanc and Florando22 these models refer to the two limiting cases in which (i) shear occurs simultaneously across the entire shear plane, termed shear displacement jump (SDJ) mechanism, or (ii) shear strain is localized within a small volume of material propagating progressively across the shear plane from one end of the sample to the adjacent free surface. The latter scenario is analogous to crack propagation in materials and bears some resemblance to dislocation motion in solids.Reference Vinogradov23 It is referred to as the shear front propagation (SFP) mechanism. Figure 6 shows schematic drawings that illustrate the two different scenarios.
Schematic illustration of different mechanisms of shear-band propagation; (a) shear displacement jump scenario and (b) shear front propagation mechanism.

The SDJ-velocity is calculated by dividing the magnitude of the shear offset Δw formed at the surface by the duration of the shear event Δt. Hence, for a shear band inclined at 45° relative to the main stress axis,

where Δu is the total uniaxial displacement, that is, corrected to include the sample contribution [see Eq. (1)]. The SDJ-velocity essentially represents a local shear rate within the deforming band.
By contrast, the SFP-velocity denotes the rate of the moving shear front. Δt is therefore assumed to be the time taken by the front to cross the entire shear plane of length  , with d being the sample diameter. The SFP-velocity is hence given by

It is important to note that different experimental evidence has been claimed to verify both models. Support for the SFP-model typically stems from ex-situ observations of diffuse shear bands that do not extend fully across, but terminate within the sample.Reference Yang, Morrison, Liaw, Buchanan, Wang, Liu and Denda20, Reference Vinogradov23, Reference Miracle, Concustell, Zhang, Yavari and Greer47 These shear bands typically form either at macroscopic stresses marginally below the yield plateau in an apparent hardening regime, as revealed by interrupted tests during uniaxial compression,Reference Liu, Liu, Gali, Inoue and Chen48 or, more prominently, on bending.Reference Conner, Johnson, Paton and Nix49 It is believed that the origin of these diffuse shear bands is in fact an inhomogeneous stress state, such that the criterion for yield is only fulfilled locally within the sample, that is, not bridging the entire shear plane. In this respect, diffuse shear bands simply reflect the high sensitivity of localized flow toward stress.
In an elegant experiment, Song et al.Reference Song, Wang and Nieh50 very recently combined high-speed imaging with time-resolved strain measurements during uniaxial compression testing. From the video recordings, the growth rates of the offsets on either side of the sample could be monitored for a single shear band. They found both rates to be equal, yielding direct support for the SDJ-model. It is therefore believed that in uniaxial compression testing under homogeneous stress states, shear-band propagation occurs by simultaneous glide along the shear plane. In this respect, under ideal conditions, a load drop simply corresponds to the stage at which uniform plastic flow occurs within a fully developed band. Despite its popular use, the term “shear-band propagation” might therefore be argued to be slightly misleading since the band itself is expected to remain stationary. Although not applicable to the propagation stage, it may, however, be envisioned that the initiation of a shear band follows a SFP-like mechanism. However, this must occur at time scales and with associated displacements that cannot be resolved by the current experimental technique.
In conclusion, it appears that the SDJ-scenario is most applicable to the case of uniaxial compression under homogeneous stress states, with the SDJ-velocity essentially providing a measure of the shear rate within a shear band, which is believed to be uniform along the band’s length. It must be recalled that since Δw scales with sample dimensions and machine stiffness, as follows from Eqs. (1) and (2), the SDJ-velocity as defined in Eq. (4) does not represent an intrinsic glass property. It is also remarked that under more complex stress states such as bending, the mechanism of shear-band operation might differ from a pure SDJ-scenario.Reference Miracle, Concustell, Zhang, Yavari and Greer47
In Sec. V, we will focus on typical values of SDJ-velocity, experimentally determined at ambient conditions for a Zr52.5Ti5Cu17.9Ni14.6Al10 glass (Vit105).
V. SHEAR-BAND VELOCITIES AT AMBIENT CONDITIONS
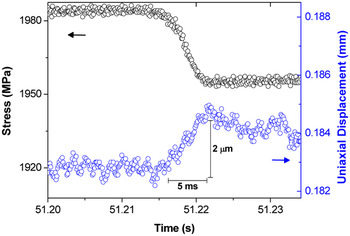
Figure 7 shows a time-resolved stress drop and the corresponding uniaxial displacement burst for a 3-mm-diameter sample of Vit105 tested at room temperature. The values for shear-event duration Δt and magnitude Δu* can be determined to be equal to 5 ms and 2 μm, respectively. Calculating the corrected displacement burst magnitude (≈4 μm) yields a SDJ-velocity of 1.1 mm/s according to Eq. (4). This value is in good agreement with results obtained in Ref. Reference Wright, Samale, Hufnagel, LeBlanc and Florando22. In Sec. III, we argued that the system can recover elastic strain at a maximum theoretical velocity of the order of 103 m/s, corresponding to the speed of sound in solids. It is noted that the actual value of shear-band velocity detected is smaller by a factor of 106 compared with this theoretical limit. This implies that it is in fact the dynamics of plastic flow in the shear band, which controls the relaxation rates within the system during slip instabilities. A shear band can thus be regarded as being unconstrained with respect to strain rate, validating the experimental approach chosen.Reference Klaumünzer, Maass, Dalla Torre and Löffler43
Resolved stress drop and displacement burst for Vit105 tested at room temperature and a strain rate of 10−3 s−1 (d = 3 mm).

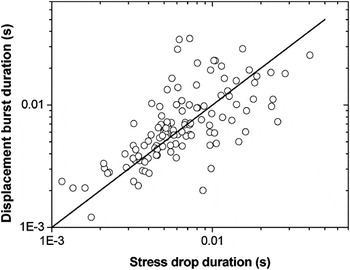
Figure 8 represents a plot of displacement burst duration versus stress drop duration, matching identical shear events. It can be seen that the values scatter around a line of slope unity (solid line added for clarity), essentially confirming that stress drop and strain burst are mutually interlinked and occur at the same time scales. This contrasts arguments raised in Ref. Reference Georgarakis, Aljerf, Li, LeMoulec, Charlot, Yavari, Chornokhvostenko, Tabachnikova, Evangelakis, Miracle, Greer and Zhang51, in which shear step formation was proposed to be significantly faster than stress drops. A match in durations is in fact to be expected according to the machine equation for stick-slip systems [see Eq. (3)], essentially relating the load relaxation rate to the slip velocity. This emphasizes the significance of viewing serrated flow in metallic glasses as a typical stick-slip process.
Correlation of displacement burst duration versus stress drop duration indicating a line of slope unity. The scatter is due to noise in the displacement signal.

In deriving an equation for the SDJ-velocity [Eq. (4)], shear was assumed to occur within a single shear band only. It is noted that strain gauges only provide measurements of global changes in displacement that are averaged over the entire sample length. No information can therefore be deduced directly from the signal regarding the number of shear bands operating during a single shear event. However, from an ex-situ imaging study by scanning electron microscopy, the total displacement generated in a single serration could be correlated to the change in shear offset of a single shear band after correcting for the angle of shear band propagation and machine compliance.Reference Maaß, Klaumünzer and Löffler45 This result hence confirms that each serration corresponds to the operation of a single shear band, validating Eq. (4).
Having established the room-temperature dynamics of shear bands, we will now focus on results obtained on lowering the testing temperature. We will show that by measuring the temperature-dependence of the shear-band velocity, a thermal contribution to the activation of plastic flow in metallic glasses can be discerned.
VI. TEMPERATURE-DEPENDENCE OF SHEAR-BAND PROPAGATION
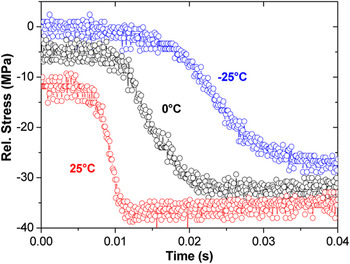
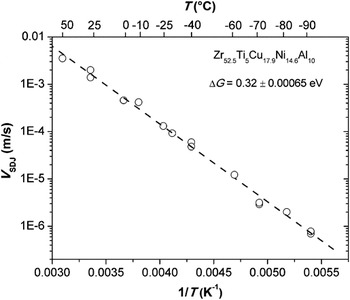
One of the most intriguing aspects of shear-band dynamics is a marked slowing down in velocity as temperature is reduced.Reference Klaumünzer, Maass, Dalla Torre and Löffler43 A qualitative representation of this effect is provided in Fig. 9, showing selected stress drops of comparable magnitude for different temperatures. It is easily apparent that the duration of shear events increases markedly with decreasing temperature. In fact, shear-event durations as long as a few seconds have been captured for Vit105 at −100 °C,Reference Maaß, Klaumünzer and Löffler45 while stress drop magnitude and strain burst size remain approximately independent of temperature.Reference Klaumünzer, Maass, Dalla Torre and Löffler43 Calculating the SDJ-velocities for a larger set of serrations allows for constructing an Arrhenius plot as given in Fig. 10. Linear behavior is observed with the shear-band velocity covering four orders of magnitude within a temperature range of 50 °C down to −90 °C.
Selected stress drops for Vit105 at three different temperatures between 25 and −25 °C. A remarkable increase in stress drop duration is observed on lowering the temperature (reproduced from Ref. Reference Klaumünzer, Maass, Dalla Torre and Löffler43).

Arrhenius plot of shear displacement jump velocity versus inverse temperature for Vit105. Tests were conducted at different strain rates between 10−3 and 10−5 s−1. Data taken from Refs. Reference Klaumünzer, Maass, Dalla Torre and Löffler43 and Reference Maaß, Klaumünzer and Löffler45.

By fitting the data in Fig. 10, an activation energy of 0.32 ± 0.0006 eV can be extracted for Vit105. In viewing shear-band propagation as a scenario of uniform plastic deformation along a shear band (SDJ-model in Sec. V), we can directly associate this energy term with the thermal activation of plastic flow. Assuming the fundamental flow units to be represented by STZs, we may propose their operation to be the rate-limiting step in governing the dynamics of shear-band propagation at a macroscopic scale. Hence, the SDJ-velocity can directly be related to the global plastic strain rate  within a shear band. The strain rate
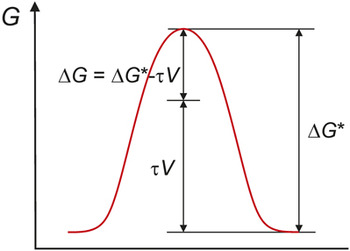
 is given by a product of the density of available sites ρ (number of sites per unit volume) times a unit quantity of strain γ 0 associated with each zone multiplied by the rate at which they transform, k. The latter depends on the thermal part of the activation energy barrier, ΔG, associated with each transformation in the limits of high stress τ (see Fig. 11 for details). Assuming the shear-band velocity to be proportional to the global strain rate, we may write

Applying a shear stress τ reduces the activation energy for shear transformation zone operation from ΔG* to ΔG by an amount τV, with V representing the activation volume.

where v 0 represents a characteristic frequency, k B is the Boltzmann constant, and T is the absolute temperature.
It is interesting to note that validation of the experimentally derived activation energy ΔG is found in recent simulation studies. MayrReference Mayr52 as well as Rodney and SchuhReference Rodney and Schuh53 determined activation barriers for atomic-scale inelastic flow events in model Cu–Ti and Cu–Zr glassy systems at high stresses and low temperatures. Both studies found activated states to be most favorable for energies of around 0.3–0.4 eV.
It must be remarked that when directly applied to experimental data, Eq. (6) represents a very simplistic view of relating the shear-band velocity on a macroscopic level to the rate of STZ-activity at a microscopic scale. As such, strain- or time-dependent processes, such as shear-induced softening or structural relaxation, have not been taken into account. These are expected to lead to a complex evolution of the glass structure as plastic flow proceeds, changing, for instance, the number of available sites ρ as well as the activation energy ΔG. This is in fact reflected in the highly transient response of the glass with the flow stress decreasing rapidly during each slip instability. In a very general context, attempts have been made to account for this evolution in structure in the theoretical framework of the effective temperature approach.Reference Langer54, Reference Daub and Carlson55
In addition, Eq. (6) assumes STZs to operate independently, that is, there is no coupling between neighboring zones. The point has been raised that adjacent STZs possibly do interact by some short-range stress fields.Reference Schuh, Hufnagel and Ramamurty5 Recent mesoscale modeling has also provided new insights into the spatial and temporal correlation of STZs as a function of stress and temperature.Reference Homer, Rodney and Schuh56 Strong coupling was directly associated with shear localization, while uncorrelated STZ-activity seems more applicable to the case of homogeneous flow at high temperatures.
While in the earlier analysis a single characteristic value of ΔG was deduced, it is commonly understood that STZs follow a distribution of possible activated states (e.g., in Ref. Reference Wu, Chen, Hui, Liu, Lin, Shang and Lu57). This is reflected in the concept of potential energy landscapes.Reference Stillinger58 It could, however, be argued that the most probable states will dominate the net response of the glass as probed in experiments, validating the approach taken.Reference Johnson and Samwer59
The above points demonstrate the complexity of the inhomogeneous flow behavior of metallic glasses with a general consensus regarding very fundamental aspects remaining to be established. As the experimental technique reviewed in this work is simple, it might present new ways to validate some of the above theory and models proposed.
Finally, it is interesting to remark that thermal effects on shear banding have also been found in other nonmetallic amorphous materials. KramerReference Kramer60 found that shear-band growth velocities in polystyrene follow a thermally activated mechanism. Interestingly, shear-band growth occurred by a process similar to the SFP-scenario proposed in Sec. IV. The associated velocities, being both stress- and temperature-dependent, were much slower than those for metallic glasses reported earlier, with the practical consequence that the propagation of the shear-band tip could be followed in-situ within easily accessible time scales.
Let us return to metallic glasses and discuss the implications that can be drawn from the earlier results for characterizing the shear-band dynamics both at ambient and at low temperatures. We will first focus on the long-debated issue of shear-band heating.
VII. IMPLICATIONS
A. Shear-band heating
Adiabatic heating associated with flow localization is a well-known phenomenon discussed not only in the metallic glass literature but also, for instance, in the field of crystalline metals.Reference Timothy61 In order for adiabatic conditions to prevail, it is clear that the rate of localized heat generation by plastic deformation needs to be faster than the rate at which heat is conducted away from the band into the bulk. As a consequence, shear-band heating in crystalline metals is believed to be significant only at high strain rates.Reference Poirier62
In metallic glasses, shear-band heating was originally proposed to be a possible cause for an autocatalytic process of softening and shear-band acceleration leading to rapid, catastrophic failure as often observed under tensile stress. Experimental attempts to measure shear-band heating directly, however, were not successful. Different techniques have therefore been used to indirectly infer a temperature rise. These range from thermal imaging to the fusible coating technique developed by Lewandowski and Greer.Reference Yang, Morrison, Liaw, Buchanan, Wang, Liu and Denda20, Reference Lewandowski and Greer24, Reference Wright, Schwarz and Nix39, Reference Miracle, Concustell, Zhang, Yavari and Greer47, Reference Georgarakis, Aljerf, Li, LeMoulec, Charlot, Yavari, Chornokhvostenko, Tabachnikova, Evangelakis, Miracle, Greer and Zhang51, Reference Zhang, Stelmashenko, Barber, Wang, Lewandowski and Greer63 From these studies, temperature increases from as low as a few Kelvins to almost 1000 K were predicted. The different models used essentially diverge in their assumption of how fast shear-band operation occurs as one of the most critical input parameters. To satisfy adiabatic conditions, studies revealing high temperature rises require shear to occur at rates faster than thermal diffusion, and hence deduce time scales of the order of nanoseconds for shear-band propagation.Reference Lewandowski and Greer24 By contrast, the shear-event durations measured directly from time-resolved serrated flow curves range from milliseconds up to a few seconds at low temperatures (see the earlier sections and Ref. Reference Maaß, Klaumünzer and Löffler45). It is clear that these time scales are too long to justify adiabatic conditions during shear, and when deployed in the respective models, they yield insignificant temperature rises.Reference Wright, Samale, Hufnagel, LeBlanc and Florando22, Reference Wright, Schwarz and Nix39–Reference Chen, Huang, Song, Nieh and Jang41
Additional, indirect evidence for insignificant shear-band heating during serrated flow is found in the distinct trend of shear-band velocity with temperature (see Sec. VI and Ref. Reference Klaumünzer, Maass, Dalla Torre and Löffler43). This indicates that shear banding occurs under thermally equilibrated conditions within the regime covered in these experiments. In other words, the temperature within the shear band corresponds to that applied externally and is not dominated by deformation-induced heating.
Although it is generally accepted that shear-band heating is not the cause of flow localization,Reference Lewandowski and Greer24, Reference Spaepen64 recent modeling work has focused on delineating the conditions under which shear may still be expected to be accompanied by significant temperature rises.Reference Cheng, Han, Li and Ma32, Reference Miracle, Concustell, Zhang, Yavari and Greer47 A shift from “cold to hot shear banding” at a critical sample size and machine stiffness has thus been proposed to be responsible for a transition from stable to unstable shear-band propagation.Reference Cheng, Han, Li and Ma32 The general picture emerging is hence that of shear-band heating being significant only as long as shear is sufficiently fast. This demonstrates the importance of quantifying the dynamics of shear-band propagation via experiments.
B. Shear-band viscosity
Recent studies have used the experimentally determined values for shear-band velocity to calculate an apparent viscosity η using the relationReference Dalla Torre, Klaumünzer, Maaß and Löffler33, Reference Song and Nieh40

where τ is the shear stress and  is the strain rate within a shear band. The shear stress τ was assumed to be constant since stress drop magnitudes typically equate to 1–2% of the total yield stress.
It is noted that when considering slip instabilities, Eq. (7) is in fact applied to a situation far away from steady-state in which the flow stress follows transient behavior. Despite the fact that the results thus obtained should hence be treated with care, they still provide useful qualitative insights. Both studies agree in that the shear-band viscosities calculated for ambient and low temperatures are comparable with similar values measured close to or above the supercooled liquid regime, where homogeneous deformation prevails. This concurs with the general perception that sufficient atomic mobility is required to accommodate plastic flow. With the results of the previous section, yielding can hence be viewed as a mechanically induced glass transition.Reference Chen65–Reference Guan, Chen and Egami67 Within the limits of negligible temperature rises, the drop in shear-band viscosity may hence be attributed solely to a mechanical origin, such as shear-induced dilatation.Reference Dalla Torre, Klaumünzer, Maaß and Löffler33, Reference Song and Nieh40
C. Dynamic origin of a transition to non-serrated flow
For metallic glasses, a transition from serrated to nonserrated flow above a critical applied strain rate has been reported in the literature.Reference Kimura and Masumoto31, Reference Dubach, Dalla Torre and Löffler68–Reference Dubach, Dalla Torre and Löffler70 Remarkably similar behavior is found in many stick-slip systems, marking a transition from intermittent to continuous system response (e.g., see Ref. Reference Cain, Page and Biggs71). For a metallic glass, a careful analysis revealed a one-to-one correlation between the temperature-dependence of the critical velocity for the transition to non-serrated flow and that of the shear-band velocity as given in Fig. 10.Reference Maaß, Klaumünzer and Löffler45 It was therefore concluded that non-serrated flow simply results from overwhelming the shear-band velocity by the crosshead velocity applied, essentially driving the shear band at the imposed strain rate. This and a further studyReference Maaß, Klaumünzer, Preiß, Derlet and Löffler72 also confirmed that in the cases of both serrated and non-serrated flow, plastic strain can be accommodated within a single shear band. The fact that a shear band can be driven at an imposed strain rate in a controlled manner offers new paths for studying the inhomogeneous flow behavior of metallic glasses. Preliminary work has shown non-serrated flow of a single shear band to be unstable as the stress level decreases rapidly with strain.Reference Maaß, Klaumünzer, Preiß, Derlet and Löffler72 This demonstrates the significance of shear-induced softening during inhomogeneous flow of metallic glasses.
VIII. CONCLUDING SUMMARY AND OUTLOOK
In the introduction we posed a series of open questions regarding the fundamental understanding of shear banding and inhomogeneous flow in metallic glasses. We will now return to these questions and address them individually, aligning our answers with the insights gained by characterizing the dynamics of shear banding as discussed above:
(1) Mechanism of shear banding bridging flow at microscopic and macroscopic scales: In answering this question, we will take a stick-slip theory perspective and thus propose the following mechanism. A flow serration is viewed as representing a full cycle of shear-band operation, including its nucleation, propagation, and arrest. Shear-band propagation, as reflected in stress drops, corresponds to a stage of prolonged, uniform flow within the band under transient stress. This results in a macroscopic lateral displacement of the sample along the shear plane, the magnitude of which depends on the amount of stress relaxed as well as system characteristics. At a microscopic level, plastic deformation is likely to be governed by the transformation of atomic-scale clusters (STZs). It could, however, be argued that the most probable states will dominate the net response. A large number of STZs will be required to populate the entire shear plane. As long as stress is sufficiently high to accommodate flow, STZs will be continuously activated, the rate of which determines the overall dynamics of the shear process. Below a certain limit, the stress is too low and plastic flow ceases, leading to shear-band arrest. Reinitiation will only occur once a critical stress is reached again. Considering the long time scales of shear-band propagation (>ms) and the transience in stress, dynamic changes in glass structure, affecting, for instance, the density of STZs, are likely to occur during a shear event.Reference Daub and Carlson55 Incorporating this aspect in addition to possible collective behavior of neighboring STZsReference Homer, Rodney and Schuh56 in subsequent modeling work opens a promising path for future study.
(2) Dynamics of shear-band propagation: A straight-forward answer to this question by assigning a single characteristic time scale to shear-band propagation is not possible because of the thermally activated mechanism governing the dynamics of shear banding. In consequence, depending on temperature, shear-event durations may cover a wide range from as short as a few milliseconds to time scales as long as seconds. Even longer time scales may be inferred at yet lower temperatures. However, because of the slow associated shear-band velocities, flow curves at these temperatures are typically non-serrated for reasonably accessible strain rates. It is important to bear in mind that the long time scales of shear-band propagation estimated from flow serrations provide justification that shear banding cannot be viewed as a catastrophic process, but instead follows a controlled, thermally activated mechanism.
(3) Shear-band heating and autocatalytic softening: It is clear that the time scales of shear-band propagation determined experimentally from flow serrations are too long to justify adiabatic conditions. Indirect evidence for insignificant shear-band heating is also found in the clear dependence of shear-band velocity on temperature, indicating that the local temperature within a band indeed (only) corresponds to that globally applied. With recent modeling work,Reference Cheng, Han, Li and Ma32, Reference Miracle, Concustell, Zhang, Yavari and Greer47 however, the general picture emerging may be slightly more complex. The aim is to differentiate between situations of “cold shear banding” or those in which temperature rises and autocatalytic softening leading to unstable shear may still be expected. It is clear that with the shear-band velocity being dependent on a range of different parameters, the dynamics of shear only needs to be fast enough for adiabatic conditions to prevail. However, experimental evidence for the validity of this picture remains to be established. In the same context, it is also clear that serrated flow can only be observed under conditions of stable shear banding, and, hence, it is not surprising to find, and in fact consistent with the picture above, that shear-band velocities determined from flow serrations lie within a regime of “cold shear banding.”Reference Klaumünzer, Maass, Dalla Torre and Löffler43 In conclusion, localized heating does not appear to be associated with shear banding per se, but conditions of sufficiently fast shear-band propagation may be envisioned such that local temperature rises may become significant. More work is needed to identify such conditions via experiments.
In summary, we have shown how time-resolved characterization of serrated flow can be used to quantify the dynamics of shear banding in metallic glasses within the framework of stick-slip theory. The insights thus gained contribute toward deepening our understanding of inhomogeneous flow, pointing at a model picture of shear-band propagation, a thermally activated mechanism of plastic flow as well as the origin of local softening. Our suggestions for future work include establishing a refined theoretical understanding of these yet predominantly phenomenological experimental results. A promising approach might incorporate recent modeling workReference Daub and Carlson55, Reference Homer, Rodney and Schuh56 in studying the behavior of STZs to identify and characterize the atomic-scale processes governing the dynamics of shear-band propagation.