INTRODUCTION
Many recent studies have shown links between the abundance of gelatinous zooplankton (Cnidaria and Ctenophora) and climatic fluctuations in diverse marine ecosystems ranging from the temperate Chesapeake Bay (USA) to the Ligurian Sea of the Mediterranean (Figure 1) and even a tropical lake in Palau, Micronesia (Molinero et al., Reference Molinero, Ibanez, Nival, Buecher and Souissi2005; Purcell, Reference Purcell2005; Martin et al., Reference Martin, Dawson, Bell and Colin2006; Gibbons & Richardson, Reference Gibbons and Richardson2009). In the northern Atlantic and its surrounding seas, the dominant atmospheric teleconnection pattern influencing marine ecosystems is the North Atlantic Oscillation (NAO) pattern (Drinkwater et al., Reference Drinkwater, Belgrano, Borja, Conversi, Edwards, Greene, Ottersen, Pershing, Walker, Hurrell, Kushnir, Ottersen and Visbeck2003; Hurrell et al., Reference Hurrell, Kushnir, Ottersen, Visbeck, Hurrell, Kushnir, Ottersen and Visbeck2003; Figure 1). This pattern of variability has been linked to interannual variability in gelatinous zooplankton in the North Sea (Lynam et al., Reference Lynam, Hay and Brierley2004, Reference Lynam, Hay and Brierley2005; Attrill et al., Reference Attrill, Wright and Edwards2007; Attrill & Edwards, Reference Attrill and Edwards2008; Gibbons & Richardson, Reference Gibbons and Richardson2009). In this study, we address the discord in the various findings, regarding the influence of the climate on gelatinous zooplankton in the North Sea, and we explore the likely mechanisms linking climate to jellyfish abundance.
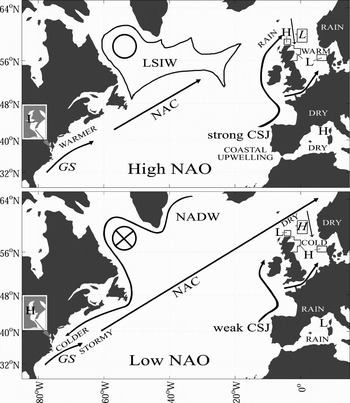
Schematic diagram of North Atlantic Oscillation (NAO)-governed changes in the strength of Atlantic currents (proposed by Reid et al., Reference Reid, Planque and Edwards1998) and the abundance of North Sea jellyfish. NAC, North Atlantic Current; GS, Gulf Stream; CSJ, Continental Shelf Jet; LSIW, Labrador Sea Intermediate Water; NADW, North Atlantic Deep Water. Note that the changes in CSJ, LSIW, and NADW may require a prolonged period of high/low NAO influence. H/L signifies relatively high/low jellyfish abundance in the defined rectangular regions, and italics indicate a two-year lag to NAO changes. Small arrows showing the shifting location of NAO-driven wintertime inflow to the northern North Sea are adapted from Planque & Taylor (Reference Planque and Taylor1998). Chesapeake Bay relationship from Purcell & Decker (Reference Purcell and Decker2005) and Mediterranean relationship from Molinero et al. (Reference Molinero, Ibanez, Nival, Buecher and Souissi2005). Figure adapted from Lynam et al. (Reference Lynam, Hay and Brierley2005).

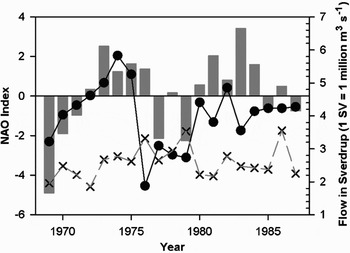
The North Atlantic Oscillation (NAO) describes an atmospheric pressure dipole with two foci: a high-pressure system in the south, centred on the Azores, and a low-pressure system over Iceland. The dipole is most pronounced in the winter months (December–March) and the normalized difference between the two pressures is an index used to measure the strength of the NAO. When the difference is greatest, the NAO is said to be in a high phase and the index is positive. In this circumstance, the pressure field results in strong westerly winds blowing warmer air towards northern Europe during the winter months, warming and mixing the North Sea surface waters. The associated increase in precipitation will result in increased river flows and run-off of nutrients to coastal areas. In the North Sea, a spatial pattern in the correlation between temperature and the NAO Index is evident, such that a positive NAO Index coincides with warm temperatures in the south-west and cool anomalies in the north-east (Lynam et al., Reference Lynam, Hay and Brierley2005). Oceanic inflows to the northern North Sea are also known to respond to a strong winter NAO pattern (greater inflow of surface water, 0–150 m deep, during a positive NAO Index; Figure 2) and even the most northerly extent of the Gulf Stream shows a lagged response (2–3 years) to the NAO Index (Planque & Taylor, Reference Planque and Taylor1998; Drinkwater et al., Reference Drinkwater, Belgrano, Borja, Conversi, Edwards, Greene, Ottersen, Pershing, Walker, Hurrell, Kushnir, Ottersen and Visbeck2003). Thus, the NAO has an underlying influence on the marine environment and interactions between species.
Southward flow between Orkney and Norway of surface (<150 m deep) water during winter (December–February, solid black line and circles) and spring (March–May, dashed grey line and crosses) and for comparison the winter (December–March) NAOI (grey bars).

The abundance of scyphozoan medusae of: Aurelia aurita Linnaeus, 1758; Cyanea lamarckii Péron & Lesueur, 1809; and Cyanea capillata Linnaeus, 1758, in the North Sea during June–August between 1971 and 1986 has been shown previously to be significantly related to the winter North Atlantic Oscillation Index (NAOI) (Lynam et al., Reference Lynam, Hay and Brierley2004). The relationship switches from strongly negative in the south-eastern North Sea, west of Denmark, through a weaker intermediate region east of Scotland to a positive relationship north of Scotland (Figure 1), mirroring the relationship between temperature and the NAOI (Lynam et al., Reference Lynam, Hay and Brierley2005). The North Sea regions are oceanographically distinct and therefore the spatial switch in the NAOI–medusa relationship could be due to differing local environmental processes and variable influence of inflow to the northern North Sea.
Attrill & Edwards (Reference Attrill and Edwards2008) found a positive correlation for the period 1962–2000 between the NAOI and the ‘Nematocyst Index’, in one of the six standard North Sea Contiuous Plankton Recorder (CPR) regions (C2) once corrected for a long term linearly increasing trend. The ‘Nematocyst Index’ is an annual index of frequency of occurrence of gelatinous tissue and nematocysts (stinging cells) and is an integrative measure of occurrence of Cnidaria, Ctenophora and Siphonophora (excluding separate recordings of rigid calycophoran siphonophores) in CPR samples. Since the CPR region C2 encompasses the east of Scotland region, investigated by Lynam et al. (Reference Lynam, Hay and Brierley2004), Attrill et al. (Reference Attrill, Wright and Edwards2007) suggested that the negative relationship found previously, between the abundance of medusae (Cnidaria and Scyphozoa) and the NAOI was merely a result of the use of a shorter time-series by Lynam et al. (Reference Lynam, Hay and Brierley2004). However, a recent study by Gibbons & Richardson (Reference Gibbons and Richardson2009) noted that the CPR does not sample scyphozoan medusae preferentially to other gelatinous organisms and suggested that the comparison of the results of Attrill et al. (Reference Attrill, Wright and Edwards2007) to those of Lynam et al. (Reference Lynam, Hay and Brierley2004) was misleading. Nevertheless, Gibbons & Richardson (Reference Gibbons and Richardson2009) also found positive correlations between CPR jellyfish frequency of occurrence and the NAOI in the western and north-western North Sea (CPR areas B2 and C2, once corrected for autocorrelation); the dataset used included Cnidaria, Ctenophora and all pelagic siphonophore data and thus differed to that of Attrill et al. (Reference Attrill, Wright and Edwards2007) and Attrill & Edwards (2008). On a wider scale, no further links to the NAO were found in an additional 35 CPR standard areas across the North Atlantic suggesting that the NAO influence is limited to jellyfish in the North Sea. In contrast, warm sea surface temperature and an abundance of prey (CPR total zooplankton) in oceanic areas were significant predictors of jellyfish frequency of occurrence (Gibbons & Richardson, Reference Gibbons and Richardson2009).
To determine the likely mechanisms linking the climate to jellyfish abundance in the North Sea we must explore the importance of the interaction, through wind-stress, between the NAO and the extent of seasonal oceanic water incursions into the northern North Sea. In fact, Attrill & Edwards (Reference Attrill, Wright and Edwards2008) found more and stronger correlations (at the 95% confidence level after detrending) between the Nematocyst Index and inflow (4 of 6 CPR regions: B2, C1, C2 and D1) than with the NAOI (C2 only). In this study, we attempt to determine whether oceanic inflow exerts a significant influence on the summertime distribution of scyphozoan medusae in the North Sea and, if so, whether the pattern in the scyphozoan medusae response is similar to that displayed by the gelatinous zooplankton community as sampled by the CPR. We also consider the biological responses of jellyfish to temperature change and we attempt to summarize the likely mechanisms linking regional scyphozoan jellyfish populations to interacting influences of oceanography and climate.
MATERIALS AND METHODS
The strength of the spatially varying association between the North Atlantic Oscillation and both sea surface temperature (SST) in the North Sea and precipitation was assessed through correlations between the station based NAOI (Hurrell et al., Reference Hurrell, Kushnir, Ottersen, Visbeck, Hurrell, Kushnir, Ottersen and Visbeck2003), spatially averaged SST anomalies determined from the HadSST2 1 degree dataset (Rayner et al., Reference Rayner, Brohan, Parker, Folland, Kennedy, Vanicek, Ansell and Tett2006), and total rainfall at four coastal stations (Klein Tank et al., Reference Klein Tank, Wijngaard, Konnen, Bohm, Demaree, Gocheva, Mileta, Pashiardis, Hejkrlik, Kern-Hansen, Heino, Bessemoulin, Muller-Westermeier, Tzanakou, Szalai, Palsdottir, Fitzgerald, Rubin, Capaldo, Maugeri, Leitass, Bukantis, Aberfeld, Van Engelen, Forland, Mietus, Coelho, Mares, Razuvaev, Nieplova, Cegnar, Antonio Lopez, Dahlstrom, Moberg, Kirchhofer, Ceylan, Pachaliuk, Alexander and Petrovic2002) (see Table 1 for locations and temporal periods). The effect of oceanic incursions on populations of Scyphozoa in the North Sea was explored using outputs from the Norwegian Ecological Model (NORWECOM); an hydrodynamically coupled 3-D primary production model (Skogen et al., Reference Skogen, Svendsen, Berntsen, Aksnes and Ulvestad1995; Skogen & Søiland, Reference Skogen and Søiland1998) and the abundance of the dominant species of medusae found in each of the 4 regions used by Lynam et al. (Reference Lynam, Hay and Brierley2004; Figure 1). The scyphomedusae abundance data result from the ‘bycatch’ of whole animals during ICES International Young Gadoid Surveys of the North Sea; for details of the sampling methods see Hay et al. (Reference Hay, Hislop and Shanks1990) and Lynam et al. (Reference Lynam, Hay and Brierley2004). In order to reduce the number of correlations undertaken, and thus reduce the chances of committing a Type I error, the maximum regional abundance of those species suggested by Lynam et al. (Reference Lynam, Hay and Brierley2005) to be influenced by inflow of Atlantic water was correlated here with modelled inflow. The biological response of medusae to changes in SST and precipitation are discussed as possible processes linking medusae to climatic fluctuations in conjunction with inflow effects.
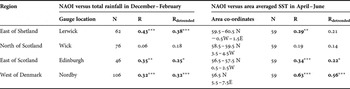
Strength of associations between the station-based winter (December–March) North Atlantic Oscillation Index (NAOI) and both winter (December–February) rainfall, between 1900 and 2008, and spring (April–June) sea surface temperature (SST), between 1950 and 2008, for the 4 regions of interest in the North Sea.

N, number of years; R, Pearson correlation coefficients; Rdetrended Pearson correlation coefficients based on linearly detrended data; starred entries in bold indicate significant correlations at the *α = 0.1, **α = 0.05 and ***α = 0.01 significance levels.
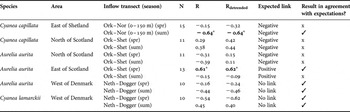
Lynam et al. (Reference Lynam, Hay and Brierley2004, Reference Lynam, Hay and Brierley2005) suggested that summertime inflow (independent of the winter NAO phase) via the Fair Isle current is likely to advect Aurelia aurita medusae from the North of Scotland region and aggregate them to the east of Scotland. Indices of inflow by this current during spring (March–May) and summer (June–August) were therefore studied. Medusae of Cyanea capillata were found regularly in the far north of the North Sea. The abundance of this species was compared to inflow by the Fair Isle current, and for total inflow to the North Sea (between the Orkneys and Norway), during spring and summer in the north of Scotland and east of Shetland regions respectively. Lynam et al. (Reference Lynam, Hay and Brierley2004) also suggested that the strong relationships found between the abundance of A. aurita and C. lamarckii and the NAOI in the relatively shallow region west of northern Denmark may be due to the relative isolation of this area from the effects of oceanic incursions and thus a strong influence on the population by direct interactions between the air–sea and land–sea interfaces. Considering the average current field in the North Sea and the generally coastal distribution of scyphozoan medusae, it is unlikely that medusae would be advected from either the east of Shetland region or the east of Scotland regions to the west of Denmark. However, it is possible that the current from the south and south-west may advect medusae towards Denmark, therefore the strength of the spring and summer north-eastward flow across a transect from Dogger Bank (3°E 55°N) to The Netherlands (5.5°E 53°N) was considered in this respect.
Attrill et al. (Reference Attrill, Wright and Edwards2007) suggested that the frequency of occurrence of gelatinous tissue and nematocysts in the CPR data overwhelmingly reflects the variability in the abundance of scyphozoans. While in contrast, Gibbons & Richardson (Reference Gibbons and Richardson2009) tested the assumption and found no statistically significant correlations between the CPR jellyfish data (annual frequencies) and the species data of Lynam et al. (Reference Lynam, Hay and Brierley2004), individually or summed. A common weakness in these previous results is that the annual means have been calculated from the CPR data and then compared with summertime medusa abundance data from Lynam et al. (Reference Lynam, Hay and Brierley2004). So, correlations were made here between medusa abundance and the Nematocyst Index for the June–July period in order to verify, or otherwise, the suggestion that the CPR measures interannual variability in gelatinous zooplankton population abundance similarly to the scyphomedusa catches from trawl samples. The CPR device is a plankton sampling instrument, designed to be towed by merchant ships on their normal routes, which filters plankton from the water at a depth of about 10 m on a moving band of silk (270 micron mesh size) (for further details on the CPR sampling methodology regarding gelatinous zooplankton see Attrill et al., Reference Attrill, Wright and Edwards2007; Haddock, Reference Haddock2008; Gibbons & Richardson, Reference Gibbons and Richardson2009).
RESULTS
North Atlantic Oscillation: linkages to the marine environment
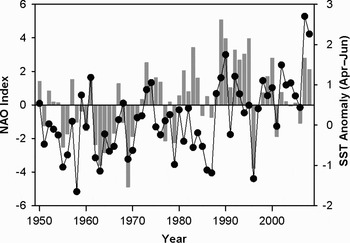
The significance of the relationships between the NAOI and both spring (April–June) temperature and winter (December–February) rainfall was tested for the four regions in the North Sea in which jellyfish data are available. Significant positive correlations were found in the average SST anomaly to the west of Denmark (5.5 to 7.5°E 56.5°N; Figure 3) and weak links to the east of Scotland and Shetland became non-significant, at the 95% confidence level, once detrended (Table 1). The pattern of significance was also shown in annual mean SSTs, albeit with lower correlation coefficients. A similar pattern was found with winter rainfall data, except that the correlation for the east of Shetland region remained significant once detrended (P < 0.01). There were no significant links between the NAOI and either SST or rainfall to the north of Scotland. Although winter inflows are known to be linked to the NAOI, the flows studied here in the spring and summer periods (see Table 2) for those years in which jellyfish abundance data are available (1971–1986) were not found to be correlated with the NAOI.
Positive correlation (R = 0.63, P < 0.001, N = 59) between sea surface temperature (SST) to the west of northern Denmark (April–June, black line and circles) and the North Atlantic Oscillation (NAO) Index for the preceding winter (December–March, grey bars).

Strength of associations between modelled seasonal inflow and maximum medusa abundance for the dominant species in four regions of the North Sea.

N, number of years; R, Pearson correlation coefficients Rdetrended Pearson correlation coefficients based on linearly detrended data; asterisk entries in bold indicate significant correlations at α = 0.05 significance levels after sequential Bonferroni correction for multiple comparisons; Ork, Orkney; Nor, Norway; spr, spring; sum, summer; Shet, Shetland; Neth, The Netherlands; Dogger, Dogger Bank.
Possible inflow effects on jellyfish in the North Sea
The hypothesis that medusae may be aggregated to the east of Scotland region by the effects of current flow is supported by a significant positive correlation between springtime (March–May) inflow by the Fair Isle current and the maximum abundance of Aurelia aurita east of Scotland (Table 2). In contrast, the summertime maximum abundance of C. capillata to the east of Shetland was negatively correlated with the summertime (June–August) inflow (largely independent of the winter NAOI) of oceanic waters to the North Sea, suggesting that medusae are typically transported out of the region by the inflow but the population is able to ‘bloom’ in the area if the flow weakens. Since there is no direct correlation between the NAOI and the abundance of this species to the east of Shetland, the advective influence appears to overwhelm any potential effect of fluctuations in the winter NAO on the medusa population. As expected, no significant relationships were found concerning the advection of A. aurita and Cyanea lamarckii toward the west of Denmark region; supporting the assumption that medusae in the region are not subject to strong oceanic influences (although the broadly negative correlations would suggest that weaker flow into the area coincides with higher abundance; Table 2).
Gelatinous zooplankton samples in trawls versus the Continuous Plankton Recorder (CPR)
A significant correlation was found between summer (June–July) CPR Nematocyst Index and maximum abundance of A. aurita medusae in the CPR C2 region (r = 0.72 raw and 0.66 detrended, both P < 0.05, N = 10). No other significant correlations were found with Aurelia or Cyanea spp. in any region. Since the abundance of A. aurita east of Scotland is also linked to spring inflow, this significant correlation with the CPR data suggests that both measures record the effects of advection on their target organisms similarly. However, the summer CPR data in general does not correlate with the medusa abundance data (for all other regions P > 0.05), suggesting that a relatively small proportion of the gelatinous tissue and nematocysts collected by the CPR are from scyphomedusae. The positive correlations found by Attrill et al. (Reference Attrill, Wright and Edwards2007) between the annual Nematocyst Index data and the NAOI were not evident for the summer (June–July) period, reflecting the dominance of the annual index by autumn–winter, non-scyphozoan samples.
Summary
The distribution of gelatinous zooplankton (Cnidaria and Ctenophora) in the northern North Sea is linked to inflows of oceanic waters to the east of Shetland and of mixed waters between the Shetland and Orkney Isles. Population variability of medusae (Scyphozoa) in the southern North Sea appears strongly coupled to fluctuations in the winter NAOI, which itself is linked strongly to variability in temperature and rainfall.
DISCUSSION
Gelatinous zooplankton samples in trawls versus the Continuous Plankton Recorder (CPR)
The CPR is a very different sampling device (with an apparatus opening of only 1.61 cm2) to the pelagic trawl (mouth opening ~14 m2 with mesh size tapering down from 10 cm in the wings of the net to 1 cm in the cod-end, Lynam et al., Reference Lynam, Hay and Brierley2004) from which large medusae were collected during ICES young gadoid surveys. Thus the two datasets do not measure similar zooplankton communities (see also Haddock, Reference Haddock2008). In addition, the annual CPR Nematocyst Index has a large component of samples collected during autumn–winter (Attrill et al., Reference Attrill, Wright and Edwards2007; Figure 1) and thus the annual index is unlikely to represent solely the interannual variation in the abundance of large medusae of the class Scyphozoa (i.e. scyphomedusae), which are predominantly present during the summer. We should perhaps expect a difference in the correlations between the NAOI and the abundance of scyphomedusae from pelagic trawls (Lynam et al., Reference Lynam, Hay and Brierley2005, Reference Lynam, Hay and Brierley2005) and between the NAOI and the diverse gelatinous zooplankton groups sampled by the CPR that can differ in seasonality from that of the scyphomedusae. A further difference could be exhibited in the spatial distribution of these groups, while that of scyphomedusae is generally coastal (e.g. many were caught in the east of Scotland area but relatively few to the east of the box), the gelatinous tissue and nematocysts sampled by the CPR can occur in high frequency in the central areas of the North Sea. Nevertheless, Attrill et al. (Reference Attrill, Wright and Edwards2007) found that there was a similarity in the annual Nematocyst Index and the abundance of Aurelia aurita in one (C2, east of Scotland) of the CPR regions. This similarity is due to an external force (inflow) acting in parallel on differing gelatinous organisms measured by their respective datasets. The assertion that the CPR annual Nematocyst Index records jellyfish abundance similarly to the International Young Gadoid Pelagic Trawl data used by Lynam et al. (Reference Lynam, Hay and Brierley2004, Reference Lynam, Hay and Brierley2005) is not supported as concluded by Gibbons & Richardson (Reference Gibbons and Richardson2009).
Probable climatic and oceanic influences
There are two related abiotic influences on gelatinous zooplankton populations in the North Sea: advection by oceanic and mixed (coastal and shelf) water incursions into the northern North Sea and direct climatic effects (warming of surface waters and precipitation); both of which are related to fluctuations in the atmospheric pressure field as encapsulated by the NAOI. A high NAOI is characterized by strong westerly winds during the winter and a greater wintertime inflow of surface waters (0–150 m deep) into the northern North Sea and a weaker wintertime inflow of deeper oceanic waters (150–300 m) (Planque & Taylor, Reference Planque and Taylor1998). These findings reflect the relative strengthening of the two pathways into the North Sea by the NAO during the winter, i.e. the Fair Isle current (on shelf, dominated by mixed surface water inflow) and the inflow East of Shetland (dominated by oceanic water inflow) (Figure 1). It appears that the NAOI is linked directly to the variability in the medusa populations to the west of Denmark, whereas, in the intermediate regions east of Scotland and east of Shetland, the effects of spring and summer advection are able to overwhelm or mask the influence of the winter NAO. To the east of Shetland, jellyfish appear to be advected out of the region by oceanic inflow during the summer. There is no evidence of a similar process to the north of Scotland, which sheds doubt on whether medusae are being advected to the east of Scotland from the north. However, the Fair Isle current is composed of a mixture of coastal water originating to the west of Scotland and Atlantic water coming on to the shelf west of Shetland (Turrell et al., Reference Turrell, Slesser, Payne, Adams and Gillibrand1996), so it is possible that medusae to the north of Scotland are supplemented by individuals from the west. Alternatively, the increase in abundance of Aurelia aurita to the east of Scotland may be due to a number of causes that are linked to the increased inflow of the Fair Isle current, including but not limited to: an increase in nutrient input during the spring phytoplankton bloom; an increase in the abundance of oceanic copepods or other zooplankton prey; or a direct influence of salinity on strobilation.
An interesting comparison to this study is the recent finding that five scyphozoan species, Aurelia aurita, Cyanea lamarckii, C. capillata., Chrysaora hysoscella and Rhizostoma octopus, exhibit distinct species-specific distributions in the Celtic and Irish Seas (Doyle et al., Reference Doyle, Houghton, Davenport and Hays2007). Over three years, Cyanea spp. generally dominated to the north of the Irish Sea (>53°N), while Chrysaora hysoscella dominated to the south of the seasonal Celtic Sea front. Cyanea capillata is also more abundant in the northern North Sea and its distribution may be linked in part to its thermal preferences for cool waters (Hay et al., Reference Hay, Hislop and Shanks1990; Doyle et al., Reference Doyle, Houghton, Davenport and Hays2007). The influence of the current field in the northern Celtic Sea and Irish Sea alone does not explain the differing spatial distributions of these species suggesting that jellyfish, particularly the species with larger medusae (e.g. R. octopus and C. capillata), have habitat preferences, which, when coupled with behavioural mechanisms, may partly explain their distributions (Graham et al., Reference Graham, Pages and Hamner2001).
Temperature effects on jellyfish population development
The spatial pattern in the relationship between the abundance of jellyfish and the NAOI is shown similarly in the relationship between sea surface temperature and the NAOI, suggesting that temperature is a possible direct route through which the climate can impact upon jellyfish. An indirect route through nutrient inflow (stimulated by high precipitation, increased run-off from rivers and/or inflow of oceanic water to the North Sea) and elevated prey abundance is also conceivable (Lynam et al., Reference Lynam, Hay and Brierley2004, Reference Lynam, Hay and Brierley2005). The effect of temperature on scyphozoan jellyfish is complicated by the unusual life cycle of these organisms, which involves sexual and asexual reproduction (Vagelli, Reference Vagelli2007). The number of medusae produced in a particular year is due largely to the strobilation of the benthic scyphistoma, the ‘polyp’. However, the number of polyps present is not measurable in situ due to their small size and unknown locations. Although polyps are able to survive over many years the mortality of this stage is presumably highly variable. New polyps may be created through the asexual budding of existent polyps or by larvae, which are released by the sexual medusa stage, settling on a substrate. Jellyfish populations in the North Sea display great interannual variability in the abundance of medusae, but it is not known if this fluctuating nature is due to variability in the mortality of polyps or in the number of ephyrae (young medusoids) produced per polyp, or both. Temperature is known to affect the processes of strobilation and budding, but the relationship is not clear. The onset of strobilation is stress-related and has been linked to the seasonal reduction in temperature, potentially with a threshold level above which strobilation may not occur (Russell, Reference Russell1970, and references therein). A thorough investigation of Aurelia aurita from a tropical environment found that not only did warm temperatures (25°C and 30°C relative to 20°C) accelerate strobilation but that the mortality of scyphistomae also increased (Liu et al., Reference Liu, Lo, Purcell and Chang2009). In contrast, budding rates increased at low temperatures and decreased at high temperatures. When scyphistomae were stressed, by reducing temperatures by 10°C, they began to strobilate and more ephyrae per polyp were produced at the higher temperature (30°C). However, the potential yield of ephyrae was shown to decrease in the high temperature group; where potential yield = (number of ephyrae produced) multiplied by (1 plus the number of new buds). The potential yield was also dependent on the light regime in which polyps were kept: no difference was found between the potential yield at 25°C in shade (56 lux) or dark (0 lux) conditions or between 20°C and 25°C in shade (polyps did not strobilate in the dark at 25°C). Interestingly in light (372 lux) conditions the potential yield was greater at 20°C relative to 25°C. So, although global warming may increase the rate of ephyral release, if temperatures warm too much, such that a possible winter minimum threshold is not met, strobilation may be suppressed and budding rates of new polyps might also decrease. Our results suggest that in situ jellyfish populations may benefit from low temperature anomalies, which are expected in the North Sea during low (negative index) NAO years. However, this response, as exemplified by Aurelia aurita and Cyanea lamarckii to the west of Denmark, is only evident when not compounded by the advective influence of currents on medusae that may serve to aggregate (east of Scotland) or disperse (east of Shetland) jellyfish.
Concluding remarks
The similarity between the two studies (Lynam et al., Reference Lynam, Hay and Brierley2004; Reference Lynam, Hay and Brierley2005; Attrill et al., Reference Attrill, Wright and Edwards2007; Attrill & Edwards, Reference Attrill and Edwards2008) in relation to the climatic and oceanic influences on gelatinous zooplankton is a result of both groups (summer scyphozoan medusae abundance and the annual Nematocyst Index of gelatinous zooplankton) responding to mixed-water incursions to the North Sea. Thus, the likely mechanism explaining the positive correlation between the NAOI and the annual Nematocyst Index by Attrill et al. (Reference Attrill, Wright and Edwards2007) is that of advection into the North Sea of organisms during the winter when the NAOI influence on inflow is greatest. The weakness in the relationship east of Scotland in the summer found by Lynam et al. (Reference Lynam, Hay and Brierley2004) between the abundance of medusae and the NAOI is likely due to the effects of currents (largely independent of the winter NAO) during the spring overpowering the winter NAO influence. The linkage between the NAO and jellyfish is displayed most strongly by the A. aurita and C. lamarckii populations west of Denmark and may be temperature-based. Although we have stressed the importance of current flow on the distribution and abundance of gelatinous zooplankton in the northern North Sea it should not be concluded that patterns in jellyfish distribution are driven solely by advection. The findings of this study demonstrate that the climate does appear to influence the abundance of medusae (Scyphozoa), but that there is a subtle interplay between abiotic factors (temperature, precipitation and currents) that impact on jellyfish populations. Thus, the direct and indirect processes linking jellyfish abundance to the climate should be further studied in areas, such as the waters to the west of northern Denmark, where the influence of current flows is minimal. This study also highlights the benefit of considering spatial scale when analysing biological data with respect to climatic and oceanographic variability.
ACKNOWLEDGEMENTS
We would like to acknowledge the efforts of M. Edwards, J. Wright and the entire CPR team at the Sir Alister Harvey Foundation for Ocean Science in collating the CPR gelatinous zooplankton data. The authors would also like to thank J. Hurrell for distributing the NAO Index data, S. Hay for supplying the scyphomedusae files and J. Kennedy for useful discussions regarding the Hadley Centre's HadSST2 dataset.