
The protests of the Arab Spring movement of 2011 surprised many in terms of their speed, geographical spread, and international involvement. The range of divergent processes and outcomes from the individual countries is remarkable. In 2014 there were massive protests that resulted in, among other things, a military coup in Thailand, the Russian annexation of the Crimea, tens of thousands in the streets of Caracas, and prodemocracy protests in Hong Kong. The governments of each country faced large protest actions that imposed significant costs on the state and generated various responses to quell or coerce the protesters. More recently, hundreds of thousands of people have taken to the streets in Japan and Malaysia. But what is the relationship between protest behaviors and state responses to them? Why do some protests generate harsh responses and others accommodation? As we observed in many of the Arab Spring movements, and certainly in Ukraine and Syria, internal protests are not immune to the influence of international actors. There are numerous instances of external interventions in situations far short of civil warFootnote 1 and at the extreme, internal protests can alter the international configuration of allies and enemies, if not entire maps.
The regional and global diffusion of protests associated with common overarching grievances, that is, the Occupy Movement and Arab Spring, demonstrates that collective action is a phenomenon that crosses international borders. The ongoing civil war in Syria is a wake-up call about the need to improve our understanding of the relationship between protests and state responses. What started as a protest in Dar'a in March 2011, which the state responded to by shooting and killing protesters, spiraled into country-wide protests and ultimately a violent rebellion that has entangled neighboring countries, transnational nonstate actors, and global powers.Footnote 2 Put differently, the international dimensions and consequences of internal protests are such that is it theoretically limiting to consider protests solely in a domestic context.
The study of civil wars has embraced their international dynamics and advanced our understanding of their underlying conditions and their subsequent termination, yet we systematically miss the processes that generate civil wars. That is, they appear to start with claims making and collective unrest and with increasing frequency attract external involvement but our models tend to focus on structural conditions. If we artificially strip out the demands and state responses that are often the harbinger of rebellion and intervention, our ability to understand, predict, or control international events is diminished.
Cederman and his colleagues suggest that macro-level indicators are poor predictors of rebellion and miss the critical role of subnational and state behavior.Footnote 3 Our analysis builds on this insight by focusing on microlevel components of protest cost structures and the resulting government response. Understanding how dissidents and states interact through protests and responses is an initial step in exploring how societies jostle over rights and access that should inform how we think about the conditions for civil war. One explanation for the observed frequency of protests and armed rebellion is found in state response to earlier dissent.Footnote 4
Repressive structures and actions by the state have been linked to civil war onset.Footnote 5 This tends to form the foundation for the inverted U-curve model of repression and conflictFootnote 6 and the democratic peace in civil war.Footnote 7 Yet even this assumed homogeneity of states obscures the role of state behaviors in the escalation from protest to civil war. This might show up in ethnonational politics when opposition movements lose the struggle for representation, but because of their organizational capacity have the ability to escalate repressed dissent toward armed conflict.Footnote 8 These incentives and behaviors are first observed in protests and the motivation to escalate beyond protests might be a function of how the state responds.
In this sense, the rather vague barrier between comparative and international politics might obscure more than it illuminates. Preemptive or proactive interventions by states or international organizations require an understanding of internal dynamics in potentially unstable countries. How a state responds internally to demands by its citizens will influence how or if the world community responds in that state. Recent protests around the world make this clear. And these linkages in the literature are neither new nor settled.Footnote 9
We frame our argument about state responses to protest actions in terms of concession and disruption costs. Many studies of protests, social movements, and armed conflict rely on assumptions about costs in determining movement successes, negotiations with the state, or the onset of armed conflict. Costs are typically defined as government behaviors that impede dissidents’ ability for collective action. We change this causal arrow and hypothesize how dissidents generate costs that structure the government's response to a protest. We also unpack the “black box” of costs into distinct and discernable parameters. We disaggregate costs along dimensions of concession and disruption and use these different forms of costs to account for various state responses to protests. We therefore extend our understanding of how we think about protest behaviors and the conditions under which they are more (less) effective.
We develop theoretical linkages between protest behaviors and state responses and ask whether protest behaviors determine how a state responds to those actions. The importance of understanding how states respond to particular protests is evident in recent scholarship.Footnote 10 We demonstrate how protests shape cost structures and how the costs influence state behavior. Our focus is on protests because they create the initial bargaining environment between public dissent and the state. After placing our argument in the extent literature, we articulate a theoretical model that accounts for how a state responds to protests under differing cost structures. The implications of our argument are tested against data on protests in 161 countries over a twenty-five-year period. Our results confirm that high disruption costs generate accommodation while high concession costs generate a coercive response. By our reading this reflects one of the first systematic analyses that links protester-generated costs to state responses.
Social Movements and the Expression of Demands
The literature on protests has a long tradition.Footnote 11 A government's ability to constrain collective action is integral to maintaining political control as popular participation makes civil resistance credible and successful.Footnote 12 Collective action combines current mobilization, relative capability of opposition groups, the state's response to demands, and uncertainty over the state's response.Footnote 13 Regime violence can be a stimulus for increased protest participation by reducing societal support for the government.Footnote 14 Contagion models suggest that revolts are spatially or temporally linked through demonstration and learning effects of successful tactics.Footnote 15 Moreover, internal political instability has the potential to generate external interventions.Footnote 16
Empirical evidence tends to support the idea that the casual arrow for state responses flows from opposition actions to government repression.Footnote 17 When demands are strong the state is more likely to react with coercion; this evidence is buttressed by action-reaction analyses;Footnote 18 regimes appear to be more open to negotiation when confronted by nonviolent opposition demands.Footnote 19 The tactics and demands of protests impose costs on the state and these costs condition interactions between the state and the opposition.
The Process of Demands and Responses
Grievances generate demands that citizens can express in the form of protests. Articulating a demand on the state is an opening move between domestic actors within the confines of an asymmetric power relationship.Footnote 20 There is strength in aggregation through mobilizing opposition groups. Others consider the role of protection,Footnote 21 leadership strategies,Footnote 22 social networks that facilitate mobilization,Footnote 23 or the interplay of economics and social motivationsFootnote 24 to be of critical importance.
The state has weak incentives to concede and considerable motivations to disregard demands or respond with coercion.Footnote 25 Unresponsive states, however, can encourage additional protests and further the organization of opposition supporters. A dismissive government response can be framed as promoting collective humiliation that generates additional opposition anger and determination.Footnote 26 Repression can work to subdue protests,Footnote 27 making coercion a bargaining strategy of the state. But coercion can have significant consequences if the state is incapable of controlling escalation.Footnote 28
Contemporary logic suggests that the degree to which protesters increase the costs on the ruling coalition makes a coercive response increasingly likely. If the government expects coercion to eliminate the threat, then coercion provides a vehicle for maintaining the status quo. However, these models tend to neglect the role of accommodating demands and assume that costs are homogeneous. For example, we know little about the conditions under which states respond to protests with accommodation rather than coercion. We know even less about when the government strategically disregards protesters.Footnote 29 We see state response as a function of heterogeneous costs that we define as concession and disruption costs and we focus on how differences between these costs generate coercive, accommodative, or crowd-control responses by the state.
Protest Costs and Government Response
Protests impose costs on the state. These costs may be rather meager and motivate little more than crowd control when the size is nonthreatening and the demands are minimal (i.e., police barricades, tear gas, or moving riot police into position). Alternatively, large protests that are part of a series of actions that span multiple locations and occupy public spaces can pose greater costs on the state. The type of demand influences the costs the state faces. Demands such as resignation or structural changes impose greater costs than demands for resource distribution or political or social rights. Studies show that high costs imposed by the opposition challenge a leader's job security and that leaders prefer to use the least costly means of maintaining office.Footnote 30
At their most basic form, costs are either high or low and analogous to maximalist, minimalist, or limited goals, respectively. Maximalist demands target the core of the regime and seek to alter the loci of authority.Footnote 31 Direct challenges to the government's source of power or ideology are the crux of maximalist demands. Activists organized in support of maximalist objectives are often willing to endure long battles and risk personal welfare.Footnote 32 Ukraine and Thailand in 2014 are examples. Maximalist demands may create such a small bargaining range that the state prefers the risks and costs of coercion to any potential acceptable accommodation. As the protesters’ demands threaten the core constituency, coercion is increasingly likely.Footnote 33
Limited or minimalist demands do not directly challenge the regime's hold on power, imperil the regime's political survival, or urge an overthrow of the status quo.Footnote 34 Instead, they aim to “win hearts and minds” and bring issues to the political leadership's attention.Footnote 35 The goal is to satisfy grievances while leaving the regime intact. When protesters express minimalist demands, the political space for government compromise increases.
The notions of high and low costs and maximalist and minimalist demands do not sufficiently differentiate between the types of costs imposed on the state by protests, nor do they account for the conditions under which the demands are expressed. There is no single protest attribute that defines the costs of a protest or determines the state's response. Yet current scholarship routinely conceptualizes costs as a homogeneous category where the “black box” of costs faced by the state structures its response. To unpack the “black box” we consider how disruption and concession costs define the state's response. We hypothesize that some costs, what we call concession costs, describe how “expensive” it is to accommodate demands. The demands and tactics that increase these costs can push to the core of the ruling coalition. Other costs, disruption costs, pose a greater challenge to economic stability and public order than to the foundation of the ruling elite.
We contend that disruption costs, which are a function of direct and indirect economic costs such as the disruption of business activities, are different from concession costs, which are the political costs imposed by protesters.Footnote 36 Conflating costs into a homogeneous category inhibits a nuanced understanding; disaggregating them provides important subtleties for understanding protest and government response dynamics.Footnote 37
The interplay between protest behaviors and state responses is part of a strategic process. In effect this is one phase of a domestic bargaining situation that others have used to model negotiations and the use of violence within the context of civil war.Footnote 38 Evidence suggests that political instability prior to war onset can generate external interventions.Footnote 39
The smallest of protests with the mildest of demands have less room for strategic maneuvering, but more highly organized protests with stronger demands have the ability to use the imposition of costs to bargain with the state. This is similar to the use of violence against civilians in a civil war as a strategic maneuver by rebels to increase the state's costs.Footnote 40 The logic that motivates this strategic use of costs to achieve outcomes is rooted in the bargaining literature. We think of protest behaviors as a stylized form of bargaining between protesters and their grievances and the state and its constituencies.
Protest demands, in the ideal, are clearly articulated such that a state responds based on complete and perfect information about the protesters, their intentions, and their capabilities. Under conditions of complete information, the parameters of a necessary bargain to avoid war would be known and the need for escalation minimized.Footnote 41 War is in the error termFootnote 42 and asymmetries of information often underlie bargaining situations. A miscalculation in the demand or the resolve to press it can account for bargaining breakdown and the resort to violence. We posit that this same liability exists between opposition protesters and the state, leading to inefficiencies in response patterns.
Protests are an initial step in a bargaining process that reveals information. Concession and disruption costs reflect a method for communicating commitment, resolve, and support to the government. In turn, governments respond based on the information and the preferences or expectations of their core constituency. Because the possible escalation to armed conflict is costly for both the state and opposition, bargaining through the imposition of concession and disruption costs and government response tactics is a process for gauging the tenacity with which each actor will press its claim. We argue that the structure of the costs imposed by protesters shapes the government's incentives for alternative responses.
When demands are unclear or resolve untested, protesters can adopt behaviors that increase disruption or concession costs and the state can respond with accommodation, deadly force, or some strategy in between. The state and the opposition evaluate their expectation for victory, negotiated outcome, or the continuation of the status quo based on the information revealed in the protest process. When concession and disruption costs are low the state has an incentive to disregard the protest because any response holds the possibility of increasing costs and risks future bargaining outcomes that are beyond current expectations. Low-cost protests can be “innocuous”Footnote 43 and dismissed or disregarded by the state because they generate minimal public nuisance and pose little threat to the status quo or regime stability.Footnote 44 As costs increase the most basic response by the state is to ensure public safety through various forms of crowd control. At a certain level we assume that all states have an obligation to ensure public safety and measures of crowd control provide this initial mechanism. But as costs escalate, there is a separation between concession and disruption costs that generates additional measures by the state. The state might still engage in crowd-control efforts, but it also increasingly uses accommodative or coercive measures, depending on the structure of the costs.
Central to our understanding of protests’ role in the bargaining process is the framework in which costs are imposed as a function of the protesters’ behaviors, which in turn generates a response by the state. We distinguish between three general response options by the state other than disregard, which we see as a baseline category: crowd control, accommodate, or repression. A government's incentives for each are framed in terms of the size of the concession and disruption costs.
Concession Costs
Conceptually, concession costs are defined as the actual or anticipated political costs from altering the status quo policy in response to protesters’ grievances. We posit that concession costs are a function of three components: (1) the protesters’ demand(s), (2) protester violence, and (3) the recurrence of demands. Violent protests levying recurrent maximalist demands impose the greatest concession costs, whereas nonviolent protests with new minimalist demands generate the lowest concession costs. These types of high concession costs were evident in Thailand and Ukraine in 2014: in Ukraine the government was overthrown by the protesters, in Thailand by a military coup.
When protests express minimalist demands, the government is more likely to accommodate because political survival is not threatened. If protesters levy maximalist demands—at the extreme we think in terms of high-level resignations or changes in political representation—governments are unlikely to concede. Maximalist demands force the ruling coalition to choose between catering to their core constituency and making concessions to another. Since both risk political survival, accommodating maximalist demands is unlikely. But by themselves, maximalist demands do not motivate coercion; it is in combination with demand recurrence and protester violence that the decision to repress protesters is motivated. Protesters increase concessions costs through the severity of their demands, willingness to use violence, and ability to mobilize around recurrent demands.
The recurrence of a specific demand demonstrates protesters’ resolve and commitment. By pressing the government with recurrent demands, protesters signal the importance of their grievance(s). Recurrent demands signal the legitimacy or widespread support of a grievance as multiple constituencies hold it.
Protester violence also assumes a role in defining concession costs. Because violence is expected to beget violence,Footnote 45 protesters who assume the risks of violent tactics demonstrate their willingness to sacrifice safety in pursuit of rectifying a grievance. Demands and violent tactics are independent conditions whereby minimalist demands can be expressed violently and maximalist demands can be expressed nonviolently.Footnote 46
Protester violence increases the future costs of retaining office. If protesters can motivate concessions through violence, then future protesters are encouraged to adopt violent tactics. Governments recognize this dynamic because nonviolent opposition campaigns are more successful in gaining concessions than violent opposition campaigns or terrorism.Footnote 47 We extend this logic to independent protest events; violent protests raise the concession costs making coercion a more likely response because conceding to demands in the face of violence can undermine a regime's ability to maintain authority and thus threatens political survival.
Concession costs pose a direct challenge to the ruling coalition, their privileges, and the distribution of public and private goods. The larger a required concession to meet opposition demands the more resources get shifted away from the ruling coalition. And the greater the protesters’ commitment to pressing those demands, the greater is the pressure on the ruling coalition to respond. As concession costs increase, accommodation is more costly and threatens a regime's political survival.Footnote 48 Therefore, high concession costs motivate a coercive response in an attempt to end the protest and maintain political survival. Conversely, low concession costs reduce motivations for the state to respond coercively.
In a perfectly informed strategic environment, protesters confront the choice of tempering concession costs to avoid coercive responses, yet in doing so they make their own concession in terms of demands or tactics.Footnote 49 With incomplete information—or asymmetric information—balancing demands, tactics, and responses is complex. If concession costs are too high, governments revert to coercion as a mechanism for political survival, but if concession costs are modest, governments are more likely to accommodate protester demands, ceteris paribus. We hypothesize that:
H1
When concession costs are high we are more likely to observe a state responding with coercion than accommodation in response to protest actions.
Disruption Costs
Conceptually, we define disruption costs as the actual or anticipated loss of economic activity or public order resulting from protests. Such costs are a function of (1) the location, (2) duration, and (3) size of a protest event. Disruption costs increase the security demands on the state and the liabilities on industries and commerce through the potential for temporary shutdown of markets. These costs are tangible, incur on an ongoing basis throughout a protest, and increase with a protest's duration.
When disruption costs are sufficiently high, the willingness of members of the state's constituency to support the government can be called into question. As the level of disruption begins to threaten the local, regional, or national economic viability and political stability, the state faces a choice between accommodation and coercion. High disruption costs might result from actions such as shutting down international transport or trade or blocking commerce in the central city through massive protests or occupation. We saw this in Thailand, Venezuela, Ukraine, and Hong Kong in 2014. In Thailand, Venezuela, and Ukraine the large protests were coupled with high concession costs. In Hong Kong the protest was disruptive but the concession costs were moderate. Outcomes and responses differed dramatically.
The economic impact of disruption costs is exemplified by the pro-democracy demonstrations in Hong Kong. Business owners reported dramatic declines in the flow of customers as protesters occupied the business district and blocked traffic creating a greater disruption to business than the SARS epidemic in 2003.Footnote 50 Contrasting this with the Occupy movement in the US provides a view of the impact of disruption costs. The Occupy movement was large (in terms of participants) and dispersed geographically, but protesters were generally in vacant lots provided by the targeted cities. Even the most visible encampment of that movement (in New York) took place in a park, out of the way of vehicular traffic with food and portable toilets provided by private supporters. In general, the larger the protest, the higher the disruption costs. But significant costs can be imposed through smaller protests in critical locations.
Accommodation is motivated by the direct costs protesters impose and by the associated impact these costs have on the general constituency. If protesters can amass in locations where business is interrupted or public order is impaired, governments are forced to consider the protesters’ grievances and the public's preference for order. Protests in deliberate locations, such as a confined downtown business district, generate new grievances among affected businesses, laborers, and consumers. Pressure mounts for governments to accommodate protesters when protests affect local populations uninvolved in the protest. High disruption costs motivate governments to accommodate protesters to restore order and avoid defection by members of the core constituency affected by the protest's negative externalities.
All protests create at least minimal disruption, but when protesters establish overnight or multiday events it magnifies their impact on business activities and public order. Concerns over lost revenue or daily interferences attributable to protests increase as protest duration increases. Occupying government buildings or establishing protest camps sustains pressure on governments to respond. The longer a protest's duration, the greater its ability to motivate elite defection, which challenges the regime's political survival.
Protest size reflects the level of popular support and is crucial for contesting government strength.Footnote 51 Power is in numbers so the ability to disrupt is partially reflected in the number of protesters. Greater participation increases economic and social disorder, at the extreme, leading to increasingly significant economic losses.Footnote 52
There can be high disruption costs when the demands do not require concessions that will directly challenge the viability of the ruling coalition. That is, disruption costs provide a distinct metric for calibrating the government's response. In the norm we expect protests that impose high disruption costs to generate an accommodative response by the state. If protesters can impose high disruption costs and minimal concession costs, the government has incentive to concede so authority can be maintained and public order restored. More generally we hypothesize that:
H2
When disruption costs are high we are more likely to observe a state responding with accommodation than coercion in response to protest actions.
Mixed Costs and State Responses
Disruption and concession costs fall along two somewhat exclusive dimensions and provide a set of observable and contrastable conditions. We recognize that these independent cost parameters can move in unison, but we see that as a function of protest behavior rather than necessarily linked conditions. That is, protesters can increase or decrease both disruption and concession costs simultaneously, sequentially, or independently. From this perspective, these cost parameters are conceptually distinct, but can be operationally convergent.
The size of the protest should increase the viability of the action but size, tactics, and demands are not necessarily reinforcing components. Smaller groups making severe demands engaged in violent protests can make it difficult for the state to forge an accommodating response. For example, in April 1995 in Bangladesh, approximately fifty members of the Jatiya Party, the Jamaat-e-Islami Party, and the Awami League engaged in a two-day strike in Dhaka demanding the removal of a political figure. The protest was small in size, but high cost in terms of the demand and the use of violence. Ultimately the government used coercive tactics in an attempt to restore order and did not concede to the demands.
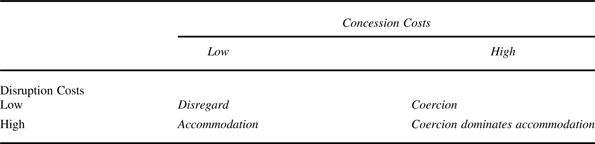
When both disruption and concession costs are high the state faces a dilemma in the choice of selecting how to respond to protester demands.Footnote 53 Large accommodations have the potential to break apart the coalition that forms the ruling elite, and therefore impose an incentive to respond coercively to the protest.Footnote 54 However, too much coercion may help mobilize a wider constituency for the opposition to participate in protests.Footnote 55 The state's objective is to provide the minimal concession that would defuse the protests but when demands push to the core of the ruling coalition the interaction among these costs makes accommodation too risky. Under conditions with high concession and high disruption costs, the ruling coalition faces considerable risk. The state might consider accommodation, but ultimately would resort to coercion because threats to the core constituency carry greater weight.
Conversely, when both disruption and concession costs are low the state has an incentive to marginalize the protest and protesters. A dominant strategy is to disregard the protest and let it play out without response. Disregarding protests is a calculated government decision because reacting in any fashion grants credibility and legitimacy to protesters and risks escalation and future mobilization.Footnote 56 Small protests over marginal issues generate participation in reaction to the state's response, leaving the state with an optimal strategy of disregarding the protest. In the bargaining process, low costs reveal information about the expected capabilities and resolve of the opposition. In protests where the opposition reveals its weak hand we expect the state to let the protest run its course without a state response. We hypothesize that:
H3
When both concession and disruption costs are high we are more likely to observe the state responding with coercion than accommodation in response to protest actions.
H4
When both concession and disruption costs are low we are more likely to observe the state disregarding protest actions.
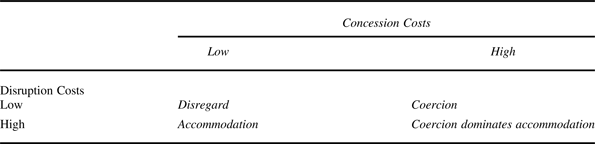
We represent our expectations of the relationship between costs and responses in Table 1.
Government response to cost components
Research Design
We test our hypotheses on the Mass Mobilization Data.Footnote 57 It records independent protest events, rather than campaigns, with at least fifty protesters within five regions of the world: Europe, North Africa and the Middle East, Asia, Africa, and the Americas.Footnote 58 The data are recorded from 1990 to 2014 in 161 countries for a total of 10,133 protest events in 3,640 country-years. The data indicate that 1,427 country-years (39.2%) are without protest. Our sample includes observations of protest events only. Since there cannot be a government response if there is no protest, the 1,427 country-years without a protest are excluded. Our sample reflects cultural differences, economic development, regime characteristics, and the potential for social discord.
Teams of researchers coded the data over the course of three years. The data build from the European Protest and Coercion Data.Footnote 59 Intercoder checking and team reviews were employed to ensure coding consistency and accuracy. The data set records protests that are directed at the state by internal groups and excludes non-state-directed protests, protests against foreign governments, and political rallies.Footnote 60 The fifty-protester threshold is sufficient to capture organized opposition making demands on the state and large enough to exclude idiosyncratic efforts by one or a few individuals. Our threshold is considerably lower than NAVCO 2.0,Footnote 61 therefore providing for greater sensitivity to the role of costs.
The data set records the dates of protests, the number of participants, the protest's duration, the geographic location (province/state and the city), the group identity of those organizing the protest, protester violence and demand(s), and state response(s) at the level of the country-event-day.Footnote 62 The data reflect a sample of specific independent protest events making the data set uniquely different from NAVCO 2.0 and other data sets recording opposition campaigns.Footnote 63
We rely on the demand(s) and response(s) variables, which are each coded on a seven-point nominal scale that reflects an aggregation of the European Protest and Coercion Data index of protest actions.Footnote 64 Protester demands include: (1) fiduciary issues such as price increases or tax policy, (2) social restrictions that impose on religion or culture, (3) labor or wage demands, (4) land tenure or farm issues, (5) police brutality, (6) constraints on political behavior or processes, such as democratic reforms or political access, and (7) corruption, resignation, or removal of reviled politicians. State responses include: (1) disregard,Footnote 65 (2) crowd dispersal, (3) arrests, (4) accommodation, (5) beating, (6) shooting, and (7) killing. Protesters can make multiple demands and the government can respond multiple ways. To account for this, the data set records up to four protester demands and up to seven state responses.
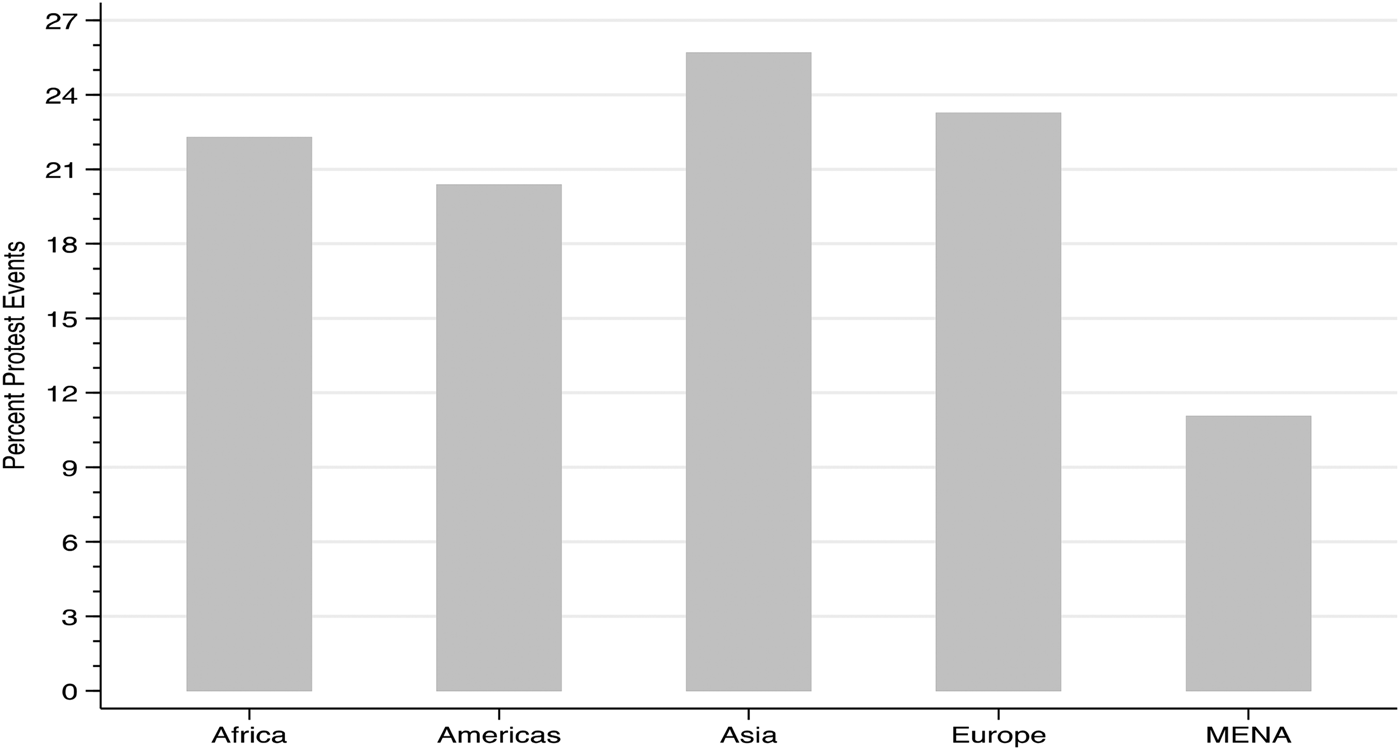
The distribution of protest events ranges from one protest in Qatar, South Sudan, and Switzerland to more than 200 protests in South Korea (321), Bangladesh (306), Thailand (212), China (206), and Venezuela (262) during the twenty-five-year period of observation, and in the United Kingdom (272) and Ireland (271) from 1999 to 2014. Seventeen countries had five or fewer protests and thirty-five countries had more than 100. Figure 1 plots the distribution of protest events and country-event data by geographic region.
Protest event distribution by geographic region

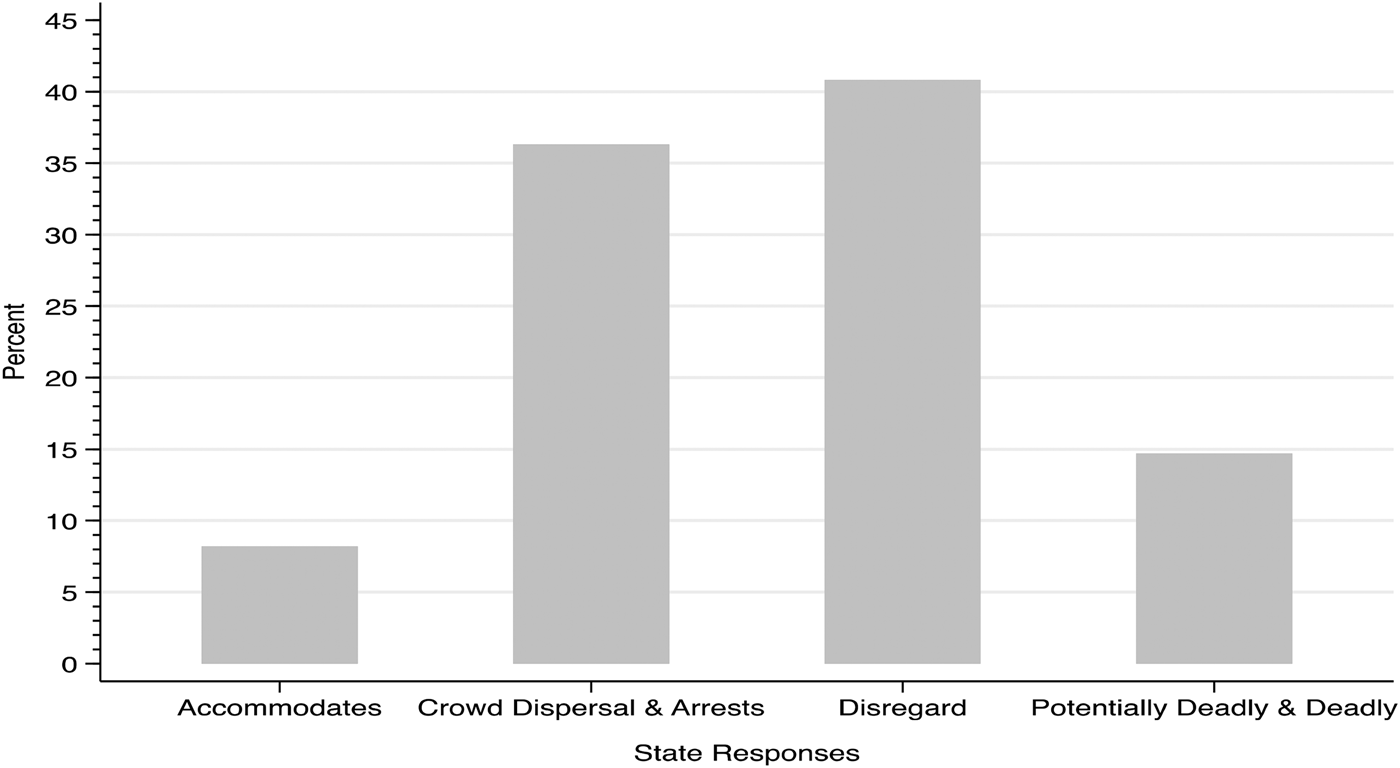
There are a total of 13,015 state responses recorded; Figure 2 plots the distribution. In 235 observations, or 2.3 percent of protests, there are more than three responses by the state. Disregard is the most common response.
Distribution of state responses

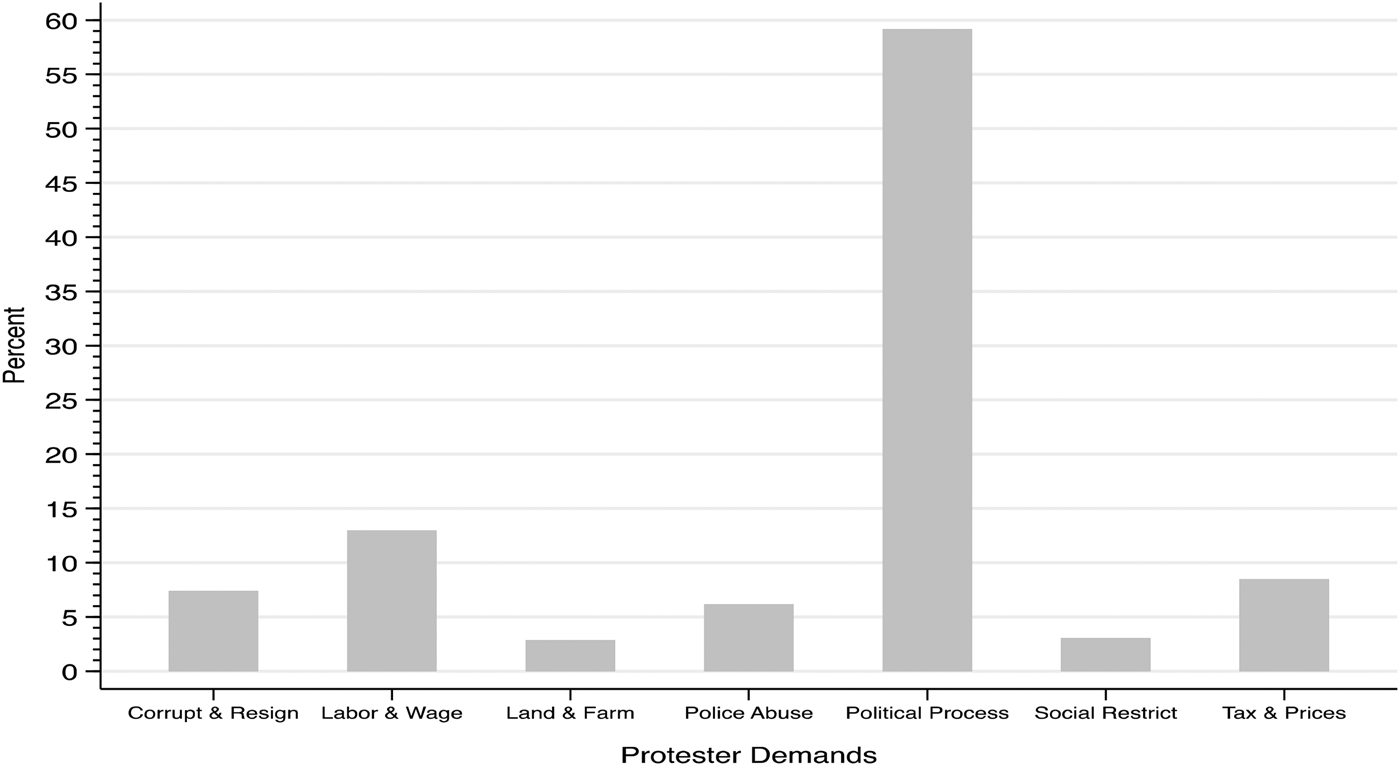
Protesters can levy multiple demands per protest event. The data record a total of 11,803 protester demands; 1,457 record two, 213 record three, and eleven record four demands. Figure 3 plots the distribution. The most frequent demand invokes reforms to the political process. Policy abuses and political corruption are the core of roughly one in eight protest events.
Distribution of protester demands

The majority of protests (approximately 83.9 percent) are one-day events, while approximately 26.6 percent of multiday protests last for more than one week. Roughly 28 percent of all protests include violence by protesters. The number of participants per protest varies from 50 to 7,000,000; the mean number of participants is 16,195. The modal size is 100 participants, and the fiftieth percentile is 400 participants; 90 percent of the protest events record 10,300 or fewer participants.Footnote 66
Predictor Variables
Disruption and concession costs are operationalized as the extent to which the characteristics of the protest, the protesters, and their demands impose political, economic, and social costs on the state. We rely on the protest event data we described to build our measures of concession and disruption costs.
The disruption costs index is an additive function of (1) the protest location, (2) the duration of a protest event, and (3) protest size. Each component is expected to influence the economic impact and shift the level of public disorder attributable to a protest event.
We operationalize protest size as categorical levels of participation. To generate the categories, we implement Tukey's ladder of powersFootnote 67 and empirically identify three “cut points” at which the slope or inflection point(s) of the respected curve changes and are evident in various assumptions about the functional form. Correspondingly, we use “cut points” at 100, 1,000, and 10,000 protesters creating an ordinal scale of protest size ranging from 0 to 3, with 0 reflecting protests between 50 and 99 participants.
Across the data, 83.9 percent of the protests last for one day, but if a protest extends beyond one day, 11.8 percent end within one week and the remaining 4.3 percent of protest events last from 8 to 939 days. We categorize duration by day, week, or longer with day-long protests assigned a 0, more than a day and up to a week assigned a 1, and greater than a week a 2. We do this to avoid the nonlinearity in our index.Footnote 68
Protest location is recorded on an ordinal scale ranging from 1 to 4. We assume that disruption costs are greater as the political or economic significance of the protest's location increases. Disruptions to public order and economic activity are greater in urban locations than isolated non-urban settings, and greatest when protests are nationwide. Operationally, protest location is assigned a value of 1 for non-urban settings, 2 for urban settings, 3 if it takes place in the capital, and 4 if the protest is nationwide. For protests not in a country's capital, we determine non-urban versus urban by the location's population; communities with fewer than 50,000 people are considered non-urban. A majority of protest events (56%) in our sample occur in the country's capital.
We combine the three component parts to create a disruption costs index. The index ranges from 1 to 9 with a mode of 4, a mean of 4.32, and a standard deviation of 1.48. An index value of 1 indicates a one-day, non-urban protest with fewer than 100 participants; an index value of 9 indicates a protest lasting longer than one week, nationwide, with at least 10,000 participants. The index allows for diversity in how protesters can generate disruption costs. A one-day, urban protest with 1,000 participants creates a disruption cost similar to a one-day protest in the capital with 500 participants. Or a five-day, non-urban protest with 2,500 participants produces disruption similar to a small (200 participants), one-day protest in the capital. An example is the 2008 protests by Spanish fishermen and farmers. Although mostly rural, it was a nationwide campaign creating significant disruption costs without having to occupy the capital; these protests were relatively small (under 1,000 participants), but were multiday and nationwide, creating a disruption costs index value of 6.
Concession costs index is an additive function of (1) the protesters’ demand(s), (2) protester violence, and (3) a recurrent demand(s). The first component is an ordinal scale measuring the protesters’ demand(s). Protesters make a variety of demands; some challenge the regime's distribution of private benefits while others are aimed at changing or expanding the provision of public goods and policies. We consider demands to be high, medium, or low threat to the government coalition. When protesters articulate multiple demands, we consider up to three and use the highest-order demand when generating our scale.
When protesters’ demands involve price or tax policy, social restrictions, labor or wage policy, or land and farm policy, we consider the demands to be low threat and assign a value of 1. We assign a value of 2 to demand type when protesters’ demands challenge the political process, police brutality, or arbitrary actions by the government. When protesters demand the resignation or removal of government officials, we consider this to be high threat and assign a value of 3 to demand type. Just over 20 percent (20.8) of protests are low threat, 70.6 percent are medium threat, and 8.6 percent are high threat.
The second component is demand recurrence. If protesters press the same demand against the government in subsequent protest actions we consider the cumulative effect.Footnote 69 We code recurrent demand as a dichotomous measure of whether the observed protest event presents the same demand as the immediately previous protest event. When the previous protest and the current protest have the same demand, recurrent demand is assigned a value of 1; 0 otherwise. Almost 60 percent (59.5) of protests have a recurrent demand.
The final component is a dichotomous indicator of protester violence. Violence is expected to increase the costs of conceding to the opposition because it creates an incentive for future protesters to revert to violence. When protesters use violence we assign a value of 1; 0 otherwise. Twenty-eight percent of protests are violent.
We combine the three component parts to create our concession costs index. The index ranges from 1 to 5. The modal value is 3, with a mean of 2.76 and a standard deviation of 0.92. The index allows for diversity in how protesters generate concession costs. When protesters initiate a new, nonviolent, high-threat demand event, the concession costs index assumes a value of 3. Alternatively, a violent protest involving a recurrent, low-threat demand also generates a concession costs index value of 3. By way of example, in May 2014 in the Central African Republic protesters pressed a recurrent demand against corrupt leadership calling for resignation but they remained nonviolent (concession costs index = 4). By contrast protesters in September 2009 in Chile also generated a concession costs index of 4 through a violent, recurrent, medium-threat demand (political process and behavior). In both instances the government responded by killing protesters.
Recursive Relationships
The relationship between protest costs and government response could be the result of a strategic interaction that precedes a current protest event. In this sense, history would be a driving force for developing current expectations. If we were analyzing protest campaigns or sustained social movements against the government, decision making in the present is likely to reflect a strategic process influenced by the past. In independent protests, protest costs and government response may be spurred by similar strategic dynamics. We explore this potential recursive relationship in a series of regression models in which we alternatively implement lagged cost indices and government response(s), lagged individual cost indices components, and test the effect of government response(s) and protest costs at time t-1 on government response and protest costs at time t, respectively. The results are included in appendix Tables A2–A12 and Figure A1. Across alternative model specifications and empirically tested causal relationships, a strategic interaction between previous government and current protester behaviors or previous protester and current government behaviors does not affect our results.
Research indicates that violence begets violence. This becomes a recursive relationship if previous violence leads to present violence, which leads to higher concession costs increasing the incentive for government coercion, which in turn motivates future protest violence. This is to some extent a theoretical question addressed in the literature,Footnote 70 but also an empirical one if it influences our concession cost index construction and ultimately our empirical results.
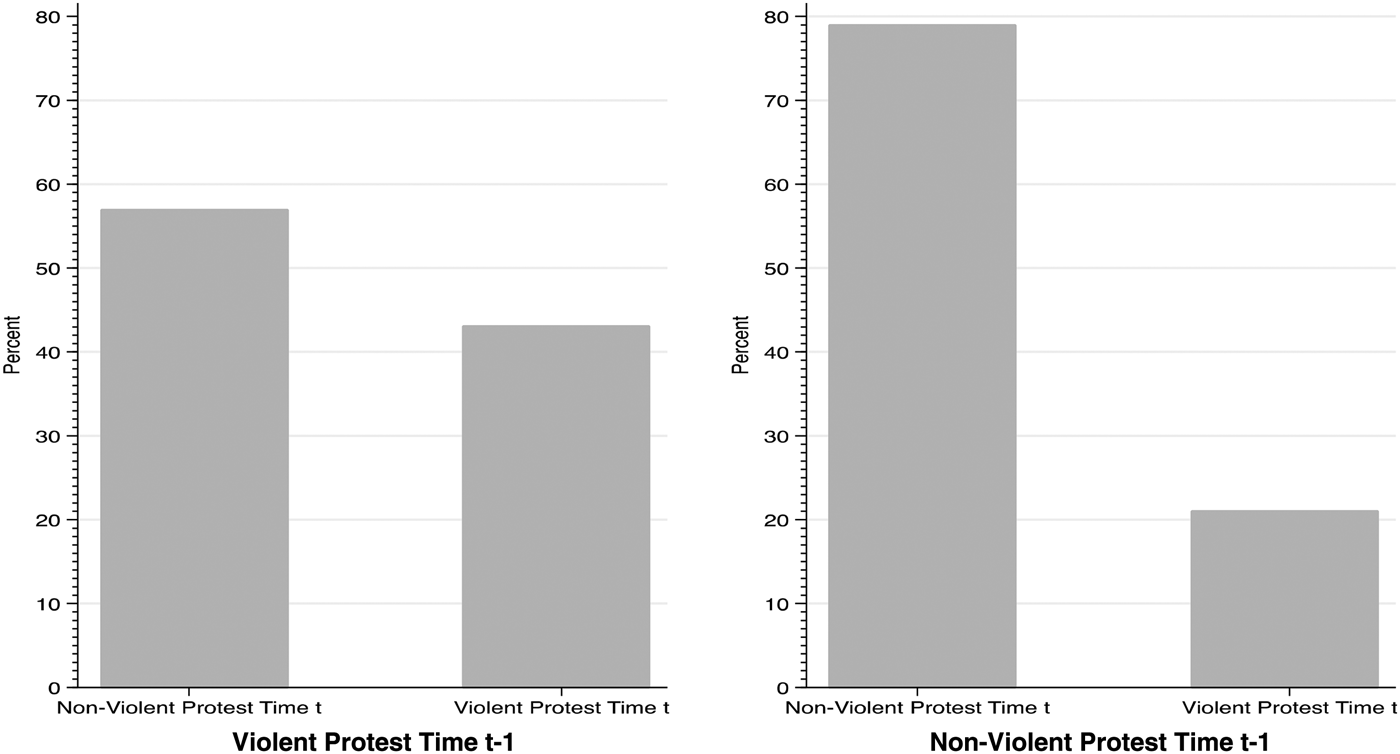
Figure 4 represents the distribution of protest violence at time t contingent on protest violence at time t-1. Protest violence at time t and time t-1 are correlated at 0.224. The plot on the left shows that over 50 percent of the violent protests at t-1 use violence in the subsequent protest action. This is far from a “violence necessarily generates violence” relationship.
Protest violence by previous protest violence at time t-1

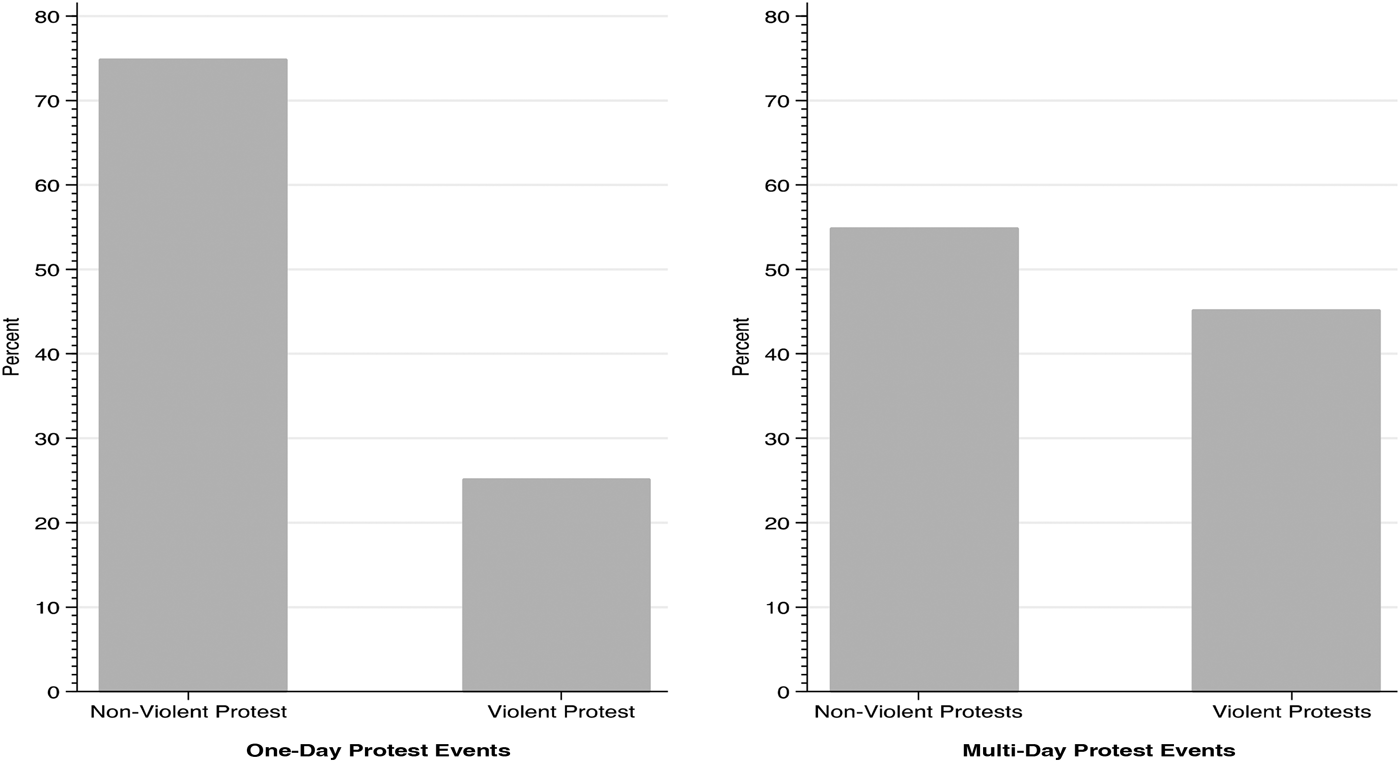
Because multiday events may increase media-reporting opportunities or attract more committed or extreme agitators, protest violence could be more frequent in multiday than one-day events. Figure 5 confirms this but the correlation between protest duration and protest violence is only 0.025. In the data, it does not appear that violence is closely tied to protest duration in a systematic way (see Figure 5 and appendix Tables A5–A11).
Protest violence by protest duration

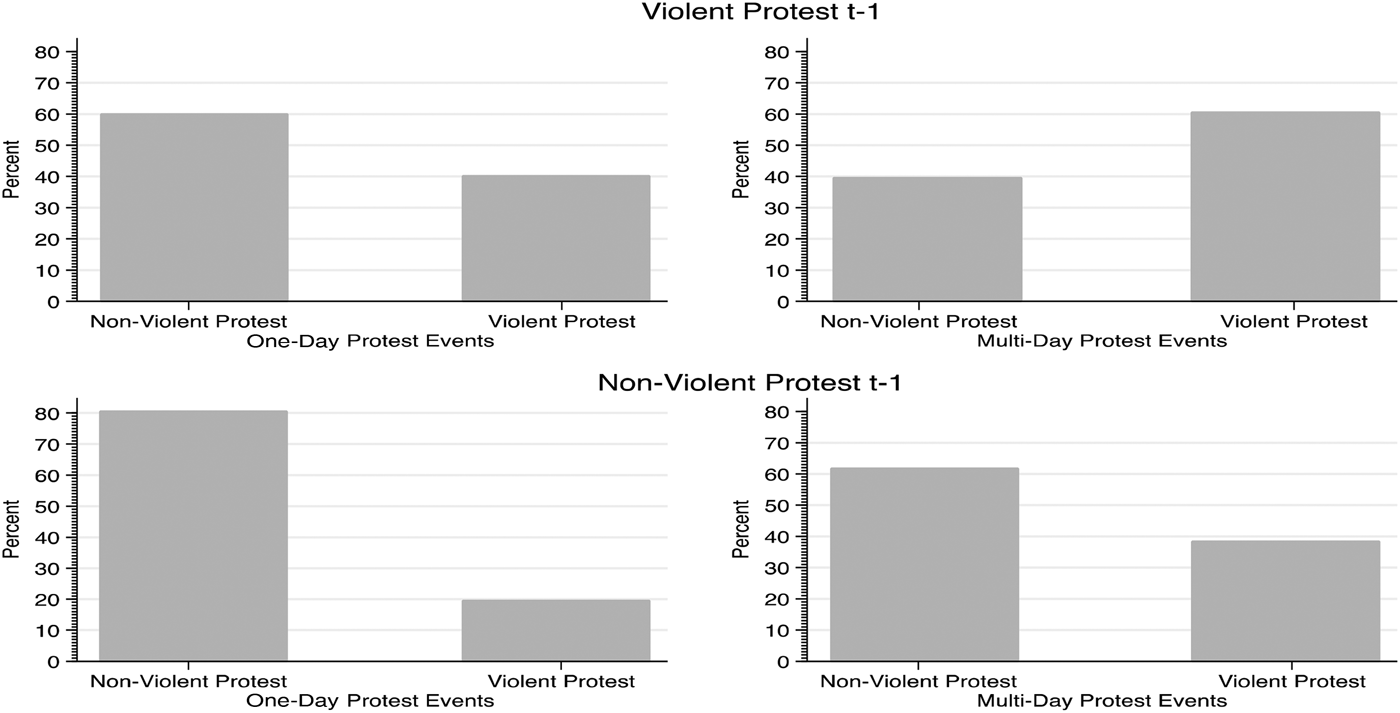
In Figure 6 we compare the distribution of violent protests across previous violence and duration—the top row contains violent protests at time t-1 whereas the bottom row is nonviolent protests at time t-1. We can see clearly from the top-right plot that violence is most common in multiday protests when the previous protest was violent. None of the measures are strongly correlated though; in fact, protest duration and previous violence are negatively correlated at -0.002. When we test distinct government responses at time t-1 we do not find evidence in our data that government coercion at time t-1 generates protest violence at time t (see appendix).
Protest violence by previous violence at time t-1 and protest duration

Indices Functional Form
Our indices are based on a functional form that specifies a linear, nonweighted relationship among its components. We accept that this comes with assumptions and implications, but in our consideration of various functional forms, this held to the strongest rationale across alternatives. One alternative specification is a multiplicative functional form, in effect providing a “veto” for some components of the indices. In either index where one component is absent or below the necessary threshold value, the index for that protest event is 0. We find this to be inconsistent with our theoretical argument because all protests create at least minimal disruption and concession costs.
We could weight the components by our expectations of the relative contribution of each to the dynamics of the process we seek to model. The possibility for consequential error here is too high by our standards; we would have to rely on either a mechanical weighting or our speculation as to weights, which might border on the arbitrary. The impact of different decisions is demonstrated in appendix Tables A13–18.
Because of the extreme variation in the implications of our alternative indices we present our analysis based on the form we can most readily justify—an additive, linear, nonweighted relationship among the components. We use Cronbach's alphaFootnote 71 to assess the internal consistency of both indices; the alpha scores (0.70) indicate a robust level of internal consistency.
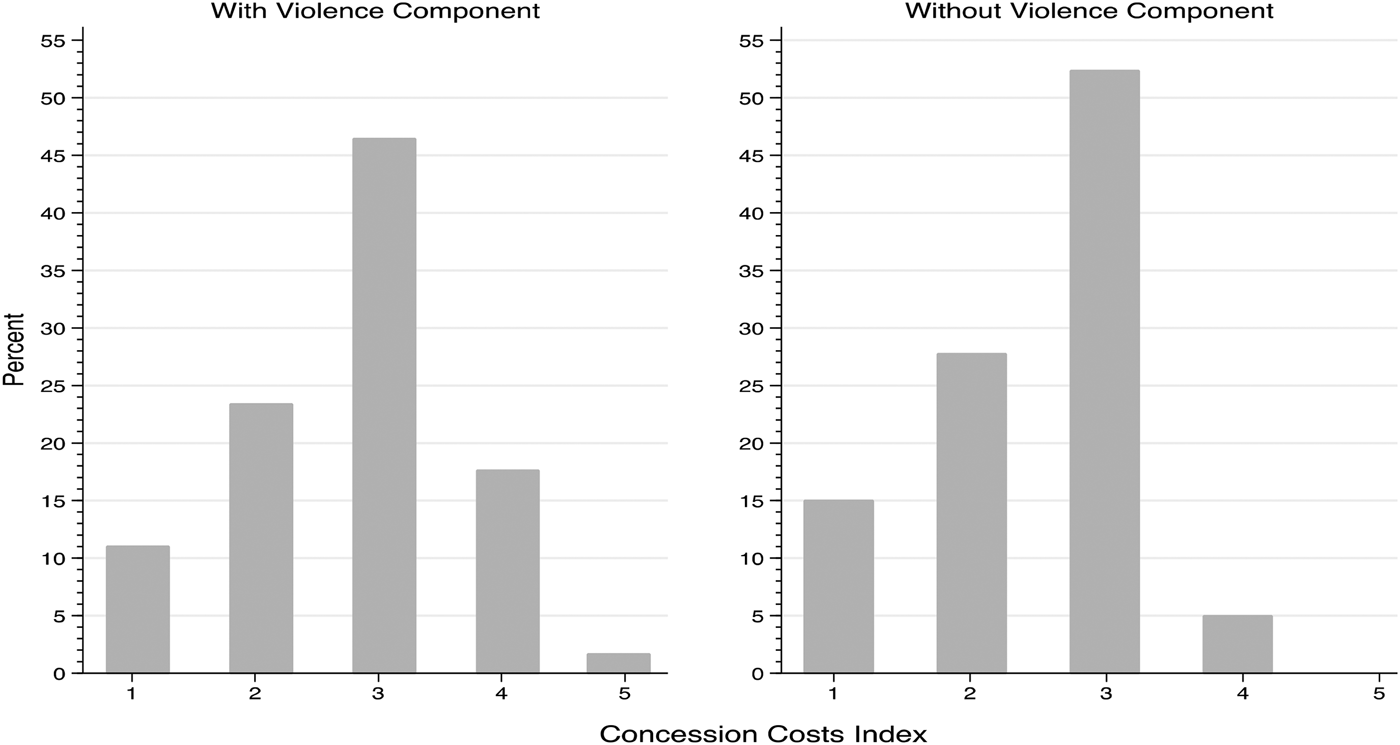
The construction of the concession costs index does not require protest violence to generate high concession costs. If protest violence is omitted, we observe a shift in the range while the distribution of values remains stable. In appendix Table A18 we detail alternative specifications. To better visualize the shift in range and not distribution, we present histograms of these two different concession cost index specifications in Figure 7; the indices are highly correlated at 0.874.
Violence and the range and distribution of alternative concession cost index specifications

Dependent Variable
We develop a categorical variable, state response for estimating the effect of the protest costs on state response; it is derived from the data described earlier. To create state response, we assign a value based upon the highest level of government response; we categorize responses as disregard, crowd control, accommodation, and coercion (disregard = 0, crowd control = 1, accommodation = 2, coercion = 3). Coercion includes beating, shooting, or killing protesters. Accommodation reflects state concessions to demands, and crowd control includes arrests and dispersal tactics. In our sample, there are 1,433 instances of coercion, 920 instances of accommodation, 2,655 of crowd control, and 5,096 instances where the government disregarded the protesters.
To observe a state response, there must be a protest; therefore, we estimate the effect of costs on event data. Similar to any event data analysis, we face a selection problem in that there is a greater likelihood of protests in certain countries in our sample than others.Footnote 72 We do not purport to resolve this common problem. Instead we analyze relationships between protest behavior and state response, not the occurrence of protests so our inferences are therefore restricted to conditions where there are observed protests. This assumes a form of independence from the conditions that account for when protests happen. While we see this as a potential threat to inference, it is so only at the margins and the core relationships we observe are robust. Our data account for regimes that are autocratic and repressive, democratic and inclusive, and varied combinations of institutions and norms between these extremes. A theory and evidence of state response in light of a theory of protest should serve as a guidepost for further research and is consistent with thinking about microlevel conditions, indicators, and interactions between protests and state responses that shape future collective action and even the escalation to civil war.
Control Variables
We use four control variables: polity and polity squared,Footnote 73 the size of the economy in constant 2005 US dollars as measured by the natural log of gdp per capita,Footnote 74 and the country's youth bulgeFootnote 75 population measured as the ratio of fifteen- to twenty-four-year-olds to the total population. The control variables influence both the outcome variable and the conditions for observing protests.Footnote 76 Summary statistics are in appendix Table A19.
Estimation Techniques
The costs raised by protesters have a direct effect on the state's response. Since state response is a categorical outcome, we use a multinomial logit estimator with robust standard errors clustered by country to test our hypotheses. We assume that a state leader is concurrently choosing between our four response types—by estimating simultaneous binary logit regressions for each response type, the multinomial logit model resembles a state leader's selection process.Footnote 77
Because our cost indices are measured at an event level and our control variables are measured at a country-year level of observation, we employ alternative model specifications to isolate incident-level measures from country-year level variables. To test the effect of disruption and concession costs using only event-level variables we create two event-level control variables: number of demands and previous violence. Number of demands is a count of how many protester demands (up to three) are originally recorded in the Mass Mobilization Data. The more demands protesters make, the state may find it more challenging to accommodate, or may pick one of the multiple demands to accommodate in hopes of appeasing a portion of protesters. Previous violence is assigned a value of 1 if either or both of the two previous protest events included violent tactics by protesters.
We test our expectations on regression models that account for incident-specific and country-year control variables. This provides event-specific and country-contextual factors that affect both protests and state response.
Our modeling choice assumes independence of irrelevant alternatives (IIA). A Hausman Base test is inefficient because our data fail to meet asymptotic assumptions; we rely on seemingly unrelated estimations using standard errors clustered by country to test the IIA assumption. In the analysis utilizing event-specific and country-context control variables, the test statistic is not significant; our model selection does not violate IIA.Footnote 78
Results
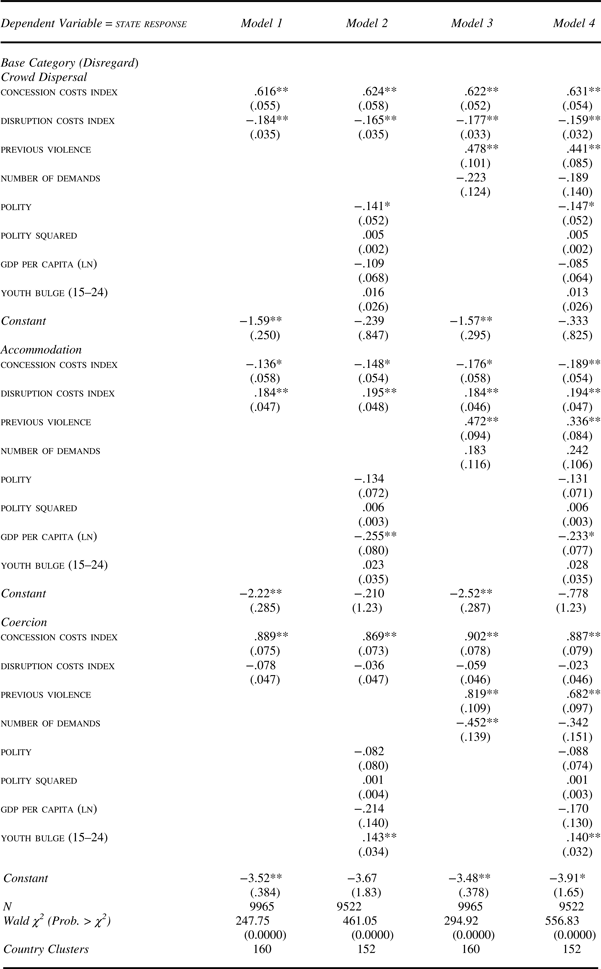
The state response models estimate the probability a government selects crowd control, accommodation, or coercion of protesters relative to the base category of disregard. We find support for all four hypotheses (Table 2). The models demonstrate that government response to protests is influenced by the disruption and concession costs. These results are not trivial. Since the state has access to any response choice, the systematic relationship between costs parameters and state responses demonstrates that the state takes into account how and why the protesters are mobilizing.
Multinomial logit regression results
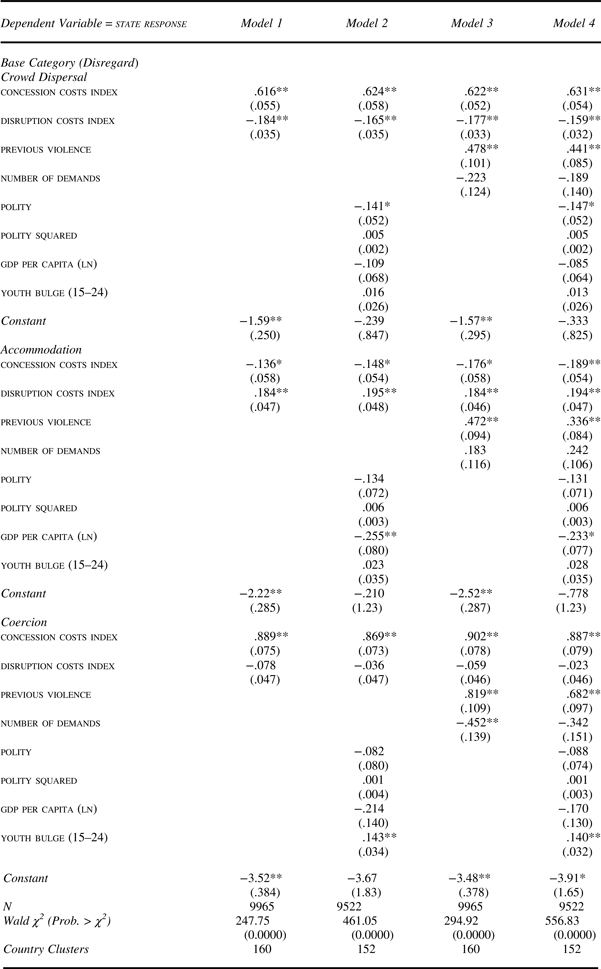
Notes: Robust standard errors in parentheses clustered by country. Two-tailed significance tests. *p ≤ .05; **p ≤ .01; ***p ≤ .001.
We start by evaluating hypotheses 1 and 2. Consistent with H1, as concession costs increase, on average, the predicted probability of coercion increases. Supporting H2, if protesters create high disruption costs, on average, the likelihood of accommodation increases. Model 1 includes only the disruption and concession cost indices. We add country-context control variables in model 2 and in model 3 we include only event-level control variables; in model 4, we combine both types of control variables. In model 5, to minimize the threat of modeling attenuated links between previous protests and current protests, we drop previous violence because it relates to protests at time t-1. Across all model specifications our hypotheses are supported. The statistical significance of disruption costs on a coercive response varies across model specification and our argument suggests this variance is consistent with our expectations. Coercion is primarily motivated by concession costs. In the simplest form of our model (model 1), disruption costs play a significant, yet small role in reducing the likelihood of a coercive response. In more complete specifications, while remaining negative, it falls out of significance. This suggests that variation in contextual conditions account for the strength of the relationship.
Based on model 2, our results demonstrate that in the cross-section, the predicted probability of accommodation increases when governments are faced with high disruption costs and low concession costs. On average, the predicted probability of a coercive response to protests increases when governments are faced with high concession costs. This is consistent with research connecting violent dissent and state repression.Footnote 79 In model 3, our hypotheses are also supported. The predicted probability of accommodation increases when disruption costs are high and concession costs are low. As expected, when concession costs are high, a coercive response is predicted to increase. In model 4 high disruption costs and low concession costs have a positive effect on accommodation, and high concession costs have a positive effect on a coercive response by the government. Previous violence increases the probability of coercion (model 4), yet even when violence is removed as a component of the concession costs index, increasing concession costs continue to be associated with the state's decision to coerce or accommodate.
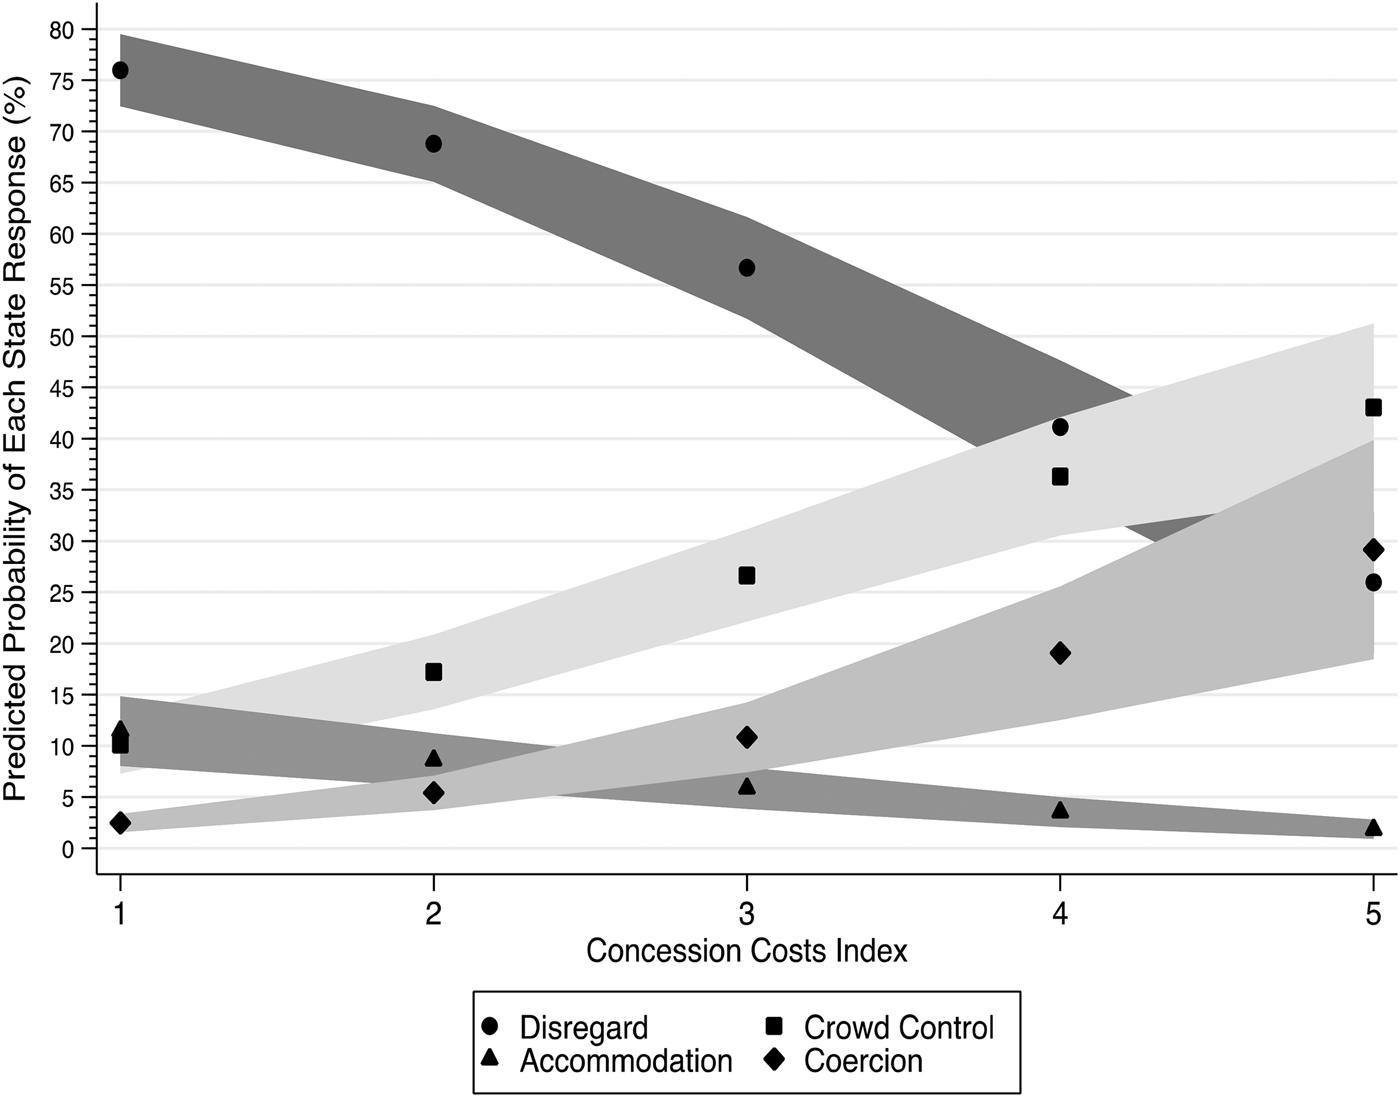
Figure 8, based on model 4, illustrates that as concession costs increase, while holding disruption costs constant at the mode, the predicted probability of accommodation decreases, whereas the predicted probability of coercion increases. We rely on the point estimates to interpret the effects and include the confidence interval curves to better visualize trends in response across increasing concession costs index. As concession costs index increases to the maximum value, the predicted probability of coercion and crowd control increase to approximately 29 and 43 percent, respectively, and the predicted probability of disregard decreases to approximately 26 percent. When concession costs reach a value of 4 or greater, approximately 19 percent of observations, there is a statistically significant difference between coercion and accommodation. Coercion is the predicted response in the cross-national sample.
Predicted probability of state response across concession costs index (95% CIs)

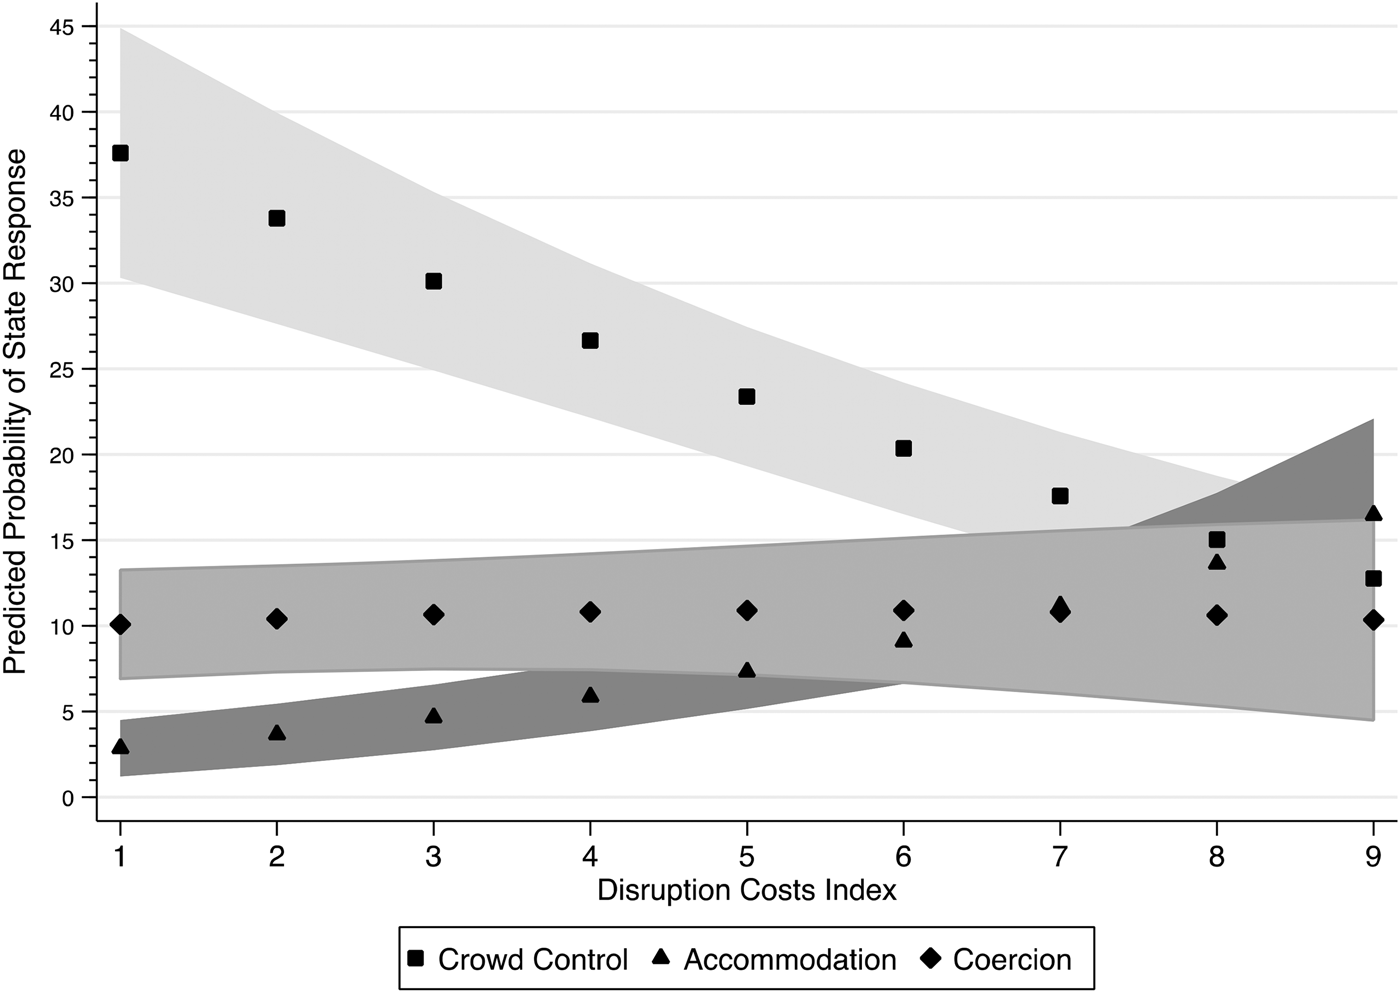
Figure 9 (model 4) depicts the effect of increasing disruption costs while keeping concession costs constant at the mode. We exclude estimates for disregard because they remain stable at approximately 50 percent predicted probability. The predicted probability of coercion remains consistently low across increasing disruption costs but, importantly, the predicted probability of accommodation increases with increasing disruption costs. On average in the cross-national sample, coercion is predicted over accommodation when the disruption costs are low, but as disruption costs increase from 1 to 4, the predicted probability of accommodation doubles from approximately 3 to 6 percent. When protesters are capable of creating high disruption costs (>6), the predicted probability of accommodation increases to 17 percent. We recognize that Figure 9 shows there is ambiguity about which response protesters motivate.
Predicted probability of state response across disruption costs index (95% CIs)

Although the confidence intervals overlap, the results suggest that when disruption costs are very high (=9), accommodation is more likely than coercion or crowd dispersal. The results suggest that government accommodation to protests is a positive function of disruption costs. Crowd dispersal is predicted to decrease as disruption costs increase. Perhaps this is a function of protest size. While disregard is the common state response, protesters can motivate the state to consider accommodation by imposing high disruption costs.
To better understand the independent effect of each cost index, we set the two indices to specific values and generate predicted probability. This helps demonstrate the validity of all four hypotheses. In support of H1, if protesters generate low concession (1) and disruption costs (1), the model predicts coercion 2.6 percent and accommodation 6.3 percent of the time. The predicted probability of coercion increases to 24.6 percent when concession costs increase to the maximum (5) and disruption costs remains low (1); the probability of accommodation in this scenario declines to 0.9 percent. If protesters push concession costs to the maximum and maintain average disruption costs (4), coercion is predicted in 29.3 percent and accommodation in 1.8 percent of protest events.
When protests generate high disruption costs while minimizing concession costs, the predicted probability of accommodation increases. For example, when disruption costs are high (9) and concession costs low (1), the predicted probability of accommodation is 26.7 percent, whereas coercion is 2 percent. When disruption costs remain high and concession costs are average (3), the predicted probabilities of accommodation and coercion shift to 10.4 and 16.5 percent, respectively. This supports H2.
To test hypotheses 3 and 4, we set concession and disruption costs to their highest and lowest values and compare the predicted probabilities. When both costs are high, we expect coercion (hypothesis 3); the results support our expectation. On average, cross-nationally, the predicted probability of coercion is 14.2 percent. When both cost indices are high, the predicted probability of coercion is 34.3 percent—a statistically significant increase (95% confidence interval is 16.1 to 52.5%). Moreover, the predicted probabilities of disregard, accommodate, and crowd dispersal change to 34.0, 6.3, and 25.4 percent respectively whereas, on average, the predicted probability of each response is 50.4, 9.1, and 26.3 percent, respectively. These results suggest that when both indices are high, the state has incentive to coerce protesters.
When both costs are low, we expect the state to disregard (hypothesis 4); the predicted probability supports our expectation. On average, cross-nationally, 50.4 percent of protests are disregarded but when both costs are low predicted probability of disregard increases to 75 percent (95% confidence interval is 69.6 to 80.4%). Subsequently, in a low-cost protest, the predicted probability of coercion is 2.6 percent, accommodation 6.3 percent, and crowd dispersal 16.1 percent. In sum, variation in the cost parameters predicts shifts in government responses that reflect our theoretical expectations.
Robustness to Model Specification
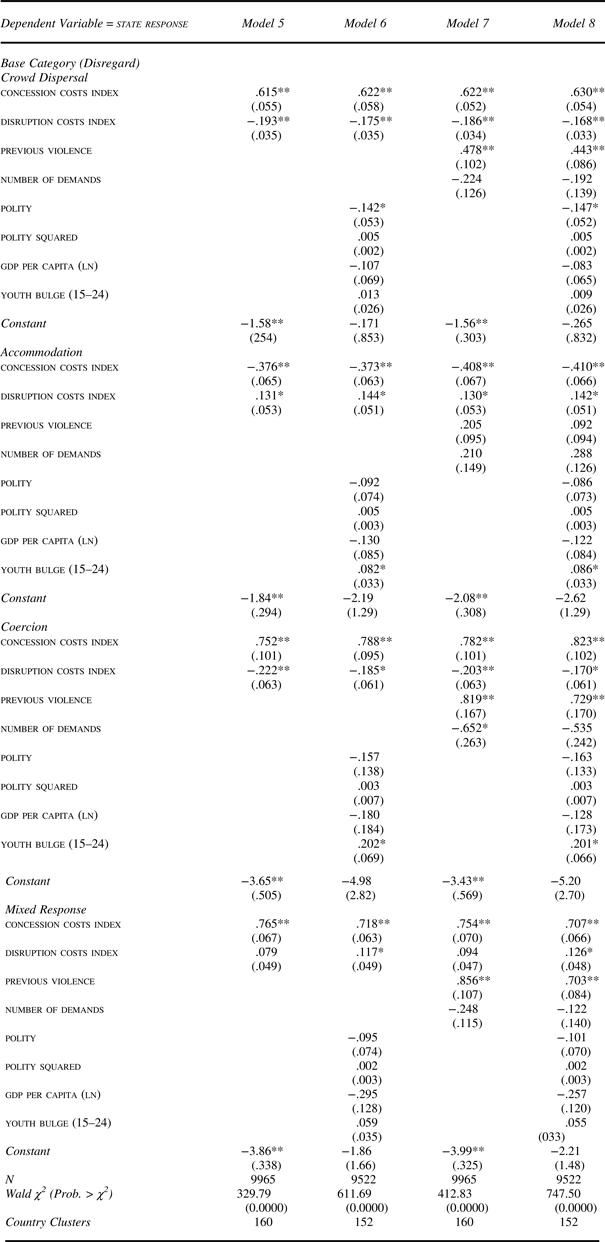
We engage in multiple robustness checks. The state-response categories we employ in the main models are not exclusive categories because a government can accommodate and repress the same protest. Sometimes when repression fails to quell and instead swells the number of protesters, governments try accommodation. Typically, when there are multiple government actions, they fall within the same type we use to generate state response; that is, the state beats and shoots, or arrests and disperses protesters. In 1,362 protest events, approximately 13.5 percent of observations, the state responds with a mixed strategy—that is, crowd control and coercion, crowd control and accommodation, accommodation and coercion, disregard and any other response, or a combination of any three or four response categories. We recode our dependent variable to include an additional category of a mixed response changing the distribution of observations to approximately 50.4 percent disregard, 25.7 percent crowd control, 5.9 percent accommodation, 4.5 percent coercion, and 13.5 percent mixed response. Empirical results testing this specification are consistent with our primary models (see Table 3).
Multinomial logit regression results, mixed response category included
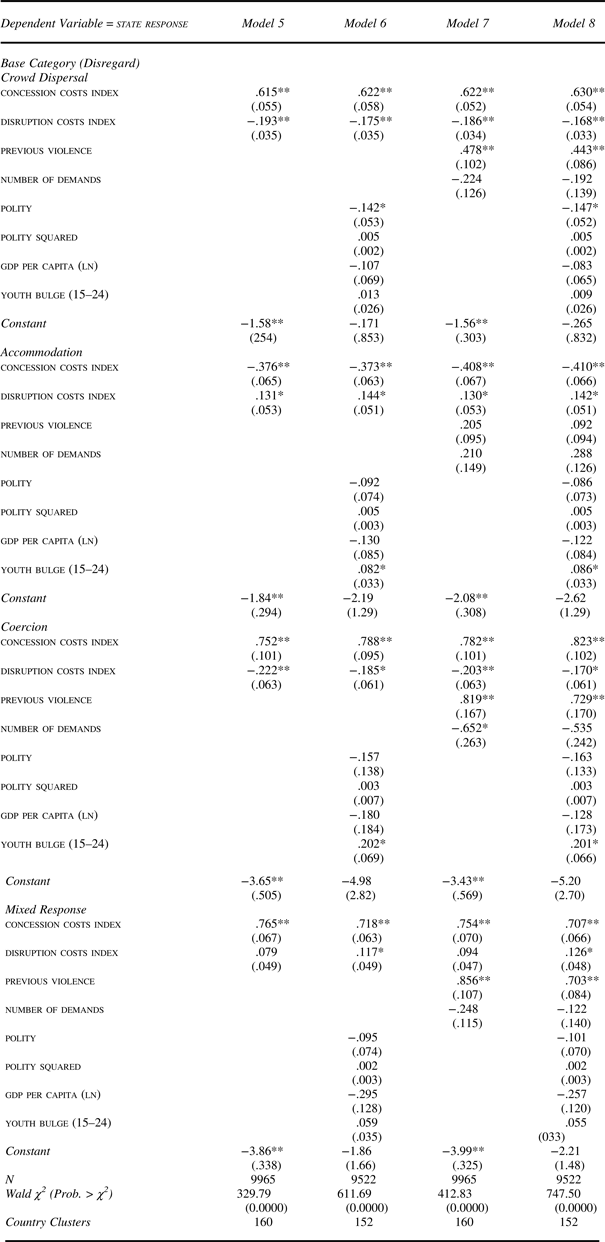
Notes: Robust standard errors in parentheses clustered by country. Two-tailed significance tests. *p ≤ .05; **p ≤ .01; ***p ≤ .001.
In Table 3, disruption costs continue to be negatively associated with coercion, but are now consistently significant. The consequence of including a mixed response is that we implement a stricter measurement interpretation of coercion and these results reinforce our expectations. That is, high disruption costs motivate accommodation, not coercion.
In the mixed-response category, disruption costs produce a positive effect. This is consistent with our expectation that ambiguity prevails when both costs are high and concession costs dominate the state's response. The positive effect of disruption costs is likely linked to the accommodative component of the mixed response, but the relatively large substantive differences between the concession costs and disruption costs coefficients suggests that, as expected, concession costs carry much of the explanatory weight.
There is a risk to our analysis that protesters “learn.” That is, protesters today learned how previous protests elicited varying state responses. This assumption may cloud the effect of relationships between costs and state responses. To test this, we split our sample into two groups, same protester identity—where protests at time t and time t-1 are coordinated by the same organization or class of dissidents (i.e., students, workers, farmers)—and different protester identity—where the protests are (assumed to be) distinct and uncoordinated with the temporally previous protest. This is a rough cut, but it does help clarify and potentially delineate a “learning” link. We rerun the model using this split sample. The results continue to support our main analysis. See appendix Table A23.
Next we remove corruption, removal, or resignation as a demand from the Concession Costs Index and include it instead in our models as a control variable. Since it is assumed to be the most threatening demand, we estimate the independent effect.Footnote 80 Corruption demand assumes a value of 1 when protesters air grievances over corruption or demand the resignation or removal of a high-level official, and assumes a value of 0 for all other demands. We also remove the protester violence component of the Concession Costs Index and include a binary measure of protester violence; violent protests are assigned a value of 1. Together, previous violence and protester violence account for action-reaction dynamics and the effect of nonviolent events on the probability of coercion and accommodation respectively.Footnote 81 See appendix Table A24.
When we remove violent protest tactics from the Concession Costs Index (model A62), the index continues to have a positive effect on coercion. Although protester violence begets state violence, action-reaction dynamics are not the only determinant of a coercive state response. Once a corruption demand is removed from the Concession Costs Index (model A63), while this specific demand generates coercion, increases in the Concession Costs Index continue to have a positive effect on coercion and a negative effect on accommodation. When these components are tested independently (model A64), the expected effects of the disruption costs index and concession costs index remain.
We recognize that there is significant variation in institutional and cultural norms across the countries in our sample and that the battery of control variables may not fully capture these differences. In the main analysis, we cluster standard errors by country, which provides a means of accounting for this potential threat to the generalizability of our results. We conduct a fixed-effects multinomial logit regression analysis using country-panels as an alternative method to account for cross-country intrasample variation in country's baseline probability of protest responses. A fixed-effects model is effective for modeling heterogeneity across the sample. It is also a valid method for showing within-country effects of protest costs. The results from a fixed-effects model allow us to draw stronger inferences about within-country outcomes; that is, within a country, variation in a protest's disruption and concession costs results in changes in government response.
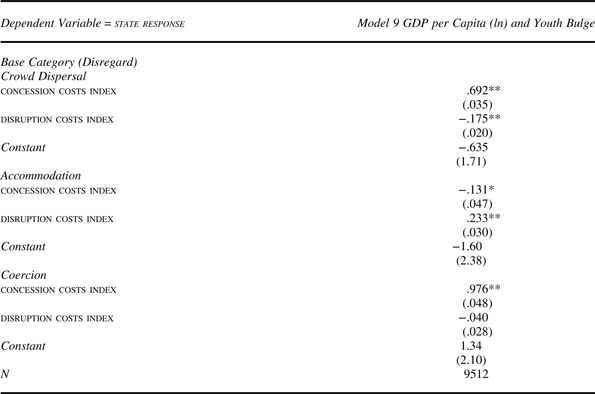
The model requires manipulation of observations to generate convergence. In the country-panels, the number of protests range from 1 to 317; country-panels with less than three protests had to be dropped to generate convergence (Bhutan, Cape Verde, Eritrea, Jamaica, Laos, and Qatar are dropped). The results continue to support the results and implications generated by our main models. Table 4 presents the coefficient estimates for disruption and concession costs on each response choice; appendix Table A31 presents the full results. Both disruption and concession costs play an influential role in determining the state's response to protests. In model 9, once country-panel effects are directly accounted for and modeled, in support of our expectations, escalating concession costs decrease the predicted probability of accommodation by approximately 12 percent and increase the predicted probability of coercion by approximately 165 percent. Escalating disruption costs are predicted to increase accommodation by approximately 26 percent.
Fixed effects multinomial logit regression results, cost indices only
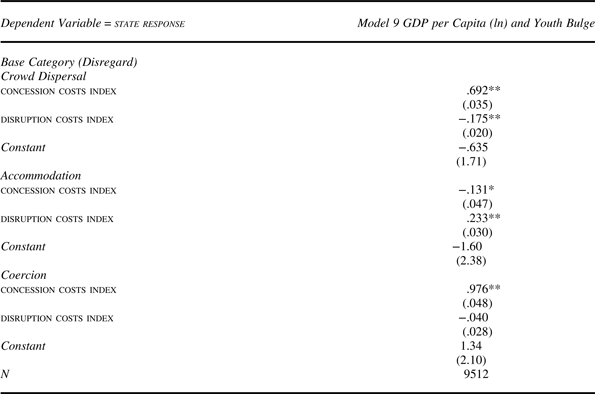
Notes: Ten observations completely dropped. Robust standard errors in parentheses. Two-tailed significance tests. *p ≤ .05; **p ≤ .01; ***p ≤ .001.
Additional robustness checks support the main results so we restrict the models to the appendix.Footnote 82 In Table A23 we rerun the split protester-identity models and include measures of protest history—alternatively, state response(t-1) and both costs indices at time t-1. We replace polity and polity squared with alternative measures of the political regime and legislative competiveness and effectiveness (head of state, regime type,Footnote 83 and government type).Footnote 84 A government's response decision could be influenced by a country's human rights practices that make coercion in response to protests an easier decision. We include two alternative measures of human rights practices, which removes contemporary protests from the analysis because physical integrity, from the CIRI Human Rights Database, ends in 2011Footnote 85 and the Political Terror Scale ends in 2013.Footnote 86 See appendix Tables A25 and A26.
Government response decisions might be influenced by ethnic power dynamics. To account for this we include alternative measures of ethnic-based relations between the government and population: number of excluded groups, number of included groups, and excluded population.Footnote 87 See appendix Table A27.
We also generate an alternative disruption costs index that omits protest size and instead accounts for the frequency of protest activity; for these models we include the natural log of participation size as an additional control variable. Protest frequency follows a nominal scale ranging from 0 to 3; when the previous protest was more than two months prior to the protest of interest, protest frequency is coded as 0; it is coded as 1 when the current protest is within two months from the previous protest; coded as 2 if the protests are within one week of one another; and coded as 3 if there is a concurrent protest.Footnote 88 See appendix Table A28.
We also split previous violence into protest violence t-1 and protest violence t-2 and alternatively include lagged values, at time t-1, of the costs indices and state response. Results are in appendix Table A29 and A30. Our main analysis is reinforced by these robustness checks. Accounting for protest history has a minimal impact on the substantive effect of our cost parameters, but does not change the statistical significance.
One inference we draw from this is that state response to protests is linked to a domestic constituency that supports the ruling coalition as well as the behaviors and demands of the protesters. From this perspective, competing coalitions or constituencies can make it increasingly likely that compromise is hard to find. Together this suggests that when it is hard for the ruling coalition to find a set of concessions that can satisfy both their internal constituency and protesters, they are more likely to try to address the protest through coercive tactics.
Discussion and Contemporary Political Implications
The results of our analysis shed light on recent political upheaval across the globe. They also point to a further refinement in our dynamic understanding of the processes underlying civil wars and potential interventions in them. This dynamic process has implications for internal and external politics. Our results identify variation in protest behaviors and differentiate the effect on state responses. If protesters organize around issues that leave the ruling coalition a “way out” and yet use their protest behaviors to generate disruption costs, on average, they are more likely to have their demands addressed, but by imposing higher concessions costs, on average, they are more likely to generate a coercive response. These findings add nuance to the action-reaction argumentsFootnote 89 suggesting that state responses are in part a function of a broader notion of costs and the role of threats to states’ ruling coalitions.Footnote 90
For example, our results help inform the different responses by states in the Arab Spring protests, as well as the opposition's willingness to press toward rebellion. In Syria and Libya the states responded with coercion to nonviolent protests and subsequently the opposition took up arms against the state. The concession costs imposed on Bashar al-Assad and Muammar Gaddafi made it difficult for them to accommodate without alienating their own core constituencies, and so the coercive response was consistent with the results of our models. Under other conditions, such as in Jordan or Morocco, there were accommodative strategies that could keep intact the ruling coalition or the level of disruption was so severe that accommodation was a compelling choice. The civil wars in Syria and Libya became internationalized as they spiraled out of control. External states intervening with military aid, human rights organizations caring for the trapped populations, and international aid relief trying to bring food and medicine have all been trying to stem the tide of the consequences of internal protest and state responses.
Our models advance the theoretical understanding of state response to protest actions. The action-reaction process that has carried much of the explanation for moving toward armed conflict is not sufficient to describe the process of protests and state response. Our results suggest that there are multiple ways for the opposition to impose costs through both nonviolent and violent protest, and it is the character or content of these costs that influence the shape of any action-reaction process. But our analysis does not answer all of the questions. We cannot answer the question of country-level heterogeneity that may account for differing responses under similar conditions, nor can we account for why groups protest. A fuller explanation for the former requires systematic treatment beyond a control for regime types; the latter requires a broader look into the sociological aspects of dissent. Theory would have to point to expectations and conditional arrangements.Footnote 91 Ultimately, modeling the onset of armed rebellion or civil war requires attention to the dynamic processes initially presented in the bargaining space and the environment created by political dissent in the form of protests; these processes appear to constrain choices and harden positions.
Supplementary Material
Supplementary material for this article is available at <https://doi.org/10.1017/S0020818318000061>.