

Armed conflicts have long been recognized as major demographic shocks, altering sex ratios, household structures, and long-term development trajectories. The Paraguayan War (1864–1870), or War of the Triple Alliance, stands as one of the most devastating conflicts in Latin American history. Contemporary diplomatic dispatches, local accounts, and later oral histories describe extraordinary mortality, feeding the long-standing perception that Paraguay lost more than half its prewar population and making the conflict one of the deadliest wars relative to national population size in modern history.
Yet despite this notoriety, scholarly estimates of the war’s demographic toll remain sharply contested. Reber (Reference Reber1988) argues, on the basis of comparative growth rates from other Latin American countries and a reinterpretation of Paraguayan census evidence, that population losses were far smaller, between 8.7 percent and 18.5 percent. In stark contrast, Whigham and Potthast (Reference Whigham and Potthast1999) estimate losses as high as 60 percent to 69 percent, drawing on direct census comparisons and adjustments for undercounting. Intermediate or alternative estimates have also emerged. Kleinpenning (Reference Kleinpenning2002) suggests a loss of 43 percent to 52 percent on the basis of the more reliable 1873 census; Riquelme and Newland (Reference Riquelme, Newland and Bulmer-Thomas1996), using parish records, find losses of at least 40 percent; and Capdevila (Reference Capdevila2006) likewise supports high-loss interpretations.Footnote 1 The stakes of this debate have risen further as recent work has shifted attention from the level of wartime mortality itself to its long-term social consequences. Alix-Garcia et al. (Reference Alix-Garcia, Schechter, Caicedo and Jessica Zhu2022) and Boggiano (Reference Boggiano2024), for example, document enduring effects on gender norms, female labor force participation and intimate partner violence; Valencia Caicedo and Pedrozo (Reference Valencia Caicedo, Pedrozo and Valencia Caicedo2023) examine how missionaries and soldiers shaped modern Paraguayan society; and Eslava and Valencia Caicedo (Reference Eslava and Valencia Caicedo2023) place the war’s demographic rupture within the deeper roots of Latin American inequality.
This article revisits these debates by introducing newly digitized archival records on draft-eligible males from December 1867 and January 1868. Compiled under wartime administrative orders, these district-level lists provide a near-contemporaneous snapshot of Paraguay’s male population in the final years of the conflict, precisely when conventional census data are unavailable, incomplete, or unreliable. While prior work has drawn on these records to study the war’s longer-term effects on gender norms, their direct value for evaluating competing estimates of wartime demographic loss has not been systematically explored (Boggiano Reference Boggiano2024).
Using these archival data, the paper reconstructs male population counts at a granular district level and links them to prewar census benchmarks through a demographic projection exercise. The analysis anchors its baseline in the last available census evidence, applies empirically grounded growth rates to project expected male populations in 1867–1868 absent war mortality, and compares those counterfactual projections with the observed draft eligibility counts. The central result is stark: across the forty-two districts for which a usable projected denominator can be constructed, only 10,628 draft-eligible males aged twelve and older were observed against a projected male population of 100,692, implying that the Paraguayan state was identifying approximately one in nine projected males as effectively present and draft eligible. This result is robust to alternative growth assumptions and aligns far more closely with high-loss estimates than with low-loss interpretations of the conflict.
The contribution of this article is twofold. First, it provides, to my knowledge, the first systematic quantitative analysis of wartime male population losses in Paraguay using near-contemporaneous administrative data, thereby addressing a long-standing unresolved question in Latin American historical demography. By digitizing and analyzing draft-age enumeration lists against prewar population baselines, the study offers direct demographic evidence that complements prior archival, narrative, and indirect estimation approaches. In doing so, it responds to broader calls in historical demography to incorporate micro-level administrative materials into the study of hidden mortality and population shocks (Valencia Caicedo Reference Valencia Caicedo2023). Second, the article contributes to a wider literature that treats violent demographic rupture not as peripheral to development, but as central to the formation of long-run inequality, household organization, and gender asymmetries. In that sense, the Paraguayan case speaks not only to one national controversy but also to a broader question of how extreme conflict becomes legible in demographic structure.
Historical background and the population debate
The Paraguayan War placed extraordinary pressure on the country’s population and administrative capacity. From the beginning of the conflict, the López regime relied on increasingly extensive forms of mobilization, drawing first on adult men and progressively widening recruitment as battlefield losses mounted and the military situation deteriorated. Contemporary accounts indicate that Paraguay entered the war with a substantial fighting force, but also that disease had already imposed heavy losses well before the terminal phase examined in this article. Thompson (Reference Thompson1869), for example, describes an initial military force on the order of seventy thousand to eighty thousand men and reports that roughly six thousand had already died of disease between the first call to arms and the early mobilization campaigns. By the late stages of the war, and especially after the Allied invasion of Paraguayan territory in April 1866, the Paraguayan state was attempting to sustain resistance under conditions of territorial contraction, food scarcity, disease, administrative dislocation, and severe demographic exhaustion. The records analyzed in this article belong precisely to this terminal phase of the war, when the problem facing the state was no longer ordinary enumeration but the urgent identification of men available, exempted, absent, disqualified, or otherwise relevant to continued mobilization. In that sense, these records must be read against a broader wartime context in which the mobilization frontier had expanded dramatically, reaching not only further into the adult male population but increasingly toward younger and more fragile populations as well (Potthast Reference Potthast, Potthast and Carreras2005, Reference Potthast2013).
The broader military chronology also matters for interpreting these records. As Bethell (Reference Bethell2018) emphasizes, the war unfolded in three broad phases: the initial Paraguayan offensives in Mato Grosso and Corrientes, the major Allied invasion of Paraguay beginning in 1866, and the final phase of pursuit and resistance that ended only with the death of Solano López at Cerro Corá on March 1, 1870.
This context is central to the demographic debate because the key problem is not merely one of counting the dead ex post, but of reconstructing population structure under conditions of war. The prewar baseline is weak: The last census commonly used in the literature dates to 1846, nearly two decades before the outbreak of the conflict (Williams Reference Williams1976; Kegler de Galeano Reference Kegler de Galeano1976). Yet that same census is also uniquely important. As Potthast (Reference Potthast2011) emphasizes, the 1846 enumeration is the only true census of the Republic before 1886, and although it is not exhaustive in every respect, it remains the most reliable broad benchmark available for the composition and approximate size of the prewar population. Any estimate of wartime losses therefore depends, explicitly or implicitly, on assumptions about population growth between 1846 and 1864. The postwar side of the comparison is no less problematic. Evidence for 1870 is fragmented and geographically uneven, while the often-cited 1873 figures raise well-known questions of provenance, coverage, and interpretation. The result is that the historiography has developed not around a single transparent prewar-postwar comparison but around competing reconstructions built from imperfect benchmarks.
The most influential revisionist intervention is that of Reber (Reference Reber1988, Reference Reber1990), who challenged the older view that the war produced near-catastrophic population depletion. Reber argued that earlier estimates relied on implausibly large prewar baselines and on problematic uses of postwar counts. Her alternative reconstruction implied a much smaller prewar population and therefore a far lower wartime death toll. Even for those who reject her substantive conclusions, her work forced the literature to confront the fragility of the evidence and its dependence on implicit assumptions about growth, household size, and enumeration quality.
The strongest response to the revisionist position came from Whigham and Potthast (Reference Whigham and Potthast1999), who argued that Paraguay suffered demographic losses on a far larger scale and that the surviving evidence is much more consistent with catastrophic collapse, especially among adult males. In this reading, the postwar sex imbalance is not a secondary curiosity but one of the clearest demographic signatures of the conflict itself. Subsequent work by Whigham and Potthast (Reference Whigham and Potthast2002)—among others—reinforced this broader high-loss interpretation and emphasized the scale of wartime male scarcity in ways that are difficult to reconcile with more moderate estimates. Other scholars have further expanded the debate by examining the quality of the census materials, the geography of population growth, and the reliability of both prewar and postwar baselines. Work by Riquelme and Newland (Reference Riquelme, Newland and Bulmer-Thomas1996), Kleinpenning (Reference Kleinpenning2002, Reference Kleinpenning2003), and Capdevila (Reference Capdevila2006) has broadened the evidentiary base from which the problem can be approached, drawing on landholding, parish records, local census reconstruction, and social history.
The demographic controversy also sits alongside a separate historiography on the origins of the conflict itself. In a useful synthesis, Abente (Reference Abente1987) distinguishes among imperialist, balance-of-power, and power-transition interpretations of the war, arguing that no simple British-imperial explanation is supported by the evidence and that the conflict is better understood through the interaction of shifting regional capabilities, Paraguayan dissatisfaction with its recognized role in the Río de la Plata, and the political fragility of neighboring states. That literature matters here not because the present paper seeks to adjudicate the causes of the war, but because the intensity and duration of the conflict conditioned the scale of the demographic shock whose late-war traces are examined in the draft lists.
At the same time, the demographic controversy sits within a broader historiography on Paraguayan society before, during, and after the war. More recent and renewed work by Telesca (Reference Telesca2010, Reference Telesca2019) and Potthast (Reference Potthast2024a, Reference Potthast2025) has made clear that the magnitude of wartime loss cannot be separated from questions of family organization, gender order, public morality, citizenship, and postwar nation building. Potthast’s (Reference Potthast2011) reconstruction of mid-nineteenth-century Paraguay is especially important here because it cautions against reading postwar social patterns too mechanically as products of wartime male loss alone. Drawing on the 1846 census and related materials, she argues that prewar Paraguay already exhibited a family structure that often diverged from European-Catholic norms, with high levels of illegitimacy, frequent female-headed households, substantial regional heterogeneity, and household arrangements in which unmarried unions, women-centered domestic units, and flexible kin structures were already common. In that sense, the war did not create Paraguayan family heterogeneity from nothing. What it did, more plausibly, was to intensify and reshape preexisting structures under conditions of extreme demographic shock.
This broader literature is important for two reasons. First, it underscores that the demographic question is not narrowly statistical: The size of the loss conditions how we interpret the reorganization of households, the visibility of female-headed families, the symbolic and material incorporation of women into wartime and postwar public life, and the social meaning of Paraguay’s long postwar recovery. Second, it helps situate this article within a wider effort to connect demographic reconstruction to the social history of war, rather than treating population loss as a detached quantitative controversy.
A useful way to situate the Paraguayan case is to place it in a broader comparative framework of male scarcity under extreme forms of conflict and coercive extraction. In settings marked by intense mortality, forced recruitment, enslavement, or prolonged military disruption, demographic shocks frequently become visible not only in aggregate population decline but also in highly distorted sex ratios among surviving populations. This matters here because the high-loss interpretation of the Paraguayan War implies not merely a large aggregate reduction in population, but a level of adult male scarcity severe enough to reshape household formation, marriage markets, labor allocation, and the social organization of survival itself. Table 1 places Paraguay alongside other settings of extreme male loss or extraction. The comparison is illustrative rather than strictly equivalent, but it shows that Paraguay’s postwar ratios, especially among the fertile population, sit within the range of the most severe historical distortions observed under extreme demographic stress (Manning Reference Manning2010; Whigham and Potthast Reference Whigham and Potthast1999; Brainerd Reference Brainerd2017; Teso Reference Teso2019).
Sex ratios under extreme male loss and coercive extraction

Table 1. Long description
A table comparing sex ratios in different historical settings with male scarcity. The table has four rows and five columns. The columns are labeled Historical setting, Reference population, Mean, S.D., and N. The rows are as follows: Row 1: Slave trade (1730-1850), Adult population, Loango and Angola, 0.50. Row 2: Paraguay (1870), All population, 0.518, 0.223, 34. Row 3: Paraguay (1870), Fertile population, 0.350, 0.362, 33. Row 4: Postwar Russia (1959), Age 18-44 (birth cohorts 1915-1941), 0.796, 0.168, 2025.
Notes: The table reports selected male-to-female ratios from historical settings characterized by severe demographic disruption. The comparison is illustrative and not intended to imply strict equivalence across cases. Lower values indicate greater relative scarcity of males.
Source: Transatlantic slave trade: Manning (Reference Manning2010) and Teso (Reference Teso2019); Paraguay, Whigham and Potthast (Reference Whigham and Potthast1999) and Whigham and Potthast (Reference Whigham and Potthast2002). Russia: Brainerd (Reference Brainerd2017).
This comparison helps clarify what is at stake in the population debate. If the low-loss interpretation were broadly correct, then the extreme male scarcity observed in the postwar evidence would require some explanation other than large-scale wartime depletion. If, on the other hand, losses were indeed catastrophic, then the postwar sex imbalance is not anomalous at all, but one of the most visible consequences of the conflict. The wartime records assembled here are useful precisely because they move the debate closer to contemporaneous evidence. They do not provide a direct census of mortality, and they must be interpreted carefully in light of wartime mobilization, noncompliance, medical discharge, and incomplete archival survival. But they do provide a district-level snapshot of draft-eligible males in late 1867 and early 1868, that is, before the formal end of the war and under conditions of acute mobilizational exhaustion.
What remains unresolved, then, is not simply one number, but a linked set of questions: how large Paraguay’s population was before the war, how fast it grew between 1846 and 1864, how reliable the surviving postwar counts are, and how wartime administrative evidence should be incorporated into demographic reconstruction. Existing literature has clarified these issues considerably, but it has not eliminated the basic problem that the war occurred between imperfect demographic benchmarks. This article intervenes by shifting attention from retrospective aggregate reconstruction alone to near-contemporaneous wartime records. Its purpose is not to replace earlier findings, but to discipline the range of plausible interpretations by asking whether district-level draft-eligible male levels in 1867–1868 are more consistent with low-loss or high-loss scenarios. In doing so, it connects the historiographical controversy to a concrete archival source base and places the measurement problem within the institutional realities of late-war Paraguay.
The next section explains how these records were identified, digitized, and transformed into an analytical dataset. It also clarifies the archival provenance of the material and the limits that follow from the fact that these are wartime administrative lists rather than a full national census.
Archival discovery and data construction
The wartime records used here were identified during the first stage of archival research for a different project, whose initial objective was to locate and catalog all surviving census-type materials in the Archivo Nacional de Asunción. During that visit in January 2018, archive employees explained that many of the relevant records had already been photographed and could be consulted through the Genealogical Society of Utah reproductions available via FamilySearch. Because the quality of those images was very high, they advised that there was no need to devote additional time to photographing the records on site. This made it possible to use the visit instead to explore the archival inventory more systematically and to assess what kinds of information these materials could provide. Through that process, and with the help of an internal list of volumes, I identified Nueva Encuadernación, volume 982, which contained the first part of the material eventually used in this article.Footnote 2 Continued review of the photographed materials subsequently led me to Nueva Encuadernación, volume 1012, which supplied the remaining records analyzed here.Footnote 3 What began as a broader search for surviving census materials thus developed into an ongoing effort to understand the analytical potential of these wartime records for reconstructing late-war demographic conditions. Figure 1 reproduces the corresponding entry in the archival inventory, which identifies volume 982 as a census-related record concerning the availability of citizens for military service.
Inventory entry in Nueva Encuadernación identifying volume 982. This image reproduces the relevant inventory entry in the Nueva Encuadernación catalog of the Archivo Nacional de Asunción. The entry for volume 982 describes the material as a census and related communications concerning the availability of citizens for service in arms. This was the first archival trace that led to the records analyzed in this paper.

These materials are not parish registers, nor are they civil censuses in the modern statistical sense. They are locally produced wartime military-administrative records concerning the availability of citizens for military service and related purposes. The surviving examples indicate that they were compiled at the district level by local authorities—including militia officers and justices of the peace, and in some cases with the participation of the parish priest—for the purpose of identifying the men present in each locality, together with their ages, illnesses, and service-relevant status. Their historical significance lies precisely in that administrative function: because they were produced during the late-war mobilization crisis, they provide a near-contemporaneous snapshot of local male availability under conditions of extreme demographic stress. The dataset analyzed here is therefore not drawn from a single pre-existing census document, but from the reconstruction of evidence across multiple surviving wartime records preserved in the Archivo Nacional de Asunción and consulted through FamilySearch images originating in the Genealogical Society of Utah photographic reproductions. Figure 2 illustrates the physical form of one such registry: an opening page listing names, ages, and illnesses, and a closing page reporting the total and certifying signatures of local authorities. In the example shown, the document is explicitly introduced as a nominal list prepared by local militia and judicial authorities, with clerical participation, which confirms the hybrid local administrative character of the source while also making clear its wartime mobilization purpose.
Sample pages from a wartime draft registry, Ybycuí, January 1868. (A) Opening page of the registry. (B) Closing page with total and signatures. These facsimiles illustrate the documentary structure of the source material used here. The opening page identifies the registry as a nominal list compiled by local militia officers and judicial authorities, with information on names, ages, and illnesses. The closing page reports the aggregate total and provides the local certification of the document. The examples shown here come from Ybycuí, dated January 1868.

A central feature of the dataset is that it was digitized manually. The transcription work began in 2019, before the recent spread of high-quality AI-based handwriting recognition and before text-recognition technologies became sufficiently reliable for a source of this kind. Because the records are handwritten, unevenly formatted, and preserved through photographed archival images, automated extraction was not feasible at the time with acceptable accuracy. The material was therefore transcribed by hand, entry by entry. This helps explain why the records, although preserved and accessible in principle, have remained underused in the quantitative literature on the Paraguayan War: transforming them into a usable analytical dataset required substantial manual effort.
After transcription, the material was harmonized across district names, matched to prewar census benchmarks, and combined with projected population measures for 1867–1868. The surviving records cover a substantial but incomplete set of Paraguayan districts, making them highly informative but necessarily partial evidence. They do not constitute a full national census, nor do they directly identify mortality. Rather, they provide localized wartime evidence on the observed male population and on administrative classifications relevant to service eligibility, at a time when Paraguay was already experiencing acute demographic collapse. For that reason, the empirical methodology of the paper treats these records as partial but unusually valuable evidence: their contribution lies not in replacing the broader demographic debate with a single definitive count, but in narrowing the range of plausible interpretations by introducing district-level wartime information that has not previously been assembled into a systematic dataset.
Baseline population data and projection methodology
The wartime records analyzed here are informative only relative to a demographic baseline. On their own, they tell us how many males were observed, listed, exempted, medically discharged, or otherwise classified by local wartime authorities in late 1867 and early 1868. To evaluate what those numbers imply, they must be compared against the male population that would plausibly have been present in the absence of the massive wartime disruption documented by both contemporaries and later historians. The empirical problem is therefore necessarily reconstructive. Paraguay did not conduct a full national census between 1846 and the war years, so expected male populations for 1867–1868 must be inferred from earlier census benchmarks.
I construct those benchmarks using the main surviving prewar census sources employed in the literature: the 1799 enumeration reported by Kleinpenning (Reference Kleinpenning2003), the 1846 census systematically analyzed by Williams (Reference Williams1976), and supplementary parish-based material compiled by Kegler de Galeano (Reference Kegler de Galeano1976). Among these, the 1846 census occupies a privileged place. As Potthast (Reference Potthast2011) stresses, it is the only true census of the Paraguayan Republic before 1886 and, while not exhaustive in every respect, it remains the most reliable broad benchmark for the composition and approximate size of the prewar population. Table 2 provides the full projection procedure district by district, including the historical census references used, the growth rates applied, and the method through which each 1867–1868 male adult population estimate is obtained. Table 3, by contrast, serves a narrower but necessary purpose: building on the population counts already collected by Williams (Reference Williams1976), it calculates the share of adults in the total population in 1846 for each district. I use those adult-population shares to scale down projected overall male populations into the draft-eligible male populations relevant for the wartime lists. Where district-specific adult shares are unavailable, I use a fallback age structure of 68.8 percent adults and 31.2 percent children, which corresponds to the average adult share observed across districts with usable adult-population information.
Projected male adult populations by district, with calculation method and notes

Table 2. Long description
The table presents projected male adult populations by district, including historical census references, growth rates, and calculation methods. It has 100 rows and 7 columns. Column headers are District, Census, B C C, Growth rate, Method, Estimates, and D N A. Row labels include district names. Each row lists the district, census year, B C C value, growth rate, method, estimates, and D N A value. Notable districts include Asuncion, Villarrica, and San Pedro, with varying growth rates and methods.
Notes: The 1799 and 1846 census data come from historical census compilations in Kleinpenning (Reference Kleinpenning2003), Williams (Reference Williams1976), and Kegler de Galeano (Reference Kegler de Galeano1976). Williams and Kegler refers to the census compiled by Williams (Reference Williams1976) and Kegler de Galeano (Reference Kegler de Galeano1976), respectively. Growth rates are calculated using available district-level census pairs when both are present; otherwise, estimates apply the national average growth rate of 1.75 percent (see Whigham and Potthast Reference Whigham and Potthast1999). The entry listed as Villa del Rosario includes Itacuribi del Rosario and San José de Yeteti (Reducción dentro de Villa del Rosario), reflecting its full historical administrative naming. The entry listed as San Francisco Duarte has also been known then and now as Arroyos y Esteros. Method indicates whether the final population projection for 1867–1868 was derived by direct growth rate application or external estimation. An em dash (—) indicates that the value is not available in the source.
(a) Census of the white population only. (b) Census of the foreign population only.
Calculated percentages of adult population in 1846 by district

Table 3. Long description
A table comparing the adult, child, and total population percentages by district in 1846. The table has 10 columns and 100 rows, including headers. Column headers are: District, Adult population, Child population, Total population, and % adult population. Row labels are district names. Row 1: Ayo, 319, 141, 460, 69.3. Row 2: Alto Paraguay (Paso de Patria), 902, 407, 1309, 69.0. Row 3: Alto Paraguay (Asuncion de Asuncion), 1914, 1033, 2947, 64.9. Row 4: Alto Paraguay (Asuncion de Asuncion), 1914, 1033, 2947, 64.9. Row 5: Alto Paraguay (Asuncion de Asuncion), 1914, 1033, 2947, 64.9. Row 6: Alto Paraguay (Asuncion de Asuncion), 1914, 1033, 2947, 64.9. Row 7: Alto Paraguay (Asuncion de Asuncion), 1914, 1033, 2947, 64.9. Row 8: Alto Paraguay (Asuncion de Asuncion), 1914, 1033, 2947, 64.9. Row 9: Alto Paraguay (Asuncion de Asuncion), 1914, 1033, 2947, 64.9. Row 10: Alto Paraguay (Asuncion de Asuncion), 1914, 1033, 2947, 64.9.
Notes: Data from Williams (Reference Williams1976) as compiled in the author’s calculations. Adult proportion calculated as Adult Population divided by Total Population for each district. (3) The entry listed as Villa del Rosario includes Itacuribi del Rosario and San José de Yeteti (Reducción dentro de Villa del Rosario), reflecting its full historical administrative naming. (4) The entry listed as San Francisco Duarte has also been known then and now as Arroyos y Esteros. (a) Census of the white population only. (b) Census of the foreign population only. An em dash (—) indicates that the value is not available in the source.
The advantage of working at this level of disaggregation is that it preserves local demographic heterogeneity rather than imposing a single aggregate national trend on all places equally. Whenever two census observations are available for the same district, I calculate a district-specific average annual growth rate and use it to project the local male population forward to 1867–1868. In districts for which only one benchmark is available, I instead apply the national average annual growth rate of 1.75 percent used by Whigham and Potthast (Reference Whigham and Potthast1999). The result is a transparent set of expected male population counts by district, explicit both about where the prewar evidence is relatively rich and where the reconstruction must rely more heavily on national demographic assumptions.
The projection methodology rests on a set of assumptions that are standard in historical demography, but worth stating clearly. First, it assumes that Paraguay would have continued to experience positive demographic growth between 1846 and the late 1860s, broadly consistent with the rates inferred from the available census data. Second, it assumes that no large prewar shock had already generated severe district-specific male deficits. Third, it assumes that the prewar male share of the population was sufficiently stable to make projected male counts meaningful at the local level. Moreover, they stack the deck, if anything, against finding extreme wartime male scarcity. If projected male populations are biased downward because of conservative growth assumptions or because population losses from the early years of the war are already partially reflected in the census benchmarks and growth paths from which the projections are constructed, then the implied gap between expected and observed males in 1867–1868 will also be conservative.
For that reason, the goal of the projection methodology is not to produce an artificial precision that the underlying data cannot sustain. It is to establish a plausible counterfactual distribution of males across districts against which the wartime records can be evaluated. This allows the analysis to move beyond anecdotal claims of devastation and beyond purely aggregate disputes over national totals. Instead, it becomes possible to ask a more concrete question: Given the size and growth of the local male population before the war, how many men would one expect to observe in these districts by late 1867 and early 1868, and how far do the archival records fall below that expectation? Figure 4 helps visualize this baseline and the coverage of the surviving wartime evidence. Panel (a) maps the preferred district-specific projection across the full projectable universe, while panel (b) restricts attention to the districts for which surviving 1867–1868 wartime records are available. The figure makes clear that the matched sample does not constitute a full national census, but neither does it rest on a handful of isolated observations: it covers a substantial and geographically dispersed subset of the districts for which the prewar demographic reconstruction can be carried out.Footnote 4
Paraguayan Districts (Kleinpenning Reference Kleinpenning2003). District identifiers shown on the map correspond to the following districts: 1 = Salvador; 2 = Aquidaban; 3 = Concepcion; 4 = Belén; 5 = Horqueta; 6 = Tacuati; 7 = Lima; 8 = San Pedro; 9 = Rosario; 10 = San Estanislao; 11 = Carimbatai; 12 = Curuguaty; 13 = Igatimi; 14 = Yhu; 15 = Caaguazu; 16 = Ajos; 17 = Carayao; 18 = San Joaquin; 19 = Unión; 20 = Caraguatay; 21 = Arroyos y Esteros; 22 = Occidental; 23 = Emboscada; 24 = Altos; 25 = Atyrá; 26 = Tobati; 27 = Barrero Grande; 28 = Ytacuribi; 29 = San José de los Arroyos; 30 = Valenzuela; 31 = Piribebuy; 32 = Caacupé; 33 = Pirayu; 34 = Ytaugua; 35 = Aregua; 36 = Luque; 37 = Limpio; 38 = Asuncion - Santisima Trinidad; 39 = Asuncion - Recoleta; 40 = Asuncion - Catedral + Encarnacion; 41 = Asuncion - San Roque; 42 = Lambare; 43 = Capiata - Aldana y Toledo; 44 = San Lorenzo del C Grande; 45 = San Lorenzo de la Frontera; 46 = San Antonio; 47 = Ypané; 48 = Capiata; 49 = Rojas y Yatayty; 50 = Guarambare; 51 = Ita; 52 = Villeta; 53 = Carapegua; 54 = Yaguaron; 55 = Paraguari; 56 = Hiati; 57 = Yataiti; 58 = Mbocayaty; 59 = Villa Rica; 60 = Y(h)acanguazu; 61 = Itape; 62 = Ybitimi; 63 = Acahay; 64 = Quiindi; 65 = Oliva; 66 = Ybucui; 67 = Caazapa; 68 = San Juan Nepomuceno; 69 = Yuty; 70 = Mbuyapey; 71 = San Isidro; 72 = Quiquyo; 73 = Caacupu; 74 = Villa Franca; 75 = San Juan Bautista; 76 = San Miguel; 77 = Santa Maria; 78 = Santa Rosa; 79 = San Ignacio; 80 = Tacuaras; 81 = Pilar; 82 = Guazu-Cua; 83 = Isla Umbu; 84 = Pedro Gonzalez; 85 = Desmochados; 86 = Laureles; 87 = Yabebiri; 88 = Santiago; 89 = San Cosme; 90 = Bobi; 91 = San Pedro del Parana; 92 = Carmen del Parana; 93 = Jesus; 94 = Trinidad; 95 = Encarnacion.

Figure 3. Long description
A map of Paraguayan districts showing the geographic boundaries and labeled with district identifiers. The map includes various districts such as Salvador, Aquidabán, Concepción, and others, each marked with a unique number. The districts are spread across the country, with some located in the northern, central, and southern regions. The map provides a clear visual representation of the administrative divisions within Paraguay.
Projected male population across districts under the preferred baseline. (A) Projected males aged twelve and older under the preferred district-specific baseline. (B) Projected males aged twelve and older restricted to districts with surviving 1867–1868 wartime records. Panel A maps the projected number of males age twelve and older under the paper’s preferred district-specific baseline, which combines district-specific growth rates and adult-population shares whenever available, with fallback assumptions only where necessary. Panel B restricts the same measure to the districts for which surviving wartime draft records are available for 1867–1868. Gray districts indicate missing wartime coverage in Panel B. Together, the two panels show that the empirical analysis does not rest on a handful of isolated districts, but on a substantial and geographically dispersed subset of the projectable district universe.

That comparison is meaningful only because the wartime draft registers measure more than the mere presence of surviving males. A central strength of these lists is that they classify men according to their relation to wartime mobilization. This is what makes them especially valuable, but it is also what makes them easy to misuse if read as though they were an ordinary census. The lists were produced after the Allied invasion of Paraguayan territory in April 1866, during the final phase of the conflict, when the state was attempting to identify every remaining male who might still be drawn into military service. As such, they are best understood as wartime administrative records generated under coercive and exceptional conditions rather than as a neutral demographic count. More specifically, they are mobilization-oriented local administrative lists rather than parish registers or civil censuses, which is why they record service-relevant classifications more readily than births, deaths, or household composition in the ordinary sense.
The individual-level entries are unusually rich. Enumerators recorded names, approximate ages, military rank or service status where relevant, legal condition in cases where that distinction mattered, and, critically, whether a given individual was judged fit for service or excluded from it. This makes the records analytically more informative than a simple tally of men by age. They provide a direct glimpse into how the late-war state categorized the remaining male population and into the biological and administrative constraints under which mobilization operated.
For the purposes of this paper, three categories are especially important. The first is the pool of observed males, that is, the males physically recorded in the lists. The second is the set of men marked as medically discharged, meaning that they were observed but judged unfit for service because of disease, disability, or severe bodily deterioration. The third is the set of men classified as noncompliant, meaning that they were enumerated as eligible but—for some reason—not mobilized yet. These categories should not be collapsed into one another. Noncompliance captures a failure of effective mobilization; medical discharge captures the physical incapacity of men who were in fact found and recorded. Both matter for understanding the exhaustion of the male population, but they imply different mechanisms.
This distinction is especially important for interpretation. A medically discharged man should not be read mechanically as a survivor who would otherwise have been healthy in peacetime. Many of the conditions recorded in the lists were severe enough that survival itself may have been uncertain even outside the battlefield context. For that reason, I do not treat the gap between projected and observed males as a literal measure of mortality. What the records identify more directly is the extent of male depletion and male unavailability under late-war conditions.
Table 4 is the point at which the prewar demographic baseline and the wartime administrative evidence come together, and it should be read in groups of columns. Columns 2–4 establish the benchmark. In columns 2 and 3, I report the last available census population for each district together with the corresponding census year. These are the raw historical population benchmarks from which the later projections begin. Column 4 then reports the projected number of males age twelve and older in 1867–1868. This is the counterfactual male population against which the wartime records are evaluated and therefore the key denominator for the rest of the table. These projections combine district-specific growth rates and district-specific adult shares whenever those are available, falling back to 1.75 percent growth and the 68.8 percent adult-share rule only where necessary. Unless otherwise stated, the projections reported in Table 4 are the article’s preferred baseline for interpretation, because they combine district-specific growth rates and district-specific adult shares whenever available, with fallback assumptions used only where the data require them. Districts for which no usable prewar population benchmark can be matched are reported separately without a projected denominator.
Draft-eligible, medically discharged, and noncompliant males by district (1867/1868).

Table 4. Long description
A table comparing draft-eligible, medically discharged, and noncompliant males by district. The table has 10 rows and 13 columns. Column headers are: District, Census population, Census year, Projected males 12+ (1867-1868), Observed males 12+: Total, Observed: % of projected, Medically discharged: Total, Med. discharged: % of projected, Med. discharged: % of observed, Noncompliant: Total, Noncompliant: % of projected. Row 1: Acahay, 4967, 1846, 4056, 447, 11, 301, 7, 67, 11, 0. Row 2: Ajos, 2794, 1846, 1446, 60, 4, 58, 4, 97, 0, 0. Row 3: Altos, 5043, 1846, 3571, 268, 8, 176, 5, 66, 16, 0. Row 4: Atyrá, 3081, 1849, 1747, 91, 5, 47, 3, 52, 4, 0. Row 5: Barrero Grande, 4384, 1846, 2996, 314, 10, 258, 9, 82, 3, 0. Row 6: Belén, 256, 1799, 292, 21, 7, 13, 4, 62, 2, 1. Row 7: Caacupé, 3576, 1844, 2453, 190, 8, 126, 5, 66, 7, 0. Row 8: Caaguazú, 6702, 1799, 7632, 47, 1, 18, 0, 38, 8, 0. Row 9: Caapucú, 3941, 1846, 3142, 163, 5, 71, 2, 44, 59, 2. Row 10: Caazapá, 5312, 1846, 4362, 385, 9, 237, 5, 62, 0, 0.
Notes: Columns 2 and 3 report the last available pre-war census benchmark for each district and the corresponding census year. Column 4 reports the projected number of males age twelve and older in 1867–1868, using district-specific growth rates when available, district-specific adult-population shares when available, a fallback growth rate of 1.75 percent only when necessary, and a fallback age structure of 68.8 percent of adults when district-specific adult shares are unavailable. A 50 percent male share is assumed throughout. Columns 5 and 6 report the number of males age twelve and older observed in the wartime draft lists. The percentage is calculated over projected males age twelve and older in column 4. Columns 7–9 report the subset of observed males classified as medically discharged. The first percentage is calculated over projected males age twelve and older in column 4; the second over observed males in column 5. Columns 10 and 11 report the number of noncompliant males. Percentages are calculated over projected males age twelve and older in column 4. The following districts’ data date from December 1867: Altos, Atyrá, Belén, Caacupé, Limpio, Luque, Piribebuy, Quyquyhó, Santa Rosa de Lima, Villa de San Pedro, Villa del Rosario, Villa Rica, Ypané. Data from Unión correspond to 1869. The remaining data correspond to January 1868. (a) San Tomás (Paraguarí). (b) Only foreigners. (c) No usable prewar benchmark; percentages over projected not reported.
Columns 5 and 6 report the males actually observed in the wartime draft lists. These are the men aged approximately twelve and older who were recorded by local authorities in December 1867 or January 1868, depending on the district. The first figure in this block is the total number observed; the adjacent percentage expresses that total as a share of the projected male population in column 4. This is the most direct summary measure of late-war local male scarcity in the table. It tells us how much of the expected male population remained visible to the state at the district level by the final phase of the conflict.
Columns 7–9 narrow the focus from all observed males to the subset classified as medically discharged. Again, the first entry is the total number of medically discharged males. The next percentage expresses that number as a share of the projected male population, while the final percentage expresses it as a share of the observed males listed in column 5. These two percentages answer different questions. The first tells us how large medical discharge was relative to the projected local male population as a whole. The second tells us how important medical discharge was within the residual male population that remained visible to the wartime state. This distinction is important because it separates biological frailty within the observed population from the broader question of how many males were missing from local wartime enumeration altogether.
Columns 10 and 11 report noncompliant males. These are men who, under the general mobilization rules of the lists, were identified as not effectively complying with the draft obligation. The total is followed by a percentage calculated over the projected male population. This column is analytically useful because it captures a different mechanism of male unavailability than medical discharge. A medically discharged man was present and recorded, but judged unfit for service. A noncompliant man, by contrast, fell outside effective mobilization despite still being relevant to the administrative logic of the registry. The distinction matters because the late-war contraction of the locally usable male population cannot be reduced to one channel alone.
Read together, these columns move the analysis beyond a simple wartime headcount. First, there is the gap between the projected male population in column 4 and the observed males in column 5. That gap captures the enormous contraction of the local male population visible to the state. Second, within the observed males, columns 7–9 identify the extent to which surviving and visible men were physically unfit for service. Third, columns 10 and 11 identify the extent to which men who were administratively relevant to mobilization nevertheless did not comply. These distinctions are essential because they show that late-war male scarcity was not simply a matter of how many men remained, but also of what condition they were in and how usable they were to the wartime state.
The disease information reported in Table 5 sharpens this point further. The prevalence of tuberculosis, smallpox, dysentery, leprosy, plague, and related debilitating conditions is not merely a medical detail. It documents the biological fragility of the late-war male population and helps explain why even the men who remained visible to the state were often of limited military use. More broadly, it shows that the demographic consequences of the war cannot be reduced to battlefield death alone. By the final stage of the conflict, military attrition, disease environment, hunger, displacement, and administrative desperation had become intertwined. In that sense, Table 5 should be read not as a separate descriptive appendix, but as part of the same evidentiary structure as Table 4: together, they show not only how few men remained locally visible, but also how biologically deteriorated a substantial share of that residual male population had become.
Predominant diseases in the draft-eligible lists (1867, 1868)

Table 5. Long description
A table with 46 rows and 11 columns. The columns are labeled District, Males Total, Tuberculosis: Total, Tuberculosis: percent, Smallpox: Total, Smallpox: percent, Dysentery: Total, Dysentery: percent, Leprosy: Total, Leprosy: percent, Plague: Total, and Plague: percent. The table lists data for various districts, including the total number of males, and the total and percent of cases for tuberculosis, smallpox, dysentery, leprosy, and plague. The total number of males across all districts is 11,258, with 46 cases of tuberculosis, 6 cases of smallpox, 9 cases of dysentery, 57 cases of leprosy, and 29 cases of plague. The range of percent values for each disease varies across districts.
Notes: District data from December 1867: Altos, Atyrá, Belén, Caacupé, Limpio, Luque, Piribebuy, Quyquyhó, Santa Rosa de Lima, Villa de San Pedro, Villa del Rosario, Villa Rica, Ypané. Unión corresponds to 1869; remaining data from January 1868. Percentages are calculated over observed males aged 12 and older. (a) San Tomás (Paraguarí). (b) Only Foreigners.
This is why Table 4 is central to the empirical methodology of the paper. If low-loss interpretations were broadly correct, one would expect the wartime records to reveal a much larger surviving pool of adult and adolescent males across districts than the archival record in fact shows. One would also expect medical discharge, disease burden, and noncompliance to constitute a more limited constraint on mobilization than what is actually observed. Instead, the table shows district after district in which only a small fraction of the projected male population remained locally visible and, among those observed, a substantial share was either medically discharged, afflicted by serious disease, or otherwise unavailable for effective mobilization.
At the same time, these tables should not be read as literal mortality registers. The difference between projected and observed males cannot be interpreted one for one as wartime death. Some men absent from local enumeration may have died in battle or from disease, but others may have been serving elsewhere, imprisoned, displaced, deserted, or otherwise missing from the surviving local records. Likewise, the medically discharged were not men who had died, but men who remained visible to the state while being judged physically unfit for service. The noncompliant represent yet another mechanism of unavailability. The value of the tables lies precisely in making these distinctions visible. They do not solve every identification problem, but they sharply constrain what can plausibly be said about the scale, condition, and effective usability of the late-war male population at the district level.
The next section turns to the results themselves and examines what these projected and observed counts imply for the broader demographic debate.
Main results
The central empirical fact emerging from the wartime records is the extraordinary contraction of Paraguay’s locally observed male population by the final stage of the conflict. Across the surviving 1867–1868 draft records, 10,628 draft-eligible males aged roughly twelve and older were recorded in the set of districts for which a usable projected denominator can be constructed, compared to a projected male population of 100,692 for that matched sample of districts in 1867–1868.Footnote 5 As shown in Table 4, this implies an aggregate observed eligibility rate of approximately 10.6 percent. Put differently, by late 1867 and early 1868, the Paraguayan state was identifying only about one in nine projected males as effectively present and draft eligible in the districts for which surviving records can be matched to a prewar benchmark. Even after allowing for all the caveats attached to wartime administrative sources, this is an extraordinarily thin pool of locally available males for a country still attempting to sustain a major war. Figure 5 maps this central result directly by district, showing observed males as a share of projected males under the preferred baseline. The visual pattern reinforces the tabular evidence: Late-war male scarcity was widespread across the observed territory but not geographically uniform.
Observed males age twelve and older as a share of projected males age twelve and older by district. The figure maps the ratio of observed males age twelve and older in the surviving wartime draft lists to the projected male population age twelve and older under the preferred district-specific baseline. Darker districts indicate a larger surviving male population relative to the projected counterfactual; lighter districts indicate more extreme male scarcity. Gray districts indicate that no surviving wartime record is available or that no usable projected denominator could be constructed. This is the article’s central district-level measure of late-war local male scarcity.

This aggregate result is already difficult to reconcile with low-loss interpretations of the conflict. If wartime mortality and wartime male removal had remained within the lower range suggested by revisionist estimates, one would expect the local male population still visible to the state in late 1867 and early 1868 to have been substantially larger. The records do not show anything of the sort. Instead, they reveal a society in which the late-war state was working with a dramatically narrowed pool of adolescent and adult males, precisely in the period following the Allied invasion of Paraguayan territory in April 1866 and during the increasingly desperate mobilization efforts of López’s government.
The district evidence makes this pattern even more striking. Table 4 shows that male scarcity was widespread, though not geographically uniform, while Figure 5 makes that spatial heterogeneity visible, and Table 6 reorders the same evidence to make the extremes easier to see. At the bottom of the distribution, Caaguazú records observed males equivalent to only 0.6 percent of the projected male population; Luque, 3.6 percent; Ajos, 4.2 percent; Emboscada, 4.5 percent; Ytape, 4.6 percent; Caapucú, 5.2 percent; and Atyrá, 5.2 percent. Even the “least bad” districts in this lower tail remain deeply depleted: Belén stands at 7.2 percent; Altos, at 7.5 percent; and Caacupé, at 7.7 percent. At the other end, districts that appear comparatively less affected still display striking scarcity by any plausible peacetime standard. Ypané records 41.2 percent; Villa de San Pedro, 31.1 percent; Quyquyhó, 34.5 percent; Carayao, 27.8 percent; and Ybycuí, 26.1 percent. As mentioned earlier, this should not be read mechanically as mortality alone. By late 1867 and early 1868, the absence of men from local wartime enumeration may reflect several distinct mechanisms: death in battle, death from disease in military camps, continued military service away from home districts, imprisonment—including the thousands of Paraguayan men held at Uruguayana for the duration of the war—desertion, displacement, or other forms of administrative invisibility. Yet even after allowing for all these caveats, the observed local male population remains extraordinarily small and difficult to reconcile with low-loss interpretations of the conflict. What the records establish most directly is therefore not mortality in a narrow accounting sense but the scale of late-war male scarcity at the district level.
Districts with the lowest and highest observed male shares, age 12 and older

Table 6. Long description
A table comparing districts with the lowest and highest observed male shares, age 12 and older. The table has two panels, Panel A and Panel B, each with 10 rows and 7 columns. Panel A lists districts with the lowest observed males as a share of projected males, and Panel B lists districts with the highest observed males as a share of projected males. Each row includes the district name, population, year, projected males, observed males, percentage of projected, predominant disease, and disease percentage of observed. Panel A: Row 1: Caaguaz, 6702, 1799, 7632, 47, 0.6, None recorded, 0.0. Row 2: Luque, 10177, 1846, 5262, 190, 3.6, Smallpox, 1.1. Row 3: Ajos, 2794, 1846, 1446, 60, 4.2, Plague, 1.7. Row 4: Emboscada, 3418, 1846, 1834, 83, 4.5, None recorded, 0.0. Row 5: Ytape, 3285, 1846, 4725, 218, 4.6, None recorded, 0.0. Row 6: Caapuc, 3941, 1846, 3142, 163, 5.2, Leprosy, 0.6. Row 7: Atyr, 3081, 1849, 1747, 91, 5.2, None recorded, 0.0. Row 8: San Joaquin, 2761, 1838, 2077, 136, 6.5, Leprosy, 1.5. Row 9: Villa del Rosario, 5904, 1846, 3471, 229, 6.6, Plague, 1.7. Row 10: Belen, 256, 1799, 292, 21, 7.2, Plague, 4.8. Panel B: Row 1: Ypan, 303, 1799, 345, 142, 41.2, None recorded, 0.0. Row 2: Quyquyho, 1989, 1846, 739, 255, 34.5, None recorded, 0.0. Row 3: Villa de San Pedro, 2769, 1846, 1459, 454, 31.1, Leprosy, 1.8. Row 4: Carayao, 460, 1846, 234, 65, 27.8, Tuberculosis, 3.1. Row 5: Ybycu, 3932, 1846, 1849, 482, 26.1, Plague, 0.2. Row 6: Villa Rica, 5105, 1846, 2202, 562, 25.5, Smallpox/Dysentery/Leprosy (tie), 0.2. Row 7: Guarambare, 855, 1858, 335, 84, 25.1, None recorded, 0.0. Row 8: Mbuyapey, 1851, 1846, 864, 176, 20.4, None recorded, 0.0. Row 9: Caraguatay, 3168, 1846, 1767, 340, 19.2, Tuberculosis, 1.2. Row 10: San Estanislao, 1719, 1846, 1006, 189, 18.8, Leprosy, 2.1.
Notes: The ranking is based on the exact underlying ratios; “predominant disease” refers to the most frequent disease category in Table 5; where none was recorded the entry reads “none recorded.” Percentages in the last column are over observed males age twelve and older.
This variation matters, but it should not be overstated in the wrong direction. The point is not that some regions were spared. The point is that the entire observed territory was deeply affected, with some districts pushed further into scarcity than others. The spatial pattern is therefore one of pervasive local male thinning, not of isolated demographic disaster surrounded by relatively intact zones. This is consistent with a war that, by its final stage, had ceased to operate as a conventional interstate conflict and had become a national-scale demographic levy. The state was no longer simply drafting adult men in ordinary military-age cohorts. It was reaching ever deeper into the residual population, and the lists themselves make that desperation visible.
One of the clearest indicators of this is the systematic appearance of very young boys and older men in the enumerated population. As both contemporary observers and later historians suggest, by late 1867 Paraguay was drawing on age groups that would not ordinarily have formed part of a conventional mobilization pool (Thompson Reference Thompson1869; Whigham and Potthast Reference Whigham and Potthast1999; Potthast Reference Potthast, Potthast and Carreras2005). This is important because it shows that the records are not merely documenting a shrinking adult male population; they are documenting a late-war regime of total demographic mobilization. The fact that boys near the lower bound of military usefulness appear in the lists is itself evidence of how deeply the conventional male population base had already been exhausted.
At the same time, the lists do not simply record the presence of remaining males. They also reveal how narrow the effectively mobilizable pool had become. As discussed in the previous section, the gap between projected and effectively available males reflects several distinct mechanisms: Some men are entirely absent from the wartime enumerations because of death, active service elsewhere, displacement, imprisonment, or desertion; others appear in the surviving lists but are classified as medically discharged; and others fall under the general rules as noncompliant or otherwise not effectively available for mobilization. What makes the records especially valuable is that they expose these limits from within the wartime administrative apparatus itself.
The disease data in Table 5 sharpen that point, and Table 6 helps show how this interacts with the best and worst observed-share districts. Figure 6 complements this evidence by mapping medically discharged males both as a share of the projected male population and as a share of the observed males still visible in the wartime lists. On first inspection, the prevalence of disabling illness in the surviving lists may appear lower than one might expect in a country experiencing catastrophic wartime breakdown. Tuberculosis, the most frequently reported condition, rarely exceeds 3 percent at the district level. Leprosy reaches notable peaks in a few places, especially Tacuaty, but remains low or absent in many others. Smallpox, dysentery, and plague appear only sporadically. In the lower-tail districts highlighted in Table 6, the most prevalent recorded disease is often absent altogether or appears only at low percentages, while in others—such as Santa Rosa de Lima or Belén—the residual observed population appears more visibly marked by leprosy or plague. In the upper-tail districts, several of the “least depleted” places likewise show no recorded disease at all, while others display only modest prevalence. These low recorded rates should not be read as evidence that the remaining male population was broadly healthy. Rather, they likely reflect a mixture of rough wartime classification and underdiagnosis. By late 1867, the men still visible to local authorities were, in many districts, the residual survivors of prior campaigns, forced marches, hunger, epidemic exposure, and cumulative attrition. This point is reinforced by Thompson’s observation that disease had already eliminated roughly six thousand Paraguayan soldiers between the first call to arms and the early mobilization campaigns of the war (Thompson Reference Thompson1869). In that sense, Table 5 and Figure 6 are less a census of disease prevalence than a window into the biological fragility of the shrinking male population still available to the state.
Spatial distribution of medical discharge in the wartime draft records. (A) Medically discharged as a share of projected males age twelve and older. (B) Medically discharged as a share of observed males age twelve and older. Panel A maps medically discharged males as a share of projected males age twelve and older, showing the extent to which medical unfitness reduced the effective male population relative to the prewar demographic counterfactual. Panel B maps medically discharged males as a share of observed males age twelve and older, showing the importance of disease and physical incapacity within the residual male population still visible to the wartime state. Gray districts indicate missing wartime records or unavailable denominators. Together, the two panels show that late-war male scarcity was not only a matter of numerical absence, but also of the biological deterioration of the men who remained.

This interpretation also helps explain why the records are so informative despite not being a mortality register. They do not tell us directly which men had died in battle, which had succumbed to disease, and which were missing for other reasons. But they do tell us, with unusual granularity, how few males remained visible and usable to the wartime state. Figures 5 and 6 make this especially clear: Late-war male scarcity not only was widespread in numerical terms but also was compounded by the physical deterioration of a substantial share of the men who remained. That alone is enough to place severe pressure on the lower end of the demographic estimates in the literature.
Taken together, the aggregate evidence, the district-level heterogeneity, and the disease classifications all point in the same direction. Paraguay in late 1867 and early 1868 was not a society experiencing a temporary demographic setback offset by later recovery. It was a society confronting the severe local thinning of its adolescent and adult male population. The records make that scarcity visible before the formal end of the war, and they do so at precisely the level—the district—at which the social and administrative consequences of demographic collapse would have been most immediately felt.
Interpretation and historical implications
The results presented here are most naturally read as evidence of severe late-war male scarcity and male population exhaustion during the final phase of the conflict. That phrasing matters. The lists do not provide a direct census of mortality, and they should not be treated as though every absent man were necessarily dead. But what they do show is that, by late 1867 and early 1868, the Paraguayan state was operating with an extraordinarily narrow residual male base. The distinction is important analytically but not exculpatory substantively: whether through death, active service elsewhere, imprisonment, desertion, displacement, severe illness, or administrative noncompliance, the male population effectively available to local authorities had already contracted to a degree that is extremely difficult to reconcile with low-loss interpretations of the war.
This matters because the demographic debate has too often been framed as a disagreement over aggregate totals reconstructed from uncertain prewar and postwar censuses. The contribution of the present paper is to bring contemporaneous wartime evidence back into the center of that dispute. The late-war draft lists do not settle every uncertainty surrounding Paraguay’s total wartime losses, but they do alter the evidentiary balance. The local male population observed in these records is far too small to sit comfortably within a scenario in which wartime losses remained below 20 percent of the prewar population. To sustain that view, one would need to assume that an enormous share of the surviving male population was somehow absent from local communities yet also not dead, not permanently disabled, not imprisoned, and not otherwise removed from the effective demographic structure of the country. That may be possible in isolated cases; it is not a convincing description of the general pattern revealed across the districts in Table 4.
By contrast, the evidence is much easier to interpret within the high-loss framework associated with Whigham and Potthast (Reference Whigham and Potthast1999) and related work. Under that reading, late-war Paraguay appears exactly as one would expect: a polity still attempting to mobilize a male population that had already been catastrophically thinned by years of warfare, disease, and coercive extraction. The inclusion of boys near the lower edge of military usefulness, the extremely low eligibility shares in many districts, and the narrow pool of physically serviceable men all point in that direction. The records do not mechanically deliver a single mortality percentage, but they make some demographic scenarios far more plausible than others. In that sense, the paper does not resolve the historiographical debate by assertion; it narrows it empirically.
The historical implications extend well beyond the measurement dispute itself. A country entering the postwar period with this degree of male scarcity would have faced immediate and far-reaching consequences for household structure, land transmission, marriage markets, and the gendered organization of work. This is where the demographic question links directly to the newer literature that has shifted attention from the level of wartime loss to its longer-run social effects. If the male deficit documented here is even approximately right in magnitude, then the postwar Paraguayan household could not simply have been a smaller version of its prewar counterpart. It must, in many places, have been reorganized under conditions of severe asymmetry between surviving women and men, altered prospects of marriage and remarriage, and a sharper dependence on women’s labor, kinship networks, and adaptive forms of household formation.
At the same time, it is important not to overstate the discontinuity introduced by the war. As Potthast’s analysis of the 1846 census makes clear, prewar Paraguay already displayed high levels of female-headed households, unstable or nonmarital unions, and family structures that did not conform neatly to a patriarchal conjugal ideal (Potthast Reference Potthast2011). In other words, the war did not create Paraguayan family heterogeneity ex nihilo. Its significance lies rather in having deepened, generalized, and hardened those patterns under radically more adverse demographic conditions. The late-war male scarcity documented in this article should therefore be understood less as the sole origin of Paraguay’s distinctive postwar family patterns than as a powerful accelerator and intensifier of preexisting social forms.
Recent work by Barbara Potthast is especially useful here because it connects the demographic shock of the war to the disarticulation of family life itself. Households were not merely reduced in size; they were fragmented by recruitment, displacement, famine, military evacuation, and the forced movement of women and children. Children were separated from mothers, male heads disappeared from many domestic units, and the conditions of war increasingly pushed women into roles of economic support and social coordination that had been less visible in the prewar record (Potthast Reference Potthast, Potthast and Carreras2005, Reference Potthast2025). This does not mean that the war created female agency ex nihilo, nor that wartime Paraguay became socially egalitarian. It means that the demographic contraction documented in the draft lists provides the underlying condition for a postwar society in which female-headed households, unstable unions, reconfigured kinship strategies, and a more visible economic centrality of women would have become much harder to avoid.
That broader interpretation is also consistent with the literature showing long-term effects of the war on female labor force participation, gender norms, and social organization (Alix-Garcia et al. Reference Alix-Garcia, Schechter, Caicedo and Jessica Zhu2022; Boggiano Reference Boggiano2024; Valencia Caicedo and Pedrozo Reference Valencia Caicedo, Pedrozo and Valencia Caicedo2023; Eslava and Valencia Caicedo Reference Eslava and Valencia Caicedo2023). But it also fits a richer historical literature that warns against treating “women” as a single wartime category. As Potthast (Reference Potthast2006, Reference Potthast2013) has shown, the female experience of the war was internally differentiated: some women were mobilized symbolically as patriotic figures, some followed armies as residentas, some were forcibly displaced, some were left to sustain households under conditions of scarcity, and some became central to the postwar memory work through which the nation narrated its own survival. The point, then, is not that the draft lists directly identify marriage markets or bargaining power. They do not. The point is that they document the demographic precondition without which those later transformations would be very difficult to explain.
The results also bear on a wider historiography of postwar reconstruction and national identity. Telesca (Reference Telesca2010, Reference Telesca2019) and Potthast (Reference Potthast2024b), in different ways, have shown that the postwar Paraguayan order cannot be understood only through military defeat or institutional rebuilding. It was also a moment in which family life, gender hierarchy, and the language of citizenship were being renegotiated under radically altered demographic conditions. In that context, the familiar image of Paraguay as el país de las mujeres should not be read merely as a colorful postwar stereotype. It reflects, however imperfectly, the social visibility of an underlying demographic reality: the war had made female numerical predominance and male scarcity part of the lived and observed structure of everyday life (Potthast Reference Potthast2024b). That stereotype was later reworked in public memory, school narratives, and nationalist discourse, but it did not arise from nowhere (Telesca Reference Telesca2015).
More broadly still, the Paraguayan case belongs in a comparative literature on demographic rupture under extreme coercion. In Africa, the transatlantic slave trade produced durable female-biased sex ratios and long-run transformations in kinship systems and gender roles (Manning Reference Manning2010; Teso Reference Teso2019; Lowes and Nunn Reference Lowes and Nunn2024). In Europe, wars and mortality shocks similarly reshaped household formation, labor supply, and the social meaning of scarcity in marriage markets (Brainerd Reference Brainerd2017). Paraguay’s trajectory fits within that larger family of cases, but in a particularly stark form: not because its institutions were identical to those of postwar Russia or slave-exporting Africa, but because the demographic signature of extreme male loss is legible in similarly distorted sex structures and in the social adjustments that followed.
Seen in this light, the Paraguayan War was not only a military and territorial catastrophe. It was also a demographic rupture of unusual depth, one whose effects radiated outward into the intimate structure of postwar society. The evidence presented here does not close the debate on every point, and it should not be read as if it did. What it does do is make clear that by the final years of the conflict, Paraguay’s local male population had been reduced to levels that are very difficult to square with conservative revisionist estimates. In that sense, the results push the literature toward a stronger recognition that the postwar Paraguayan social order was shaped not only by defeat and reconstruction, but by the severe demographic thinning of the male population itself.
Robustness, limitations, and scope
Four robustness and scope considerations, developed in full in the Supplementary Materials, qualify and support this reading. First, the results are not an artifact of the growth assumptions used to project the male population forward from the prewar benchmarks. Recomputing the projections under alternative scenarios (Supplementary Materials, Section S1, Tables S1–S2) moves the level of the counterfactual male population but never produces a picture of a broadly intact local male population: in the matched wartime sample, the observed share of projected males age twelve and older is 10.6 percent under the preferred district-specific baseline, 12.3 percent under the Whigham and Potthast (Reference Whigham and Potthast1999) benchmark, 13.2 percent under the Reber (Reference Reber1988) benchmark, 19.2 percent under the minimum observed growth rate, and 2.4 percent under the maximum. No plausible growth-rate assumption rehabilitates the low-loss scenario.
Second, coverage limits constrain national exactitude but not the observed pattern. The broader projection universe includes seventy-nine districts drawn from the main prewar census sources; of these, forty-five have surviving wartime records and forty-two can be matched to a usable projected denominator—roughly 57 percent and 53 percent of the projectable district universe, respectively (Section S2). The surviving evidence is neither random nor statistically representative, but a low-loss reading would require the missing districts either to carry implausibly large demographic weight or to have been anomalously insulated from the war. Third, reordering the district evidence by historical origin following Kleinpenning (Reference Kleinpenning2003) shows that severe late-war male scarcity characterizes districts of indio/pardo and español/criollo origin alike; this exploratory exercise, and the care its interpretation requires, is developed in Section S3 and Table S3.
Finally, the wartime lists are administrative records, not mortality registers or a census in the modern statistical sense, and the gap between projected and observed males cannot be read one for one as deaths (Section S4). Yet that limitation is also part of the contribution: Even as an administrative rather than a mortality source, the records place very strong constraints on the range of plausible demographic interpretations. A country that had suffered only modest population losses should not, by the final phase of the war, display district after district with such a reduced local male pool, nor a residual male population so heavily marked by illness, physical disqualification, and administrative nonavailability.
Conclusion
This article revisits one of the longest-running empirical controversies in Latin American historical demography: the scale of Paraguay’s population losses during the Paraguayan War or the War of the Triple Alliance. It does so by bringing to bear a body of near-contemporaneous wartime evidence that has not previously been assembled into a systematic district-level dataset for this purpose. The central result is stark: Across the forty-two districts for which surviving 1867–1868 draft records can be matched to usable prewar population benchmarks, the Paraguayan state was identifying approximately one in nine projected males aged twelve and older as effectively present and draft eligible—a result that holds across alternative growth assumptions. Even allowing for the fact that these are wartime administrative lists rather than a mortality census, this is an extraordinarily thin local male population for a country still attempting to sustain a major war.
The contribution of the article is therefore not to claim a spurious precision about total mortality, but to narrow the range of plausible demographic interpretations. The records do not permit a one-for-one translation from absence to death. Men missing from local enumeration may have died, served elsewhere, been imprisoned, deserted, been displaced, or otherwise fallen outside the surviving administrative record. Yet this uncertainty does not rescue the low-loss scenario. On the contrary, once contemporaneous district-level evidence shows such severe late-war male scarcity, a low-loss interpretation becomes increasingly difficult to sustain. Across all reasonable variants of the sensitivity analysis, the contemporaneous evidence collected here remains far more consistent with high-loss than with low-loss interpretations of the conflict.
More broadly, the article speaks to historians, historical demographers, and economists alike: it brings near-contemporaneous district-level records into a debate long reliant on retrospective reconstruction, shows how partial administrative sources can narrow the range of plausible interpretations of population loss where no direct mortality census exists, and documents the demographic rupture underlying later changes in household structure, gender relations, labor allocation, and postwar social organization. In that sense, this article does more than revisit a disputed estimate: It links wartime demographic collapse to broader processes of historical and social transformation.
The results also matter beyond the measurement dispute itself. If by late 1867 and early 1868 Paraguay’s districts were operating with such narrow male pools, then the postwar social order must be understood not simply as political defeat followed by institutional reconstruction, but as the aftermath of a severe demographic rupture—one that helps illuminate postwar Paraguay’s distorted sex ratios, reconfigured households, intensified female economic centrality, and altered marriage and kinship structures. Those postwar patterns were layered onto a society that already displayed considerable heterogeneity in family organization before the war (Potthast Reference Potthast2011); the war did not create that heterogeneity from nothing, but magnified it under conditions of extreme demographic stress.
The article therefore does not claim to settle every question about Paraguay’s wartime losses. The surviving records are partial, and any national reconstruction must remain cautious. But the evidence assembled here does establish something important with unusual clarity: by the final phase of the conflict, the local male population available to the Paraguayan state had been reduced to levels that are very difficult to reconcile with conservative revisionist estimates. Whatever uncertainty remains over the exact composition of absence, the contemporaneous district-level evidence points to a late-war male scarcity that was not merely severe, but catastrophic.
Supplementary material
The supplementary material for this article can be found at https://doi.org/10.1017/lar.2026.10167
Acknowledgments
I thank Franco Fernández for excellent research assistance. I am especially grateful to my mother, Selva Reyes, who raised me on history rather than fairy tales and is the origin of my fascination with the past; and to all those who have insisted over the years that this passion should have made me a historian rather than an economist—may this paper stand as a modest compromise. All errors are my own.
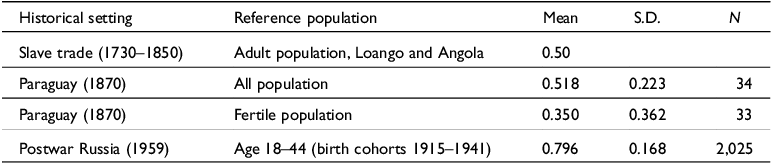


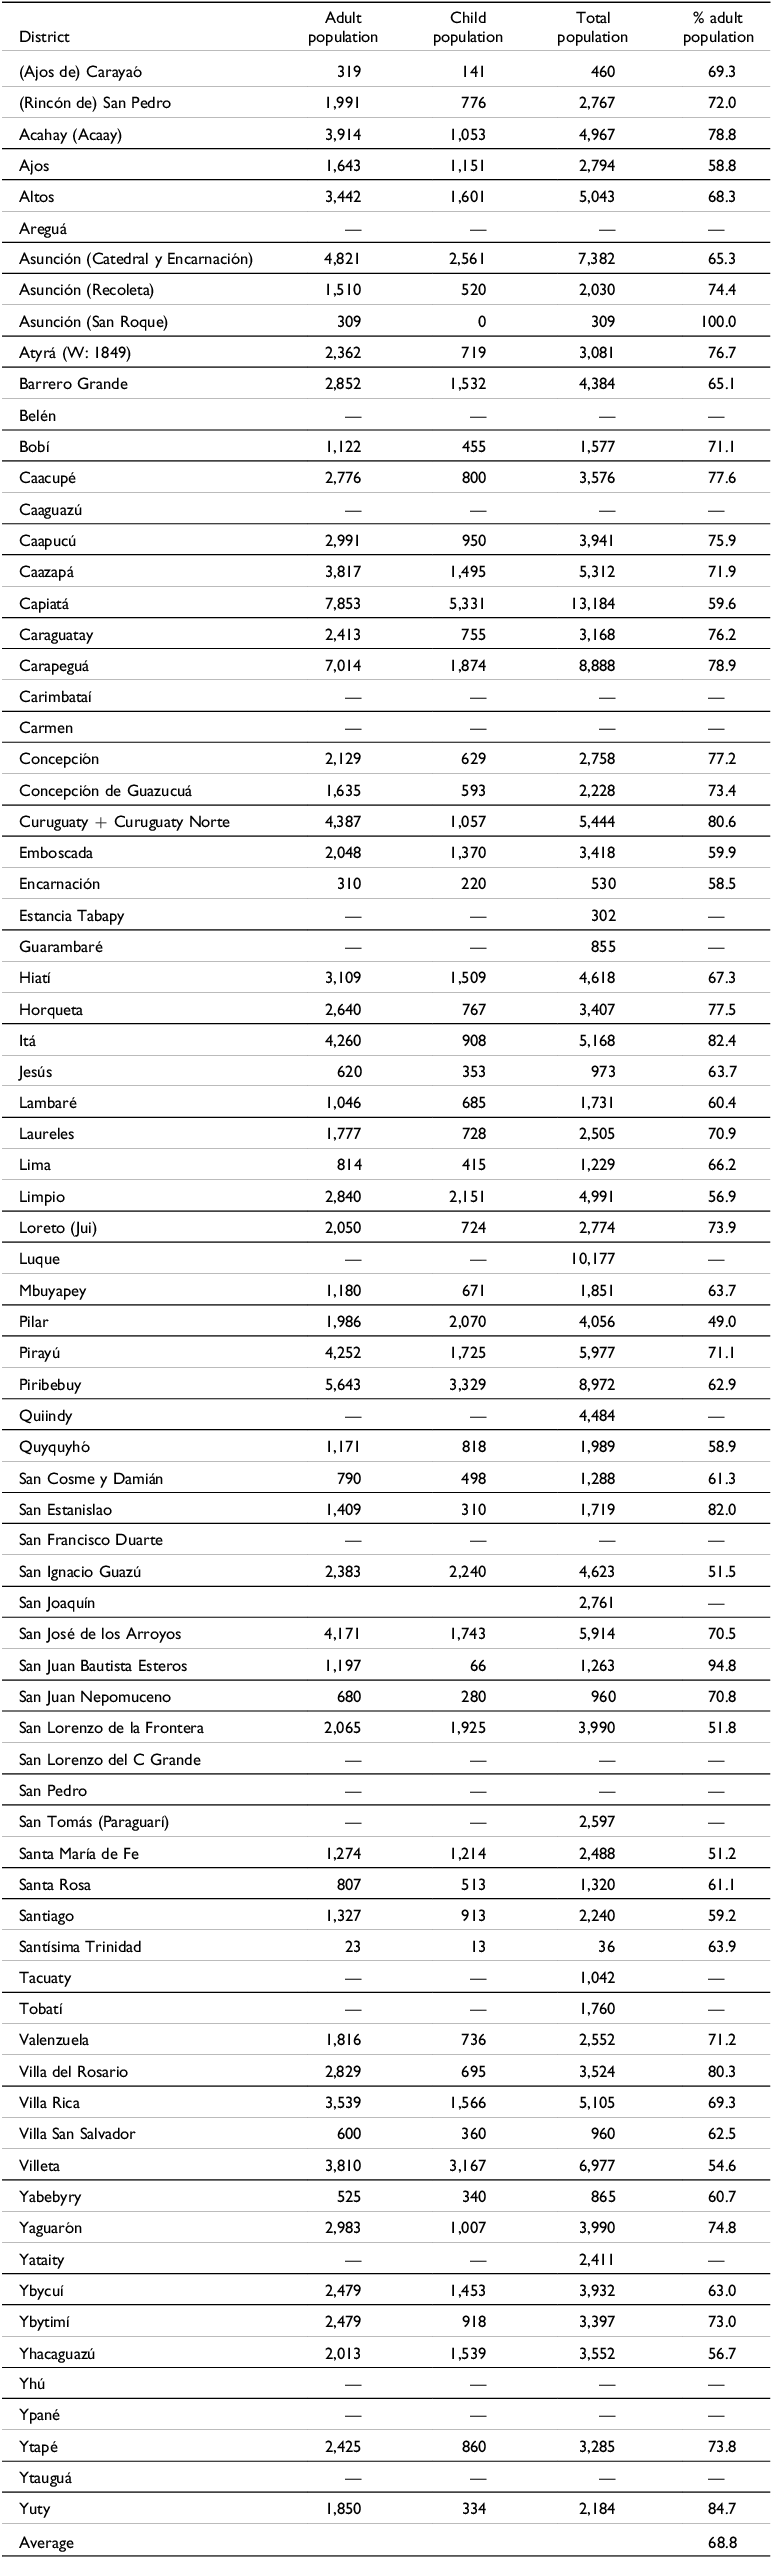


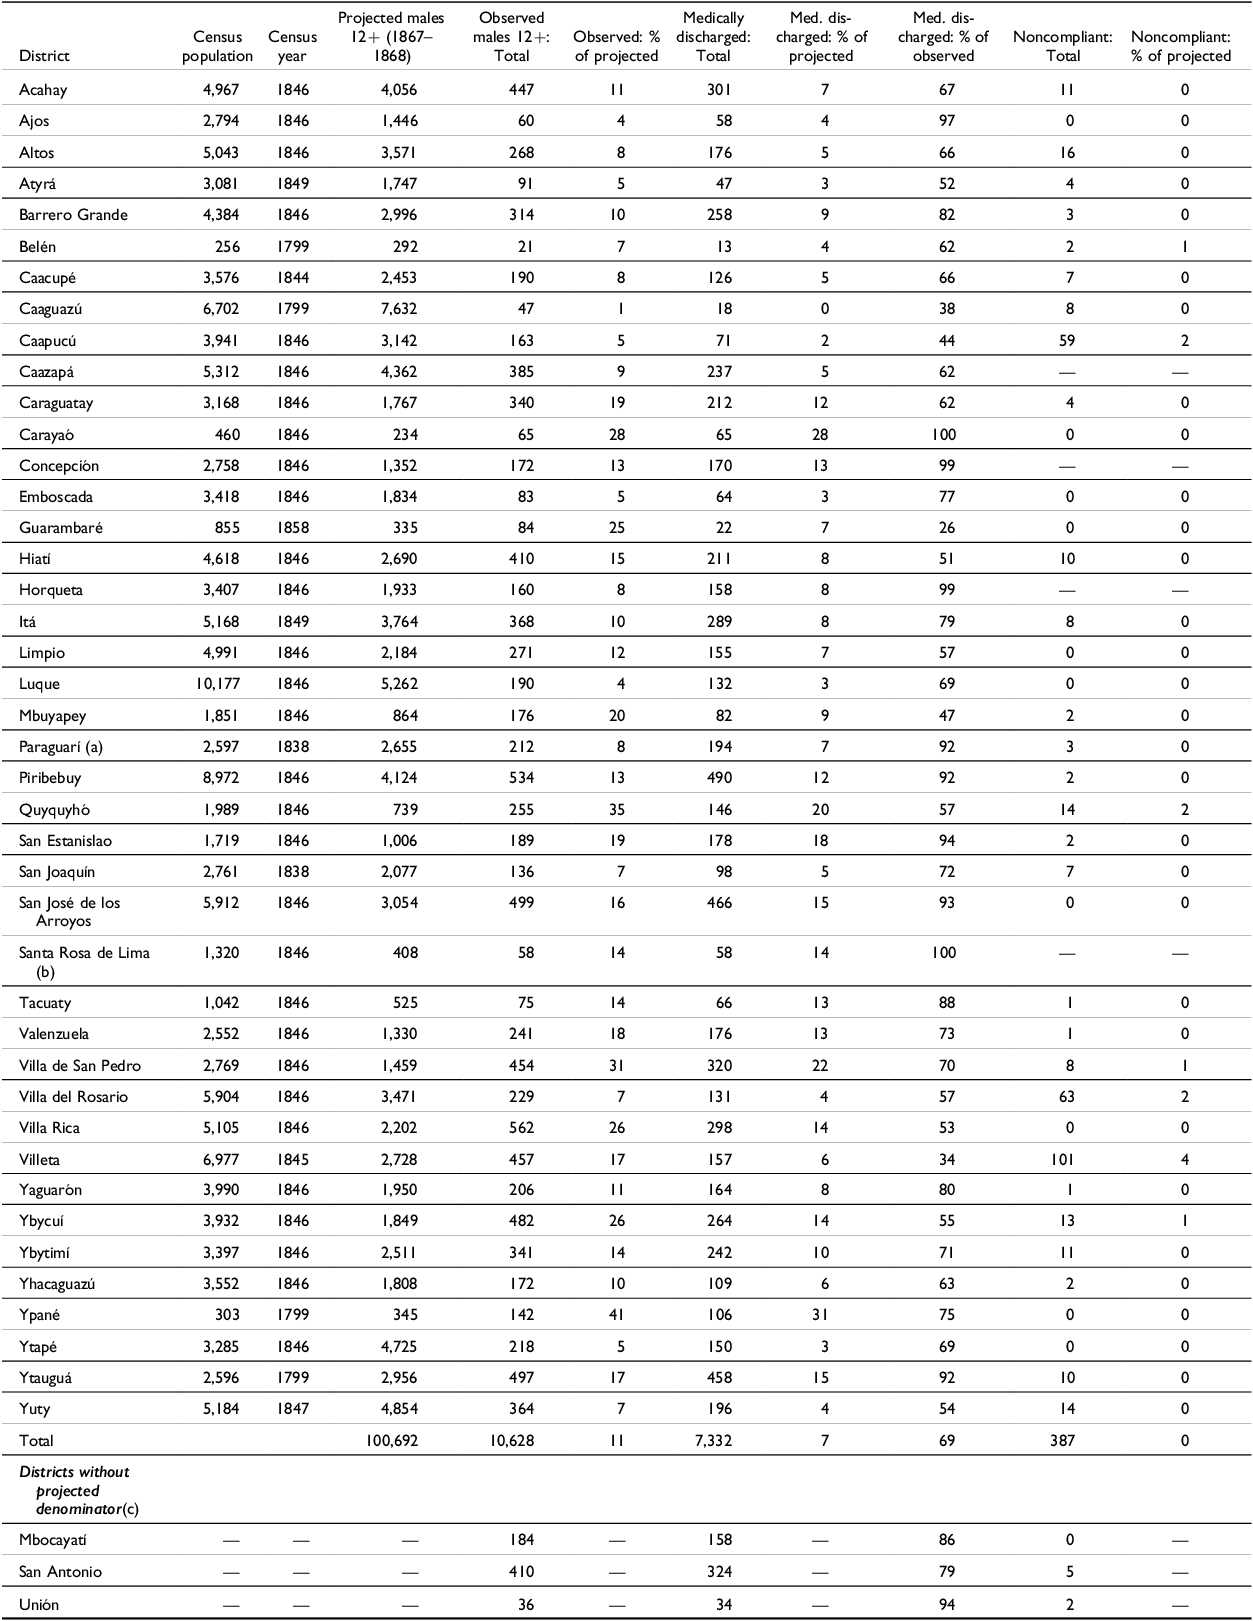
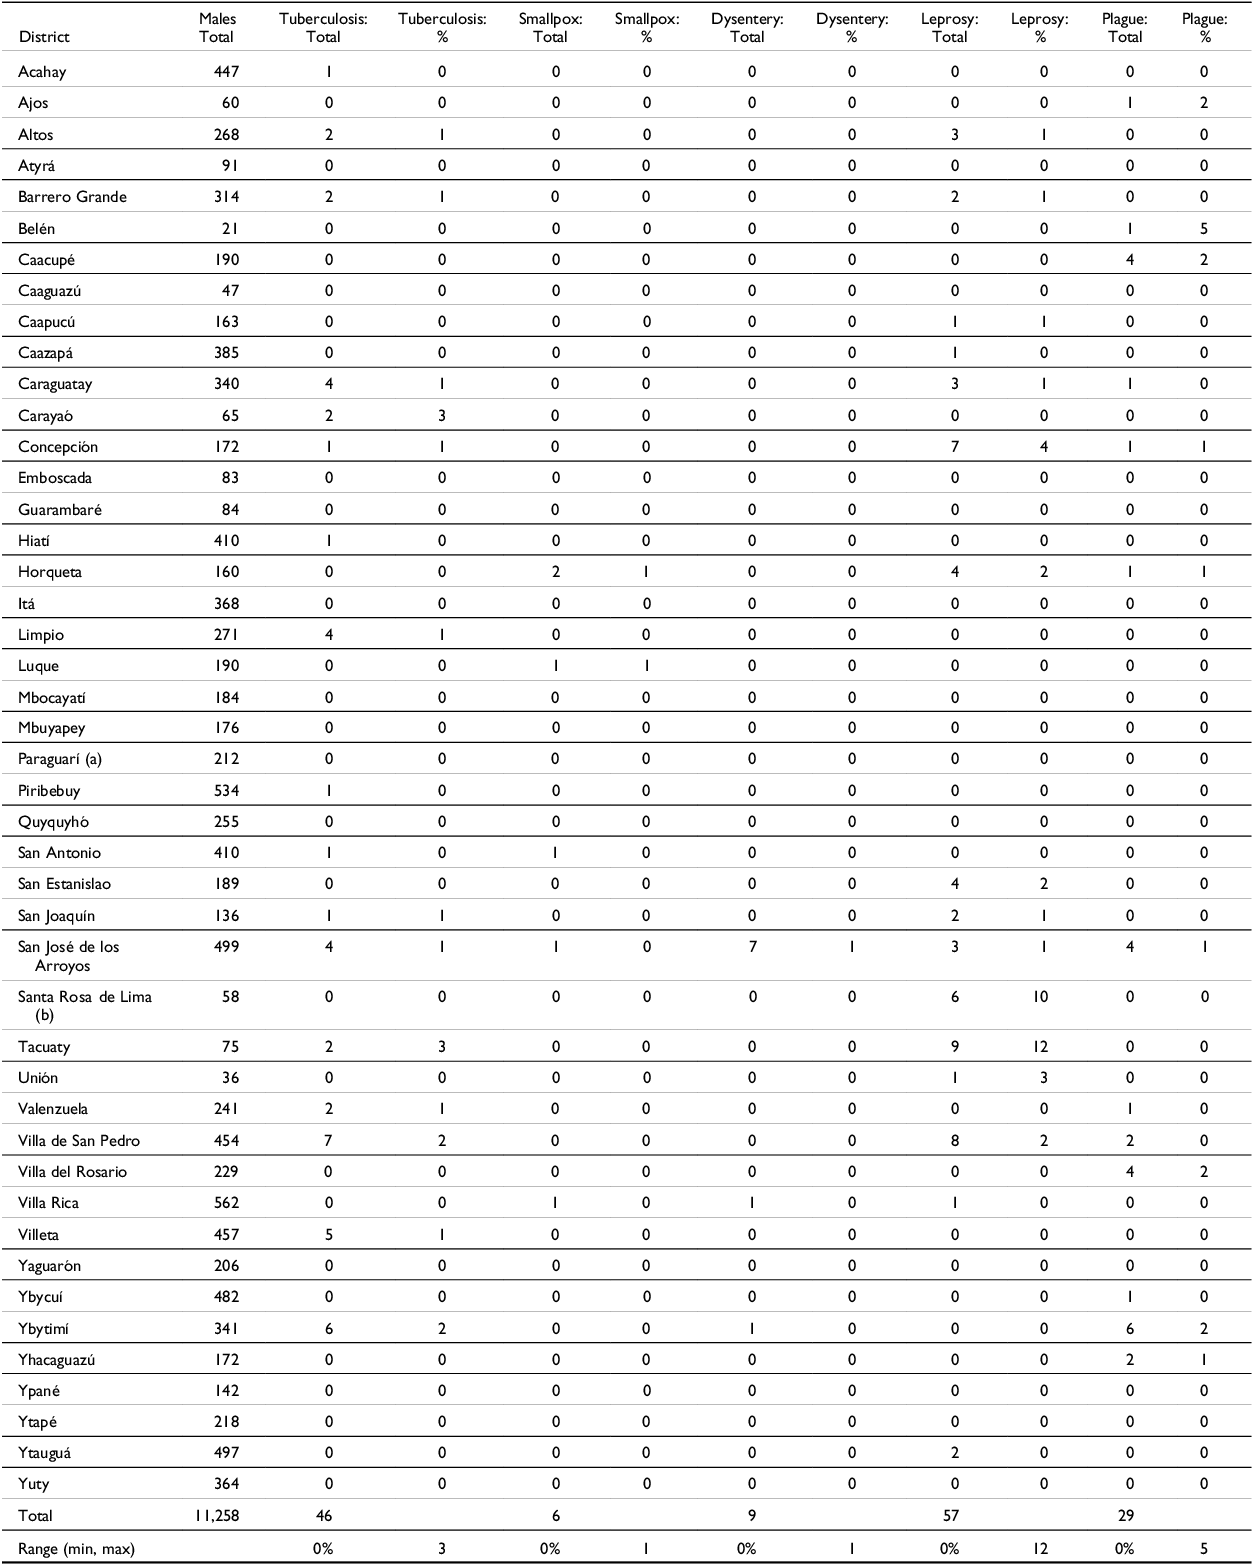

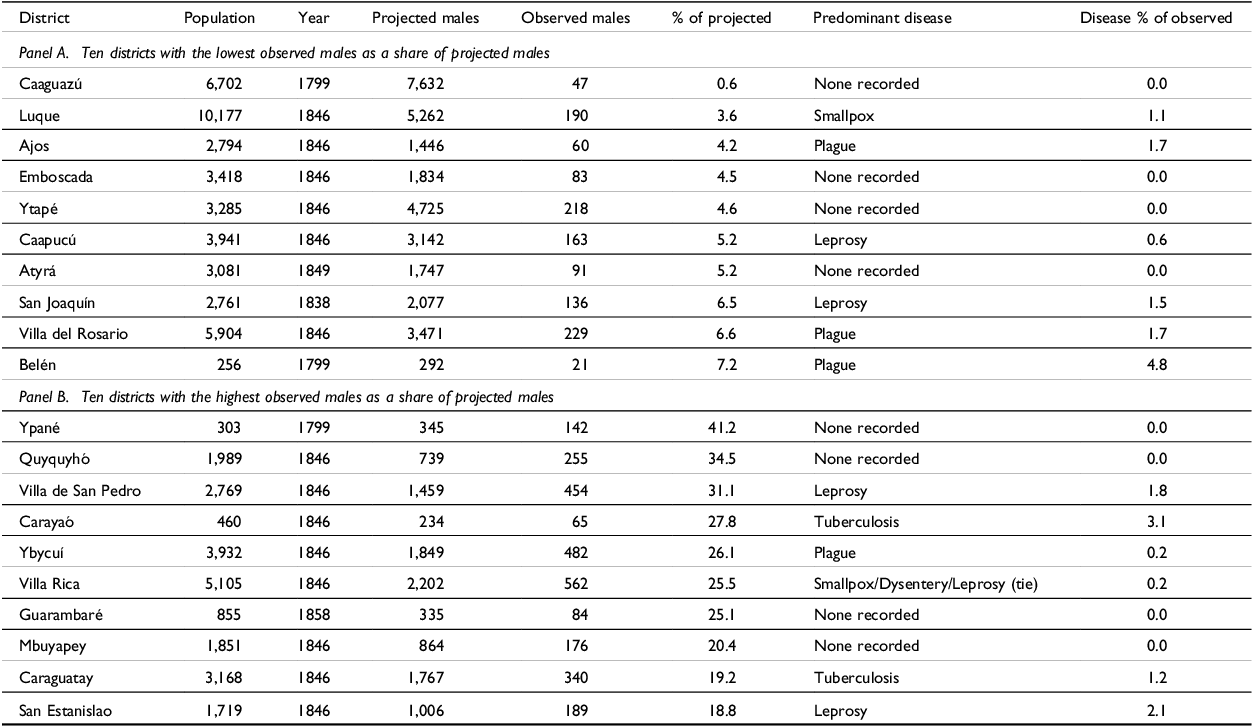


 Open access

