Introduction
In our daily lives, many materials can easily produce electrostatic accumulation, resulting in the occurrence of potentially harmful results, such as dust, electric shock and so on, which limits their applications. To eliminate the harm caused by static electricity, the preparation of antistatic coatings has become a hot spot of research [Reference Du, Han, Zhen and Wang1]. Acrylic resin has excellent properties because of its structural characteristics, such as aging resistance, chemical resistance, easy construction, and better decorative properties. Therefore, it is widely used in automotive, building, household appliances, glass, and other fields. In addition, water-based acrylic coatings hardly contain volatile organic compounds, which are more environmentally friendly and have gained increasing popularity over the years [Reference Bethencourt, Botana, Cano, Osuna and Marcos2, Reference Gonzalez, Mestach, Leiza and Asua3]. It is typical to prepare antistatic coatings by adding antistatic agents, but the surface hydrophobicity of the coatings is reduced, and the amount of the antistatic agents are high. Recently, carbonaceous materials and conductive compounds have been found that can also be used for preparing antistatic composite materials, such as graphene, carbon black, reduced graphene oxide (rGO), carbon nanotubes, multilayer graphene, and polythiophene, which have excellent electrical conductivity [Reference Li, Li, Da, Liu and Liu4, Reference Aal, El-Tantawy, Al-Hajry and Bououdina5, Reference Tang, Liu, Liu, Tang and Yuan6, Reference Sangermano, Pegel, Pötschke and Voit7, Reference Li, Liang, Lu, Tang, Hu, Cao and Liang8, Reference Li, Zhang, Du, Li and Zou9, Reference Wang, Liu, Liu, Luo, Lu and Sun10, Reference Wang, Xie, Fang, Ying, Tong and Zeng11, Reference Martins and Paoli12, Reference Wang, Zhang, Du, Li and Zou13].
The structure of graphene is two dimensional (2D) and consists of six-membered rings of sp 2-bonded carbon atoms, and it is the foundation of carbon nanotubes which are one-dimensional and three-dimensional graphite [Reference Lee, Wei, Kysar and Honel14, Reference Yuan, Bao, Qian, Jiang, Wen, Xing, Song, Liew and Hu15, Reference Wu, Huang, Wang, Lv, Chen, Li and Jiang16]. Because of its unique structure, graphene has outstanding electronic, thermal, and mechanical properties, which makes it widely used as a nanofiller in polymer matrices. However, the aggregation of graphene and poor interfacial bonding to the matrix limit its application. So far, several fabrication routes for the production of graphene have been established, such as micromechanical exfoliation, chemical vapor deposition, epitaxial growth, and the reduction of graphene oxide solution [Reference Allen, Tung and Kaner17]. In rGO, there are some oxidative functional groups that facilitate the use for the fabrication of composite materials [Reference Viculis, Mack and Kaner18].
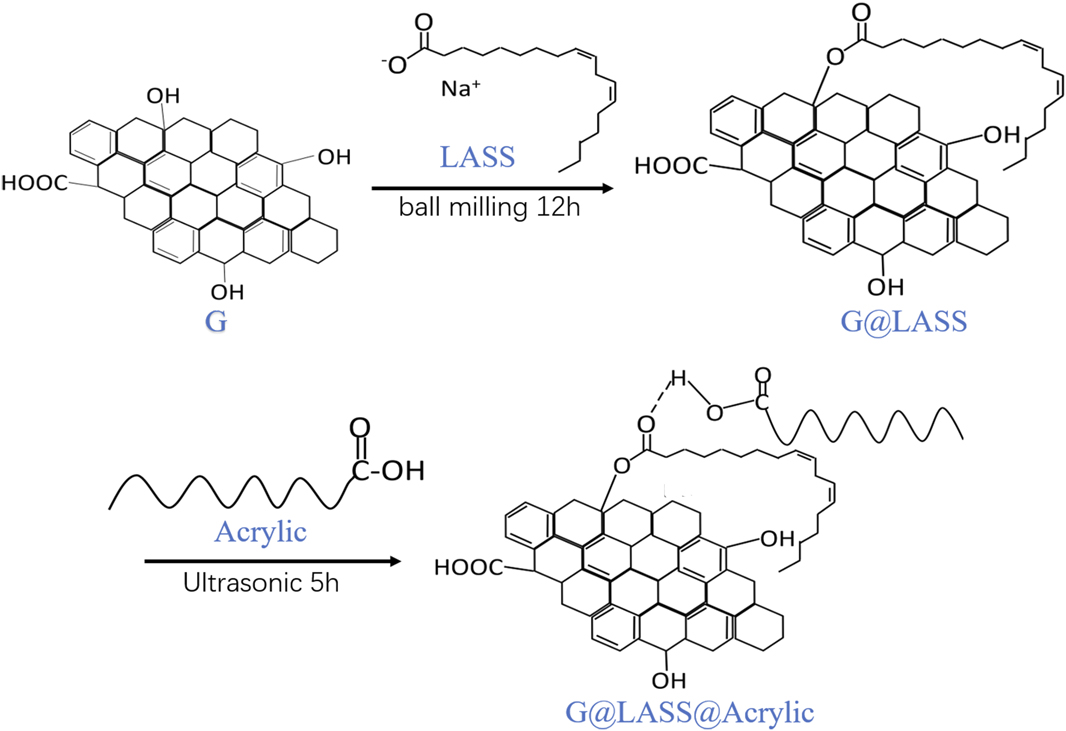
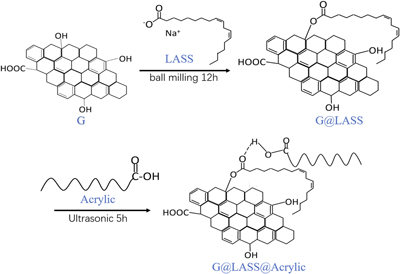
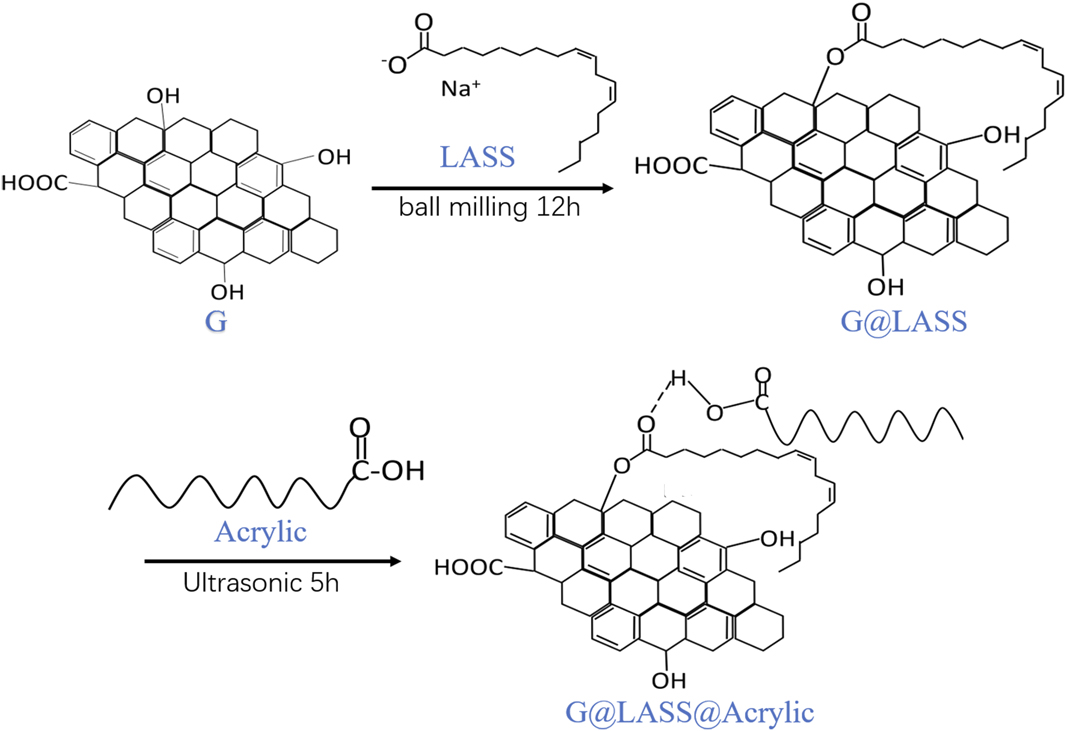
In this study, the antistatic acrylic coating was made with the well-dispersed graphene. The linoleic acid sodium salt (LASS) was used as stabilizers and dispersants, grafting to the graphene (G) by covalent functionalization. The graphene was made by the reduction of graphene oxide solution, so there is residual hydroxyl on the surface of G, which can react with the carboxyl of LASS. The grafting of long-chain alkanes can be inserted between layers, which can effectively increase the spacing of graphene and inhibit the aggregation of graphene. On the other hand, according to the principle of similar compatibility, the grafting of long-chain alkanes increases the oleophilic property of graphene, thus effectively increasing the dispersity of graphene. Additionally, the optimal ratio of G and LASS was 2:1. The G@LASS was prepared with a planetary ball milling instrument; this process can be used for production in a large quantity because it is eco-friendly. The G@LASS was mixed with acrylic resin matrix via ultrasound. The ester group formed in the G@LASS combined with the carboxyl group in the acrylic to form the hydrogen bond. The interfacial adhesion, stability, and dispersity were enhanced by the generation of the hydrogen bond. Composites with 0.5 wt% G can achieve high-performance antistatic properties. The experimental process is demonstrated in Fig. 1.
Schematic illustration of the experimental process.
Results and discussion
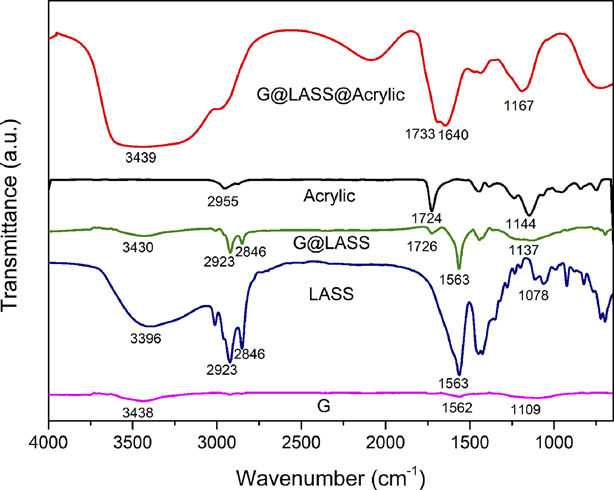
Figure 2 is the FTIR spectra of G, LASS, G@LASS, acrylic, and G@LASS@Acrylic. As shown in Fig. 2, the FTIR spectra of G, LASS, G@LASS, acrylic, and G@LASS@Acrylic are different. For the G, the peaks at 3438, 1562, and 1109 cm−1 were assigned to the stretching vibration of O–H group, C=C stretching vibration, and C–O stretching vibration separately [Reference Liu, Zhang, Yan, Zhang and Liu19, Reference Das, Maiti and Khatua20]. The FTIR results show that O–H group exists in the G which led to the great interaction with the LASS. For the LASS, the bands located at 3396, 2920, 2846, 1563, and 1078 cm−1 were attributable to the O–H vibrations, C–H symmetric stretching vibrations [Reference Larouche and Stansfield21], C–H asymmetric stretching vibrations, C=O stretching vibrations, and C–O stretching vibrations, respectively. In the G@LASS, the existence of the bands at 1726 and the 1137 cm−1 corresponded to the ester bond. In addition, the bands at 2920 and 2846 cm−1 in LASS also appeared in the G@LASS, which illustrated the reaction between G and LASS. For the acrylic, the peaks at 1724 and 1144 cm−1 assigned to the C=O stretching vibrations and C–O stretching vibrations proved the carboxyl existed. For the G@LASS@Acrylic composites, the bands located at 3439 cm−1, 1733 cm−1, 1640 cm−1, and 1167 cm−1 were ascribed to the O–H vibrations, C=O stretching vibrations, C=C stretching vibrations, and C–O stretching vibrations, respectively. Compared with the pure acrylic, there were characteristic peaks at approximately 3439 cm−1 that was broad and diffused, which implies the existence of the hydrogen bond and indicates the interaction between the ester group of the G@LASS and the carboxyl group of the acrylic. It also corresponds to Fig. 1 to explain the reaction. The results demonstrate that great interactions were built between G and acrylic, G@LASS@Acrylic composites, which were successfully prepared by ultrasonic mixing.
FTIR spectra of G, LASS, G@LASS, acrylic, and G@LASS@Acrylic.
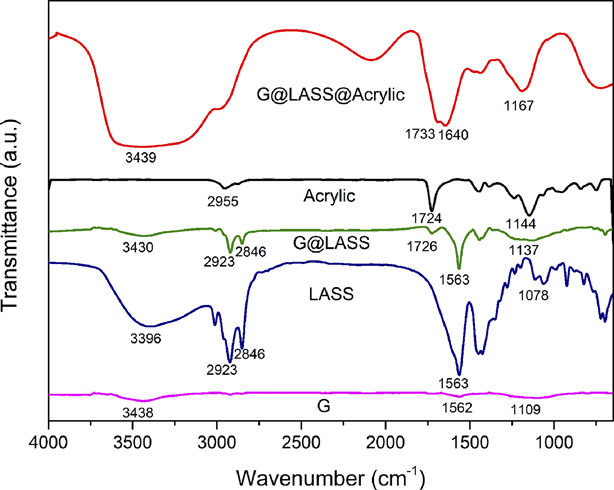
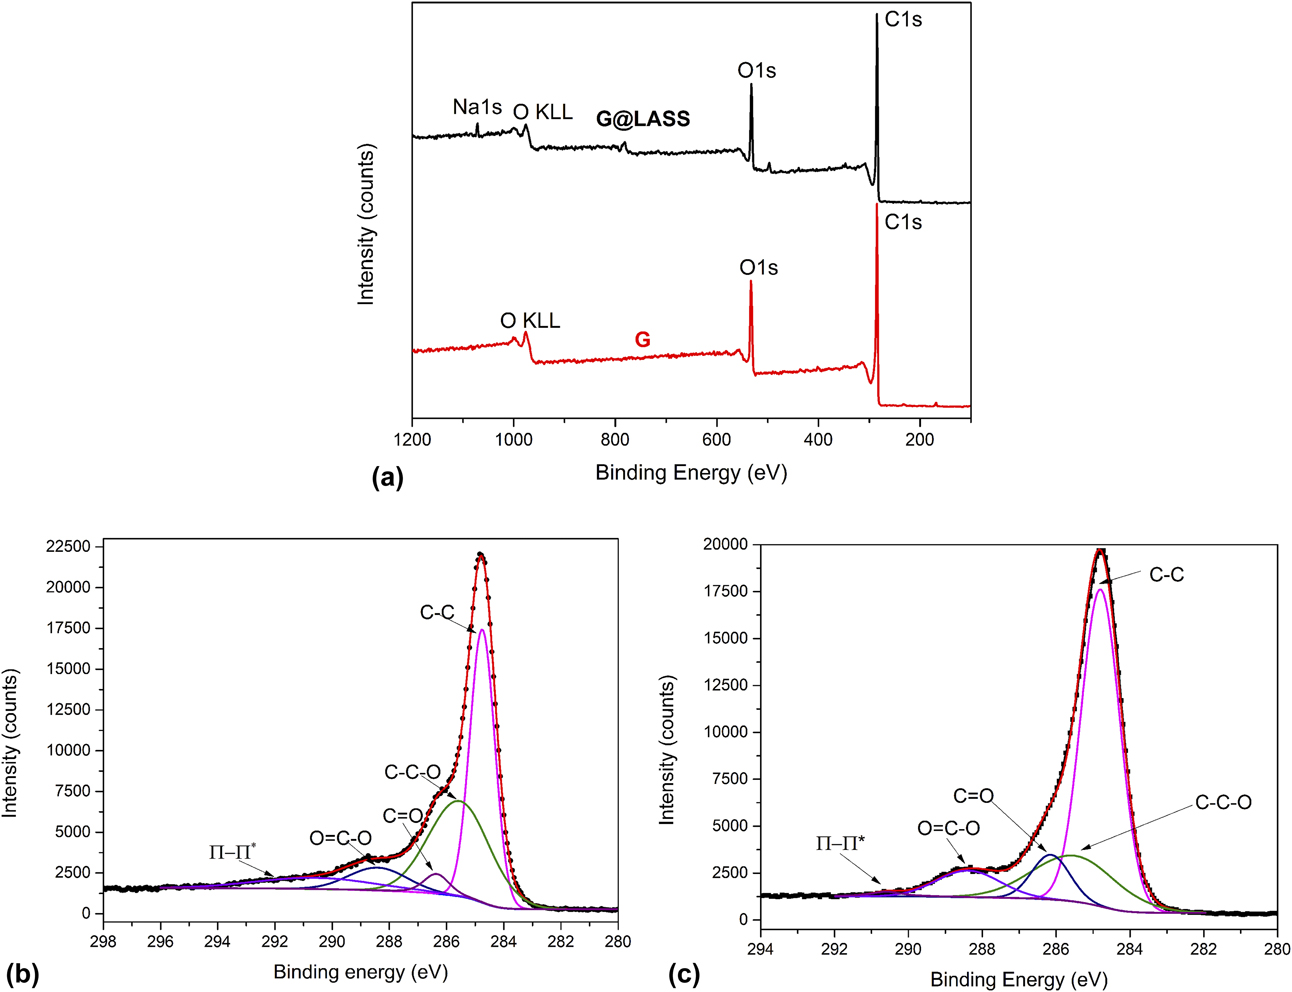
Figure 3 is the XPS analysis of G and G@LASS. The XPS survey scan spectra of G and G@LASS are shown in Fig. 3(a). The C 1s (285 eV) and the O 1s (533 eV) appeared in the two samples. In addition, the peak at 978 eV corresponds to oxygen [Reference Li, Liu, Fu, Li, Wu and Guo22]. However, the difference between the two samples appeared in the location of 1077 eV. This represents the element Na, which proved LASS grafted on the G successfully. The XPS C 1s spectra for the G and G@LASS samples are shown in Figs. 3(b) and 3(c). The high-resolution C 1s spectrum of the G was deconvoluted into different functional groups. The main peak centered at 284.7 eV was attributed to extensively delocalized sp 2-hybridized carbon atoms [Reference Mao, Jiang, Wu, Zhang and Wang23]. The bands centered at 285.56 eV, 286.35 eV, 288.41 eV, and 290.59 eV were assigned to the C–O, C=O, O=C–O, and π–π* transition shake-up band, respectively [Reference Ryu, Lee, Hwang, Hong, Kim, Park, Lee and Hong24, Reference Ryu, Chou, Lee, Lee, Hong, Zhao, Lee and Kim25]. These groups also existed in the G@LASS and the bands were at the same position. However, the content of C=O and O=C–O increased from 11.9% in G to 17.11% in G@LASS. This is because the hydroxyl on the surface of G and the carboxyl in the LASS reacted resulting in the appearance of an ester group. The result is also reflected in the FTIR results indicating that LASS was successfully grafted on the G.
XPS survey scan spectra of G and G@LASS (a), carbon fitting spectra of G (b), carbon fitting spectra of G@LASS (c).
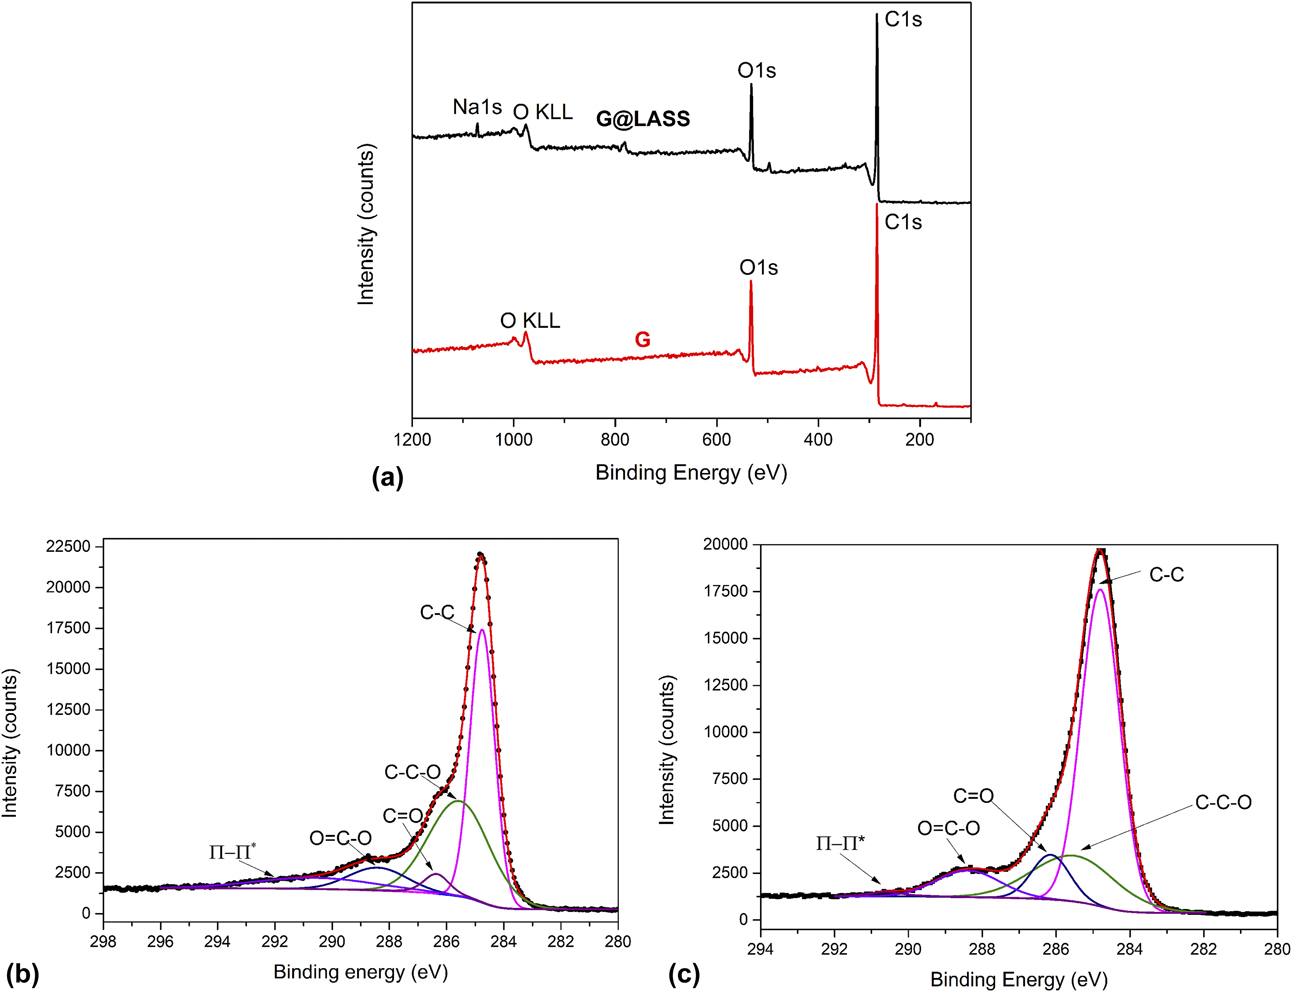
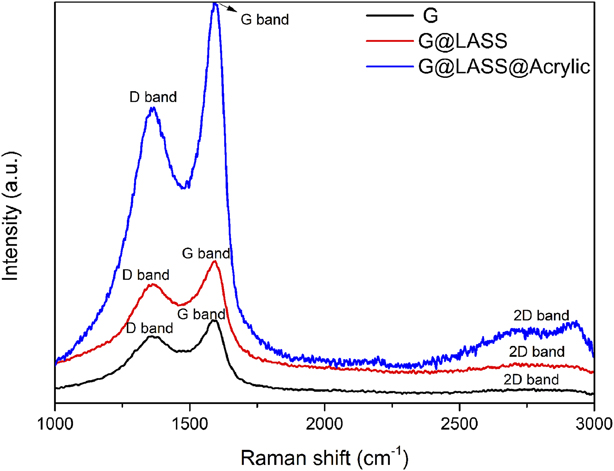
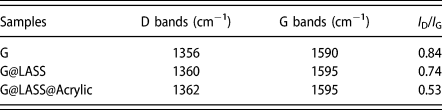
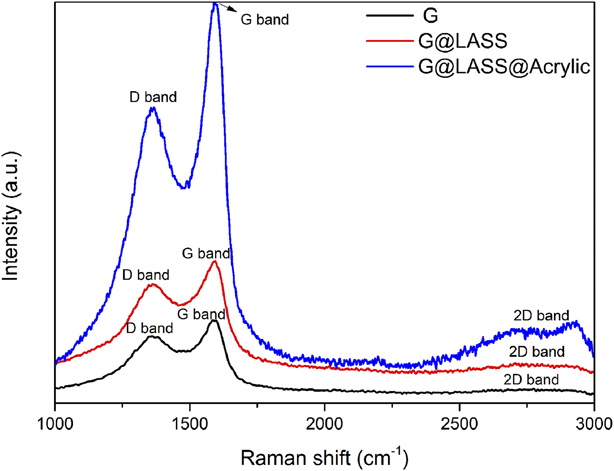
Figure 4 illustrates Raman spectra of G, G@LASS, and G@LASS@Acrylic. Raman spectroscopy is used to detect the structural changes by analyzing the D band, G band, and 2D band [Reference Valentini, Bon, Lopez-Manchado, Verdejo, Pappalardo, Bolognini, Alvino, Borsini, Berardo and Pugno26]. For the G, the signals at the 1356 cm−1, 1590 cm−1, and 2730 cm−1 corresponded to the D, G, and 2D bands, respectively [Reference Cançado, Jorio, Martins Ferreira, Stavale, Achete, Capaz, Moutinho, Lombardo, Kulmala and Ferrari27, Reference Li, Cai, An, Kim, Nah, Yang, Piner, Velamakanni, Jung, Tutuc, Banerjee, Colombo and Ruoff28]. The D band indicates the structural defects and disorder in carbon lattice, and the bond stretching of sp 2 hybridized carbon atoms reflects via the G band. Because the graphene was made by a chemical method, the 2D peak was diffuse. The existence of a diffuse 2D peak also proved that the carbon atom of the graphene had a certain degree of recovery [Reference Su, Du, Sun, Liu and Cheng29]. The 2D band corresponds to the number of stacked graphene layers [Reference Messina, Leone, Foti, Marco, Riccucci, Carlo, Maggio, Cassata, Gargano, D’Andrea, Fazio, Maragò, Robba, Vasi, Ingo and Gucciardi30, Reference Marra, D’Aloia, Tamburrano, Ochando, Debellis, Ellis and Sarto31]. The ratio of I D/I G is always used to reflect the defects of the G [Reference Shulga, Baskakov, Abalyaeva, Efimov, Shulga, Michtchenko, Lartundo-Rojas, Moreno-R, Cabañas-Moreno and Vasilets32]. As for the G@LASS, the bands at the 1360 cm−1, 1595 cm−1, and 2716 cm−1 were assigned to the D, G, and 2D bands, respectively. The G band was blue shifted from 1590 for G to 1595 cm−1 for G@LASS, indicating that a charge transfer existed between G and LASS and there is strong covalent interaction. For the G@LASS@Acrylic, the bands at the 1362 cm−1, 1595 cm−1, and 2721 cm−1 were assigned to the D, G, and 2D bands, respectively. The characteristic bands of G@LASS in the G@LASS@Acrylic composites confirmed that the G was successfully reacted with LASS because of the formation of strong interactions; this also proved that the G@LASS@Acrylic composites were successfully prepared via the hydrogen bond. The I D/I G ratio of G, G@LASS, and G@LASS@Acrylic are displayed in Table I. The lower I D/I G ratio for the G@LASS and G@LASS@Acrylic indicates recovery of the sp 2 structure, which was correlated to the introduction of the C=C of the LASS. The results also correspond with the results of XPS.
Raman spectra of G, G@LASS, and G@LASS@Acrylic.
The parameter of the I D/I G of the G, G@LASS, and G@LASS@Acrylic

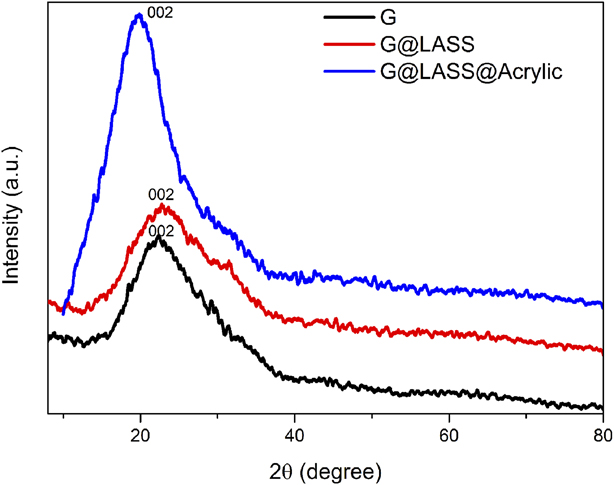
Figure 5 displays XRD pattern of G, G@LASS, and G@LASS@Acrylic. For the graphene, the peak located at 2θ of 22.5° corresponds to the (002) crystal plane of graphite nanoplates [Reference Li, Zhu, Wei, Ryu, Sun and Guo33]. Because the graphene was reduced by a reducing agent, some polar functional groups exist, so no obvious diffraction peaks could be observed in the XRD. There was only a particularly weak wide peak near 20°. As for the G@LASS, it was obvious that the peak in the graphene still existed in the composites. This indicates that the original crystalline structure of graphene was not destroyed via the covalent reaction with LASS. For the G@LASS@Acrylic composites, it was clear that when the G@LASS was introduced, a peak attributing to the G emerged in the XRD patterns of the composites, and this peak was located at 2θ of 19.89°. According to Bragg’s law 2d sin θ = nλ, it is obvious that the interlayer spacing of G@LASS@Acrylic composites was larger than G. This is likely because part of the acrylic molecular chain is intercalated into the layer, which increases layer spacing and also limits aggregation of G. The result demonstrates that G was effectively grafted by LASS.
XRD patterns of G, G@LASS, and G@LASS@Acrylic.
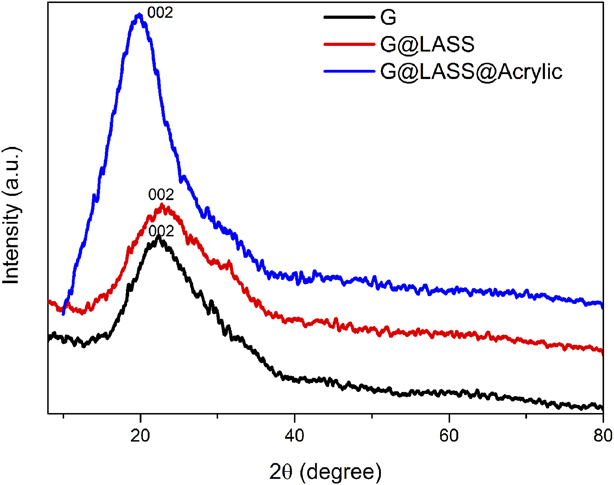
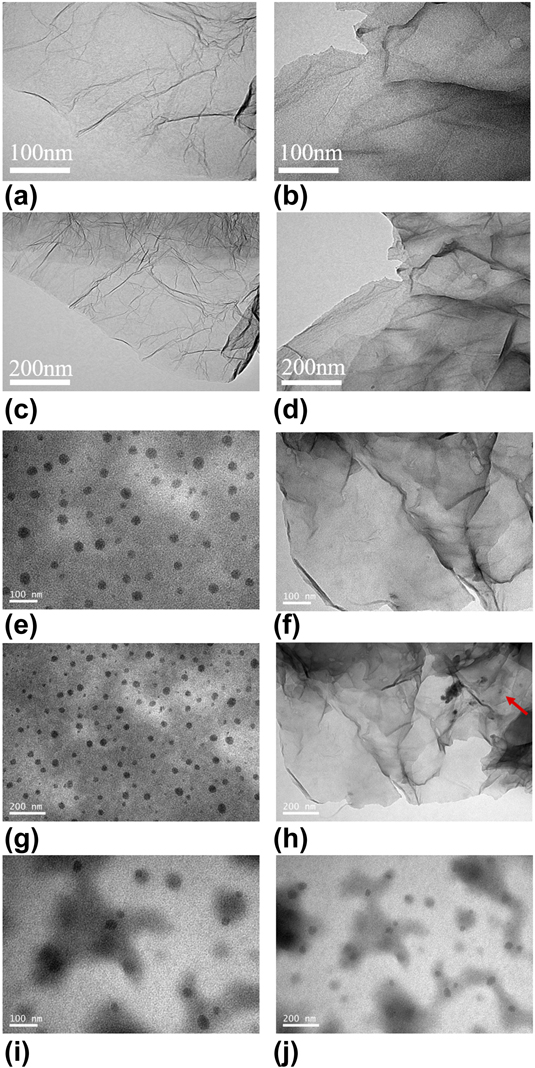
Figure 6 shows TEM micrographs of the G, G@LASS, acrylic, G@LASS@Acrylic, and G@Acrylic. It can be observed in Figs. 6(a) and 6(c) that the graphene was translucent and slightly wrinkled. Figures 6(b) and 6(d) demonstrate that the G@LASS was tough and that the transparency decreased dramatically, which indicates the LASS was coated on the surface of the G successfully. It also indicates that G@LASS was produced through the strong covalent interaction. Figures 6(e) and 6(g) show that the acrylic was homogenous and the particle could be seen clearly. As shown in Figs. 6(f) and 6(h), the G@LASS was uniform in the acrylic matrix. And it is obvious that the G was still slightly translucent, and there were acrylic particles coated on the G, which are marked in red in Fig. 6(h). This reflects the good compatibility between the G@LASS and acrylic and the successful preparation of G@LASS@Acrylic. Figures 6(i) and 6(j) show G@Acrylic without LASS. The G aggregated and did not have good compatibility with the acrylic. Graphene, LASS, and acrylic had some polar groups, and LASS played the important role of compatibilizer, contributing to the G@LASS being dispersed homogenously in the acrylic. Therefore, it resulted in the improvement in the antistatic properties of the G@LASS@Acrylic.
TEM images of the G (a, c), G@LASS (b, d), acrylic (e, g), G@LASS@Acrylic (f, h), and G@Acrylic (i, j).
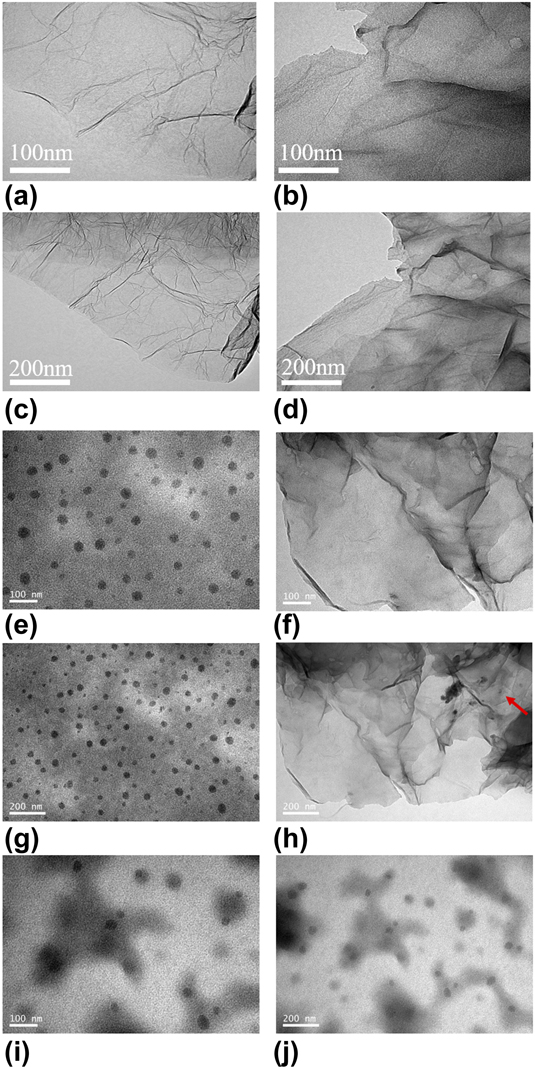
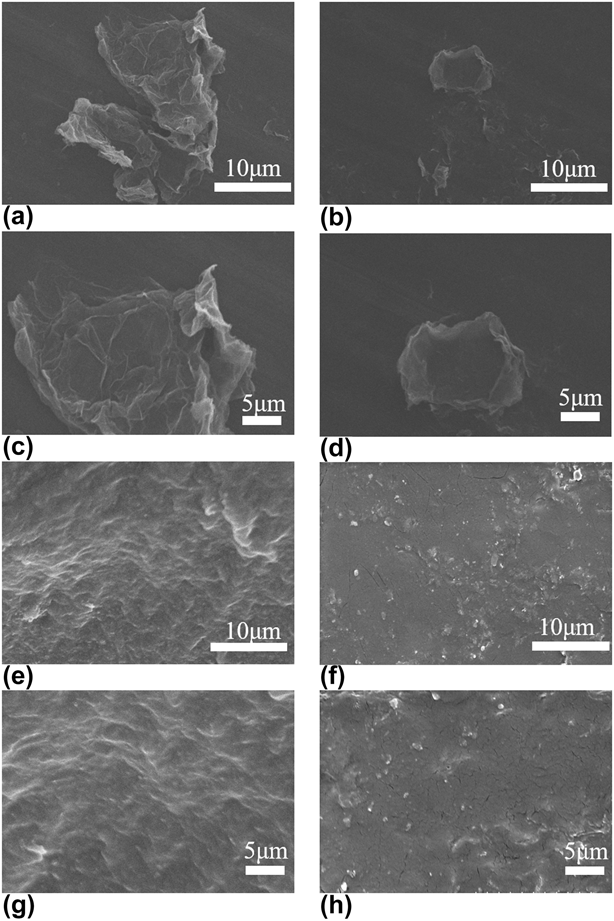
Figure 7 shows the FESEM micrographs of G, G@LASS, acrylic, and 1 wt% G@LASS@Acrylic composites. Figures 7(a) and 7(c) show that the morphology of G was flaky and translucent, and there was a little fold on the smooth surface of G. As illustrated in Figs. 7(b) and 7(d), the surface of G@LASS was a little rough; this also proved that the G was grafted by LASS successfully via covalent reaction. In Figs. 7(e) and 7(g), it was clear that the phase of acrylic matrix was relatively homogeneous. The dispersion of the G@LASS was consistent in the polymer matrix, as displayed in Figs. 7(f) and 7(h). The compatibility between the G@LASS and the acrylic matrix was excellent. The result strongly confirms that G@LASS@Acrylic was prepared successfully by grafting LASS onto G. It strongly confirms that the excellent interfacial compatibility between G@LASS and acrylic matrix, as well as the good dispersibility of G@LASS in acrylic matrix, was essential for the establishment of the conductive pathways in the coatings.
SEM micrographs of G (a, c), G@LASS (b, d), acrylic matrix (e, g), and 1 wt% G@LASS@Acrylic (f, h).

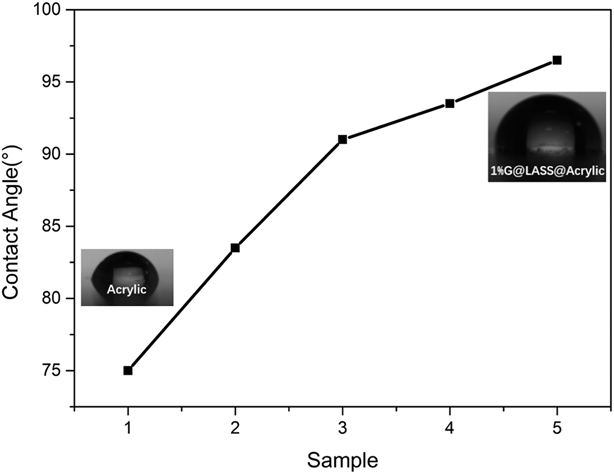
Figure 8 shows the contact angle of samples with different weight percentages of G. It was clear that the contact angle increased significantly with the increase of graphene. Compared with acrylic matrix, the contact angle was nearly 90° for 0.5 wt% G. This reflects that adding graphene can improve the surface hydrophobicity. The good dispersion and compact structure helped prevent water from permeating the acrylic matrix so that the composites had excellent water resistance [Reference Da, Wang, Geng, Jia, Xu, Li, Shi and Li34].
Contact angles of acrylic (Sample 1), acrylic@LASS (Sample 2), 0.5 wt% G@Acrylic@LASS (Sample 3), 0.8 wt% G@ Acrylic@LASS (Sample 4), and 1 wt% G@Acrylic@LASS (Sample 5).

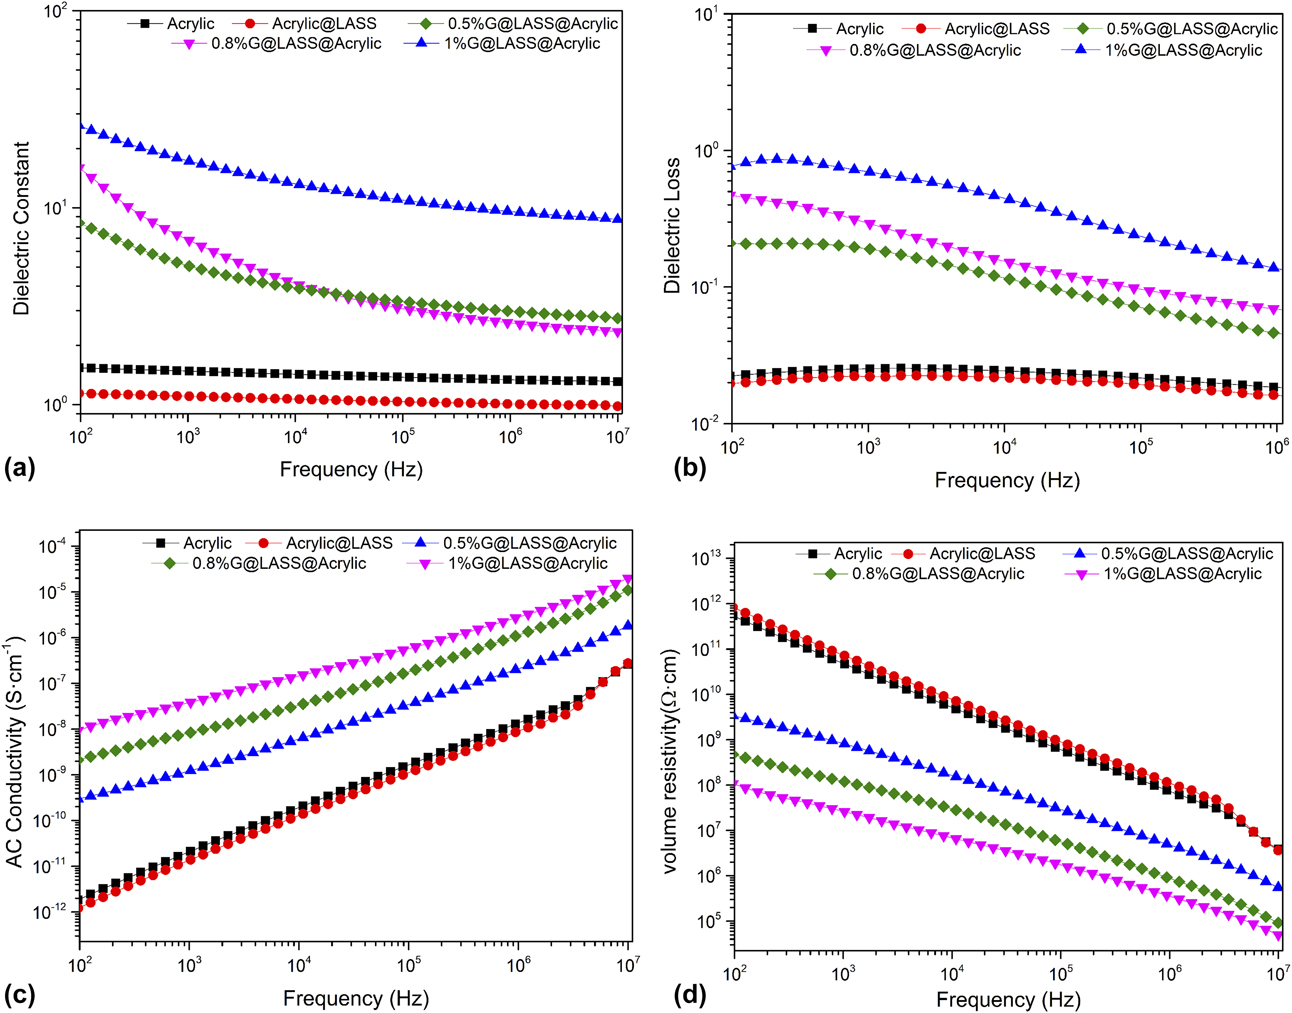
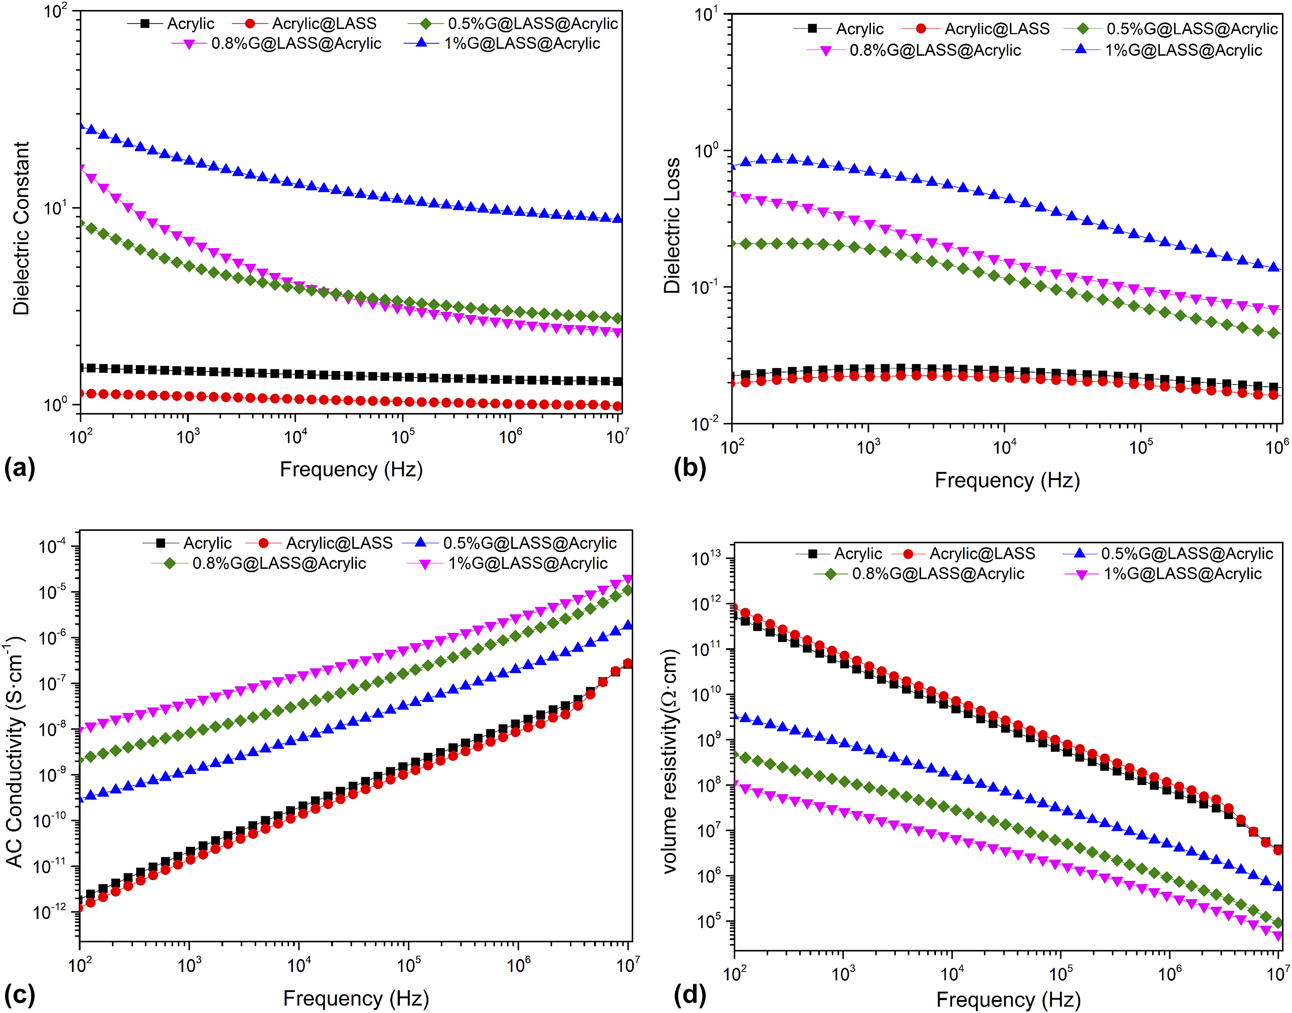
Figure 9 presents the relationship between the dielectric constant, the dielectric loss, the alternating current (ac) conductivity, volume resistivity, and the frequency of G@LASS@Acrylic composites with different percentages of graphene as well as the blank samples. For Fig. 9(a), the dielectric constant of the acrylic increased significantly with only 0.5 wt% G. For 1 wt% G, the dielectric constant was nearly 20 times larger than the acrylic at 102 Hz. This reflects that, as conductive fillers, graphene had a homogeneous dispersion and good connection with the polymer matrix acrylic to form several microcapacitors; this resulted in the dielectric constant to increase dramatically [Reference Yu, Qin and Wang35]. The decrease in dielectric constant in the range of 102–107 Hz was due to the blockage of acrylic matrix, which led some part of G@LASS to remain electrically insulated. In this case, the external frequency disturbances could easily destroy the percolation network [Reference Dang, Wang, Yin, Zhang and Lei36]. As illustrated in Fig. 9(b), the dielectric loss of the G@LASS@Acrylic increased notably with increasing content of G@LASS because the electrical conductivity increased greatly. The volume resistivity is shown in Fig. 9(d). According to the value of the volume resistivity (ρv), the polymer materials can be divided into insulators (ρv > 1 × 10¹² Ω cm), semiconductors (ρv = 1 × 10⁶ Ω/cm × 1012 Ω cm) and conductors (ρv < 1 × 10⁶ Ω cm) as three major categories. Normally, when the ρv of the polymer material is between 1 × 10⁶ and 1 × 10¹² Ω cm, it can meet the requirements of material antistatic performance [Reference Yu, Qin and Wang35]. The volume resistivity of G@LASS@Acrylic was 1.14 × 10⁸ Ω cm, 4.61 × 10⁸ Ω cm, and 3.33 × 10⁹ Ω cm with different content of G, 1 wt%, 0.8 wt%, and 0.5 wt%, respectively, indicating its use as an antistatic material.
The variation of (a) dielectric constant, (b) dielectric loss, (c) ac conductivity, and (d) volume resistivity along with the change of frequency of the G@LASS@Acrylic with different G contents.
Conclusion
In this paper, an environmentally friendly and low-cost method in which LASS chains could be coated onto the surface of G by the covalent reaction via the ball milling process was demonstrated. LASS was used as the stabilizer and dispersant for its hydroxyl groups and low cost. This method overcame the aggregation of G and realized great interfacial compatibility between the G@LASS and the acrylic matrix. Consequently, the G@LASS@Acrylic was prepared successfully and the composites had excellent antistatic performance. The volume resistivity reached 3.33 × 10⁹ Ω cm with 0.5 wt% G. In addition, the graphene also improved the surface hydrophobicity of the G@LASS@Acrylic. As a result, the highly antistatic acrylic coatings with good surface hydrophobicity could be put into use in many industrial fields in future.
Experiment
Materials
Graphene was purchased from Suzhou TanFeng Graphene Technology Co., Ltd. (Suzhou, China), with the thickness about 0.5–3 nm (rGO). LASS (AR, ≥95.0%) was purchased from Guangdong WengJiang Chemical Reagents Co., Ltd. (Guangzhou, China), with the molecular weight of 302.43. Acrylic resin (brand name is NeoCryl® A-1127), is a self cross-linking acrylic copolymer and was purchased from DSM Shanghai Co., Ltd. (Heerlen, the Netherlands). The PH value is 7.3–7.9 and its viscosity is 25–175 mPa s. The minimum film forming temperature is approximately 7 °C, and the total solid (%w/w) is 43–45%. Alcohol (absolute ethyl alcohol, AR, ≥95.0%) was purchased from Shanghai Aladdin Biochemical Technology Co., Ltd. (Shanghai, China). Deionized water was also used in this study. All the chemicals were used directly without further purification.
Modification of graphene
G@LASS was prepared by mixing in the planetary ball milling (QM-1SP2, Nanjing University Instrument Plant). Some agate balls were chosen, which can overspread the bottom of the ball milling to guarantee effective grinding. Briefly, the G and LASS were added into the agate jar with the weight ratio of 10:1, 5:1, 2:1, and 1:1 respectively. The solvent was deionized water and alcohol, and the total value was 60 g, which can submerge the agate balls; the weight ratio of water and alcohol was 2:1. The rotation time was 12 h and the speed was 350 r/min. Likewise, the G without LASS was processed as a blank sample.
Preparation of the G@LASS@Acrylic composites
In this study, the optimal weight ratio of G and LASS was 2:1. Then, the G@LASS was added into the acrylic resin with different weight percentage of G, 0.5%, 0.8%, and 1%. The G@LASS@Acrylic was ultrasonicated for 5 h at the frequency of 150 W to obtain a homogeneous solution. In addition, the pure acrylic resin and the mixture of acrylic and LASS (Acrylic@LASS) were also produced for the purpose of comparison. The composites were put into a glassy dye (60 mm × 60 mm × 10 mm) and dried at 80 °C in the oven for antistatic measurement. The others were coated on the polyethylene terephthalate (PET) by the wire bar coater.
Characterization
Fourier-transform infrared spectroscopy (FTIR) spectra were recorded on a Nicolet 6700 spectrometer with the wavenumber range of 4000–500 cm−1. The G, LASS, and G@LASS (Thermofisher, Waltham City, Massachusetts) were in powder form and they were compressed with KBr into pellets. The solution of acrylic G@LASS@Acrylic was dropped directly on a tablet of KBr.
Raman spectra were obtained at an excitation wavelength of 514 nm on an inVia™ Raman microscope (Renishaw, Gloucestershire, London, England). Three bands (D band, G band, and 2D band) were collected to evaluate the tiny structure change of the samples.
X-ray diffraction (XRD) was acquired via a D8 Advance XRD device (Bruker, Karlsruhe, German) from 10° to 70°. The liquid was dried at 90 °C and cut into pieces with the dimensions 10 × 10 × 2 mm3.
The elements’ composition and the functional group of the G and G@LASS were characterized by X-ray photoelectron spectroscopy (XPS) (ESCALAB 250Xi, Thermofisher, Waltham City, Massachusetts).
The internal structure of the samples was obtained with a transmission electron microscope (TEM) (JEM-1400, JEOL, Tokyo, Japan). The powered samples were dispersed in EtOH and sonicated for 10 min, then dropped on a microgrid. The bulk samples were prepared as an ultrathin layer.
Scanning electron microscopy (SEM; Hitachi S3400, Hitachi Corp., Tokyo, Japan) and field emission scanning electron microscopy (FESEM; Hitachi S4800, Hitachi Corp., Tokyo, Japan) were conducted to analyze the surface morphology of the samples. Powered samples were dispersed in EtOH and dropped on to aluminum foil. The bulk samples were embrittled with liquid nitrogen, then sprayed gold by an ion puttering instrument.
The contact angle analysis (DSA100 KRUSS, Hamburg, German) was performed to detect the surface “wettability” of the composites. The composites with a different percentage of graphene had an effect on the surface wettability.
The dielectric properties and the volume resistivity (ρv) were obtained with a broadband dielectric spectrometer (Novocontrol Concept 40, Montabaur, Germany) from 102 to 107 Hz. The size of the samples was 3 cm in diameter and 1 mm in thickness.
Supplementary material
To view supplementary material for this article, please visit https://doi.org/10.1557/jmr.2018.436.
Acknowledgments
The authors sincerely acknowledge the Science and Technology Program of Suqian, Jiangsu Province (H201709).