NOMENCLATURE
- ACARS
Aircraft Communications Addressing and Reporting System
- ALWIN
Airport Low-level Wind INformation
- APP
approach
- APT
airport
- ATC
Air Traffic Control
- ATIS
Airport Terminal Information Service
- CHG
change
- COND
condition
- CONV
conventional system
- DEP
departure
- DIR
direction
- DN
down
- EFB
Electronic Flight Bag
- FNL
final
- fpm
ft/min (feet/minute)
- G
gust
- GND
ground
- HW
headwind
- ICAO
International Civil Aviation Organization
- Info
information
- JAL
Japan Airlines
- JMA
Japan Meteorological Agency
- L/D
landing
- LIDAR
LIght Detection And Ranging
- LOTAS
Low-level Turbulence Advisory System
- MBA
Microburst Alert
- METAR
Meteorological Terminal Air Report
- MFD
Multi-Function Display
- N/A
Not Available
- PFD
Primary Flight Display
- PIREPs
Pilot Information Reports
- RWY
runway
- SOLWIN
Sodar-based Low-level Wind INformation
- SODAR
SOnic Detection And Ranging
- SPD
speed
- VW
vertical wind
- WSA
Windshear Alert
- XW
crosswind
1.0 INTRODUCTION
Low-level wind disturbances such as windshear and turbulence near airports can present hazards to take-offs and landings because they disturb aircraft flight paths and attitudes. Following several tragic accidents due to strong windshear(1), the International Civil Aviation Organization (ICAO) recommended that airport meteorological services provide windshear warnings for aircraft flying below 1,600ft above the runway elevation(2). In Japan, the Japan Meteorological Agency (JMA) provides windshear alerts at major airports when an airport-based Doppler radar/lidar sensor observes a headwind change of more than 20kn(3).
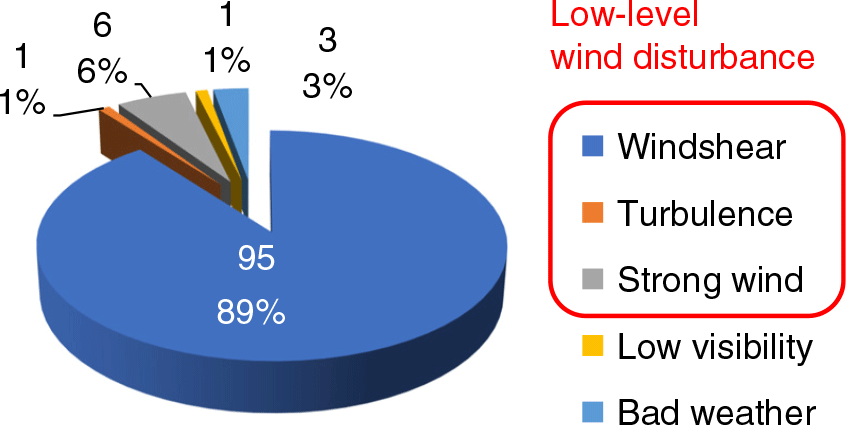
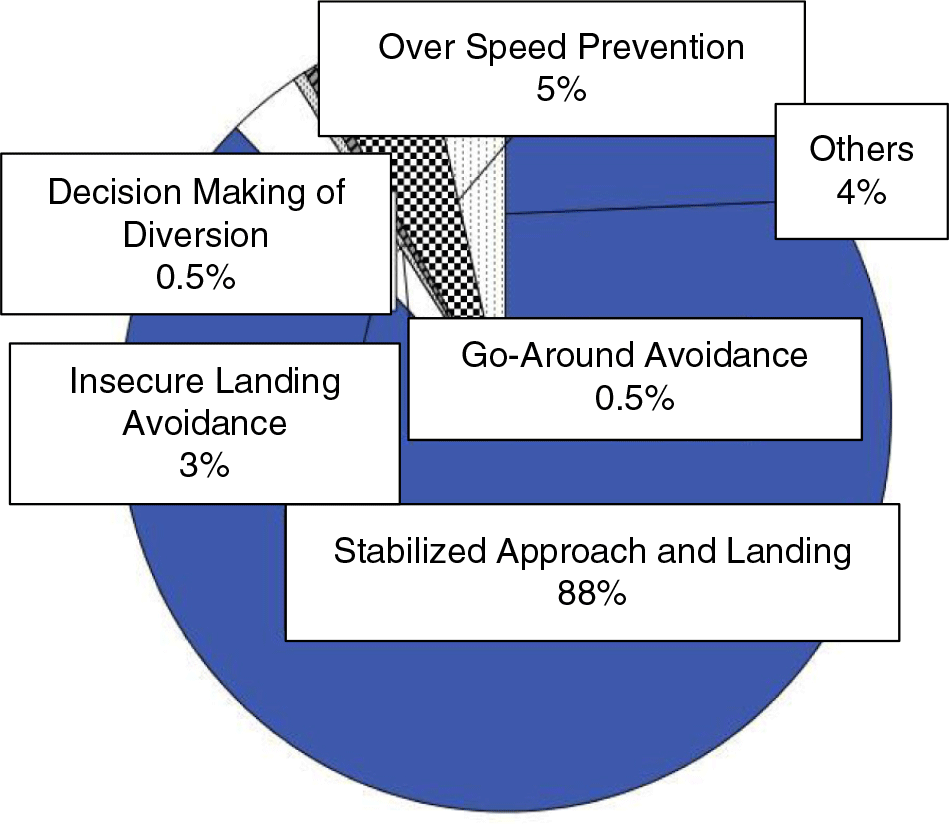
Although present low-level windshear alert systems contribute to the goal of preventing accidents, they do not always provide sufficient information on wind disturbances to prevent operational disturbances such as go-arounds. At Narita International Airport (Japan’s largest international airport), for example, more than 90% of go-arounds occur due to wind disturbances such as windshear, turbulence and strong headwinds or crosswinds, as shown in Fig. 1.
On investigating this situation, we found that existing windshear alerting systems provide windshear alerts only when the windshear is severe enough to pose a high accident risk. In other words, even if the alerting systems detect less severe windshear, which could nevertheless still cause a go-around or other air service disruption, this information is not provided to pilots. We have therefore developed a new airport low-level wind information system to provide landing aircraft with quantitative (numerical) and visualised (graphical) wind information to enhance pilot situational awareness of wind conditions and ultimately mitigate air service disruption due to low-level wind disturbances. Newly developed graphical and textual information provides tactical and strategic information on low-level turbulence and windshear to flight crews, airline dispatchers and other ground-based operations staff and is intended to increase operational efficiency (by reducing the number of go-arounds) as well as to prevent accidents. Flight crews can obtain the information by the Aircraft Communications Addressing and Reporting System (ACARS) datalink text message. This is the first system in the world that provides quantitative wind information to the cockpit.
Causes of go-arounds at Narita International Airport (2008).

Based on this concept, we have developed three types of airport low-level wind information system with different capabilities and costs: Airport Low-level Wind INformation (ALWIN)(Reference Matayoshi, Iijima, Yamamoto and Fujita4) and Low-level Turbulence Advisory System (LOTAS)(Reference Iijima, Matayoshi and Yoshikawa5) that use Doppler radar/lidar sensors, and Sodar-based Low-level Wind INformation (SOLWIN)(Reference Tayoshi, Iijima and Ito6) that uses Doppler SOnic Detection And Ranging (SODAR). This allows the system with the best cost benefit for an airport to be selected according to the airport’s scale and local weather characteristics. In this paper, airport scale refers to traffic volume (the number of daily scheduled flights) and the number of runways. The ALWIN system has been implemented and operated officially by the JMA at Tokyo’s two international airports, Narita and Haneda, since 2017. Moreover, in terms of use for aviation weather on improved airport operations, it is considered that our proposed system can contribute to support ICAO’s Aviation System Block Upgrades (ASBU) framework(7) as well as the concepts of international and national Air Traffic Management (ATM) development programs (e.g. SESAR(8), NextGen(9) or CARATS(Reference Imagome10)).
To verify the effectiveness of our concept, an operational evaluation was carried out by a questionnaire usability survey of flight crews and ground-based flight operations support staff.
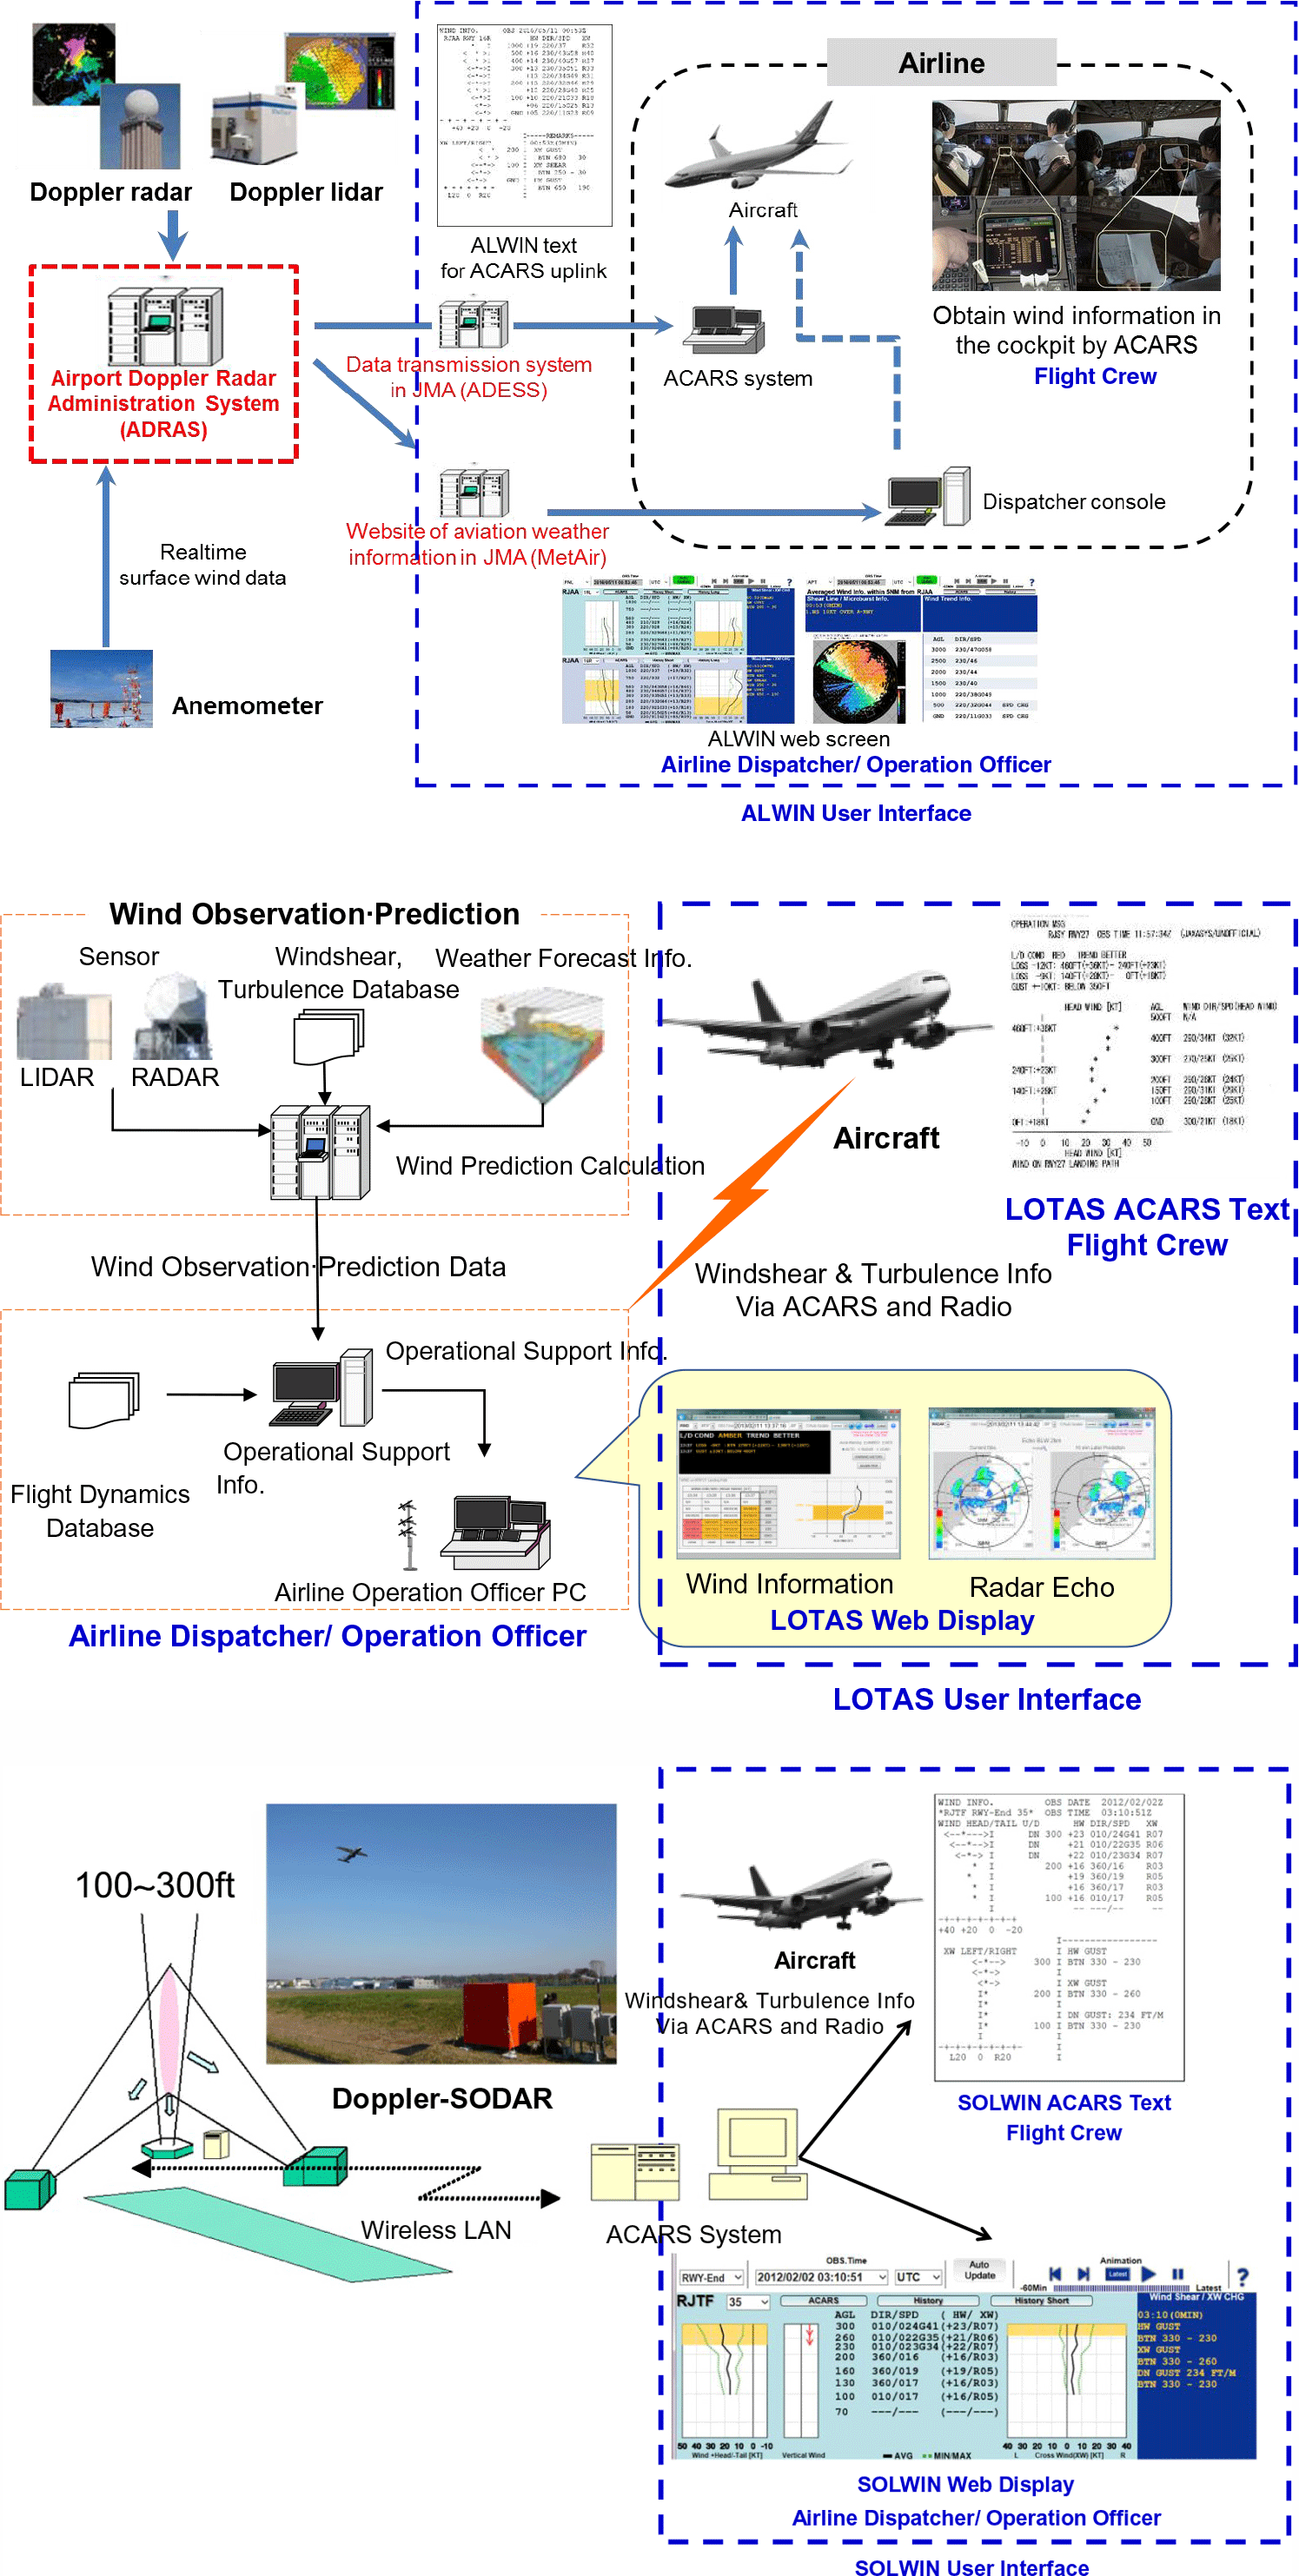
This paper presents the operational concept of our newly developed airport low-level wind information systems and describes their validation. The paper does not discuss the technical validation of wind measurement and detection accuracy, since system validation has been presented in our previous works(Reference Matayoshi, Iijima, Yamamoto and Fujita4,Reference Matayoshi, Iijima, Yoshikawa and Ushio11) . Instead, the operational evaluations discussed in this paper focus on the usability of the ALWIN/LOTAS/SOLWIN user interfaces, shown in Fig. 2.
2.0 OPERATIONAL CONCEPTS
The newly developed system architectures of the ALWIN, LOTAS and SOLWIN systems are shown in Fig. 2. ALWIN and LOTAS automatically detect wind disturbances on approach flight paths, including disturbances with small-scale spatial structures, using Doppler radar/lidar, while SOLWIN automatically detects disturbances directly above Doppler SODAR sensors to monitor discrete locations such as runway thresholds. Sensor wind data are processed into graphical/textual representations useful for aircraft operations, and they can be transmitted to flight crews in the cockpit via ACARS data link text message (Fig. 3) or to ground users (airline dispatcher/operations officers) via the Internet to provide a graphical and textual web display (Fig. 4), as we have described previously(Reference Matayoshi, Iijima, Yamamoto and Fujita4,Reference Iijima, Matayoshi and Yoshikawa5,Reference Matayoshi, Iijima, Yoshikawa and Ushio11) .
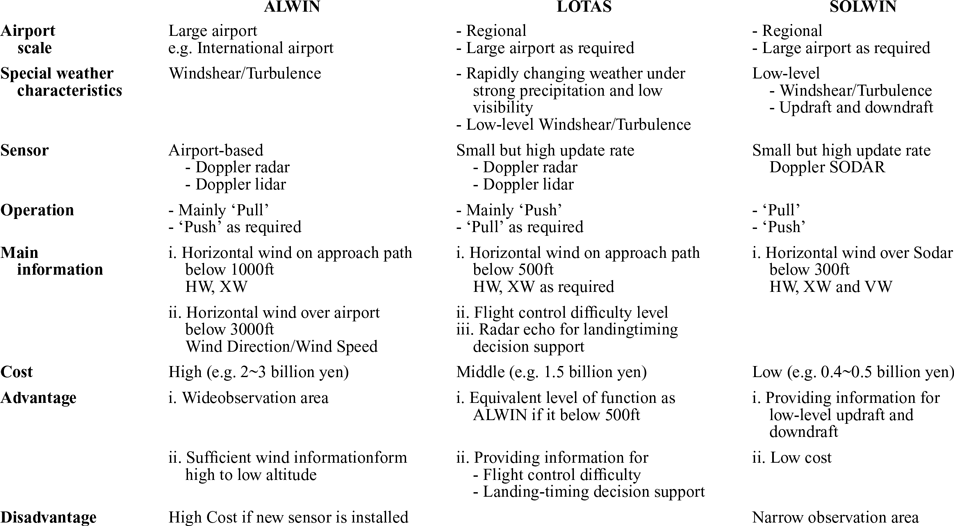
Although there are differences in the wind sensors used by the three systems, their architecture, that is windshear/turbulence detection and information provision methods, are very similar. Table 1 shows the operational concept of each system. Although the three systems all aim to provide tactical and strategic information on low-level turbulence and windshear, the type and cost of the wind sensor and the information content of the web display and ACARS message text differ according to the airport’s scale and the characteristics of its local weather environment.
The main method for obtaining wind information also differs among the three systems. ALWIN is used mainly in a ‘pull’ (request-response) mode of operation, while LOTAS and SOLWIN are used mainly in a ‘push’ mode.
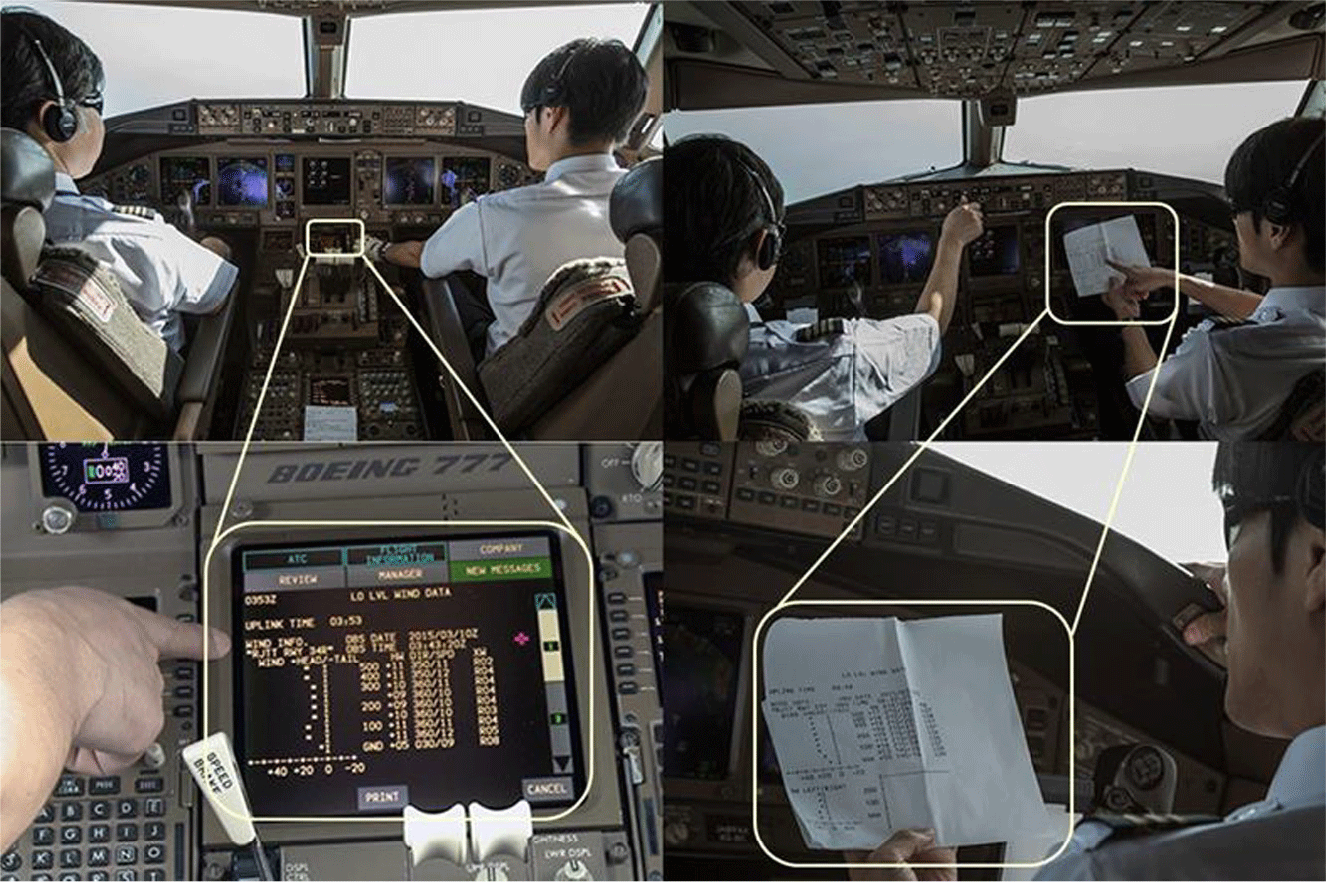
With a ‘pull’ operation(Reference Matayoshi, Iijima, Yamamoto and Fujita4), flight crews can obtain low-level wind information from the cockpit at any time on request using ACARS. To implement this type of operation, airlines have to modify their ACARS ground systems to respond automatically to flight crew requests by retrieving the latest ALWIN/LOTAS/SOLWIN text information from the server and uplinking it. This automated response to flight crew requests can improve flight crews’ wind situational awareness and enable them to more effectively conduct approach briefings and plan flight control strategy such as determining the target approach speed, as shown in Fig. 5. Flight crews typically obtain wind information via ACARS datalink during cruise as part of their preparations for arrival and use it to plan the approach and landing. In cases where the low-level wind information indicates turbulent conditions, flight crews can also obtain the most up-to-date information during the approach to allow them to monitor changes in the wind situation.
System architectures of (a) implemented ALWIN (Airport Low-level Wind INformation), (b) LOTAS (Low-level Turbulence Advisory System) and (c) SOLWIN (SOdar-based Wind INformation).

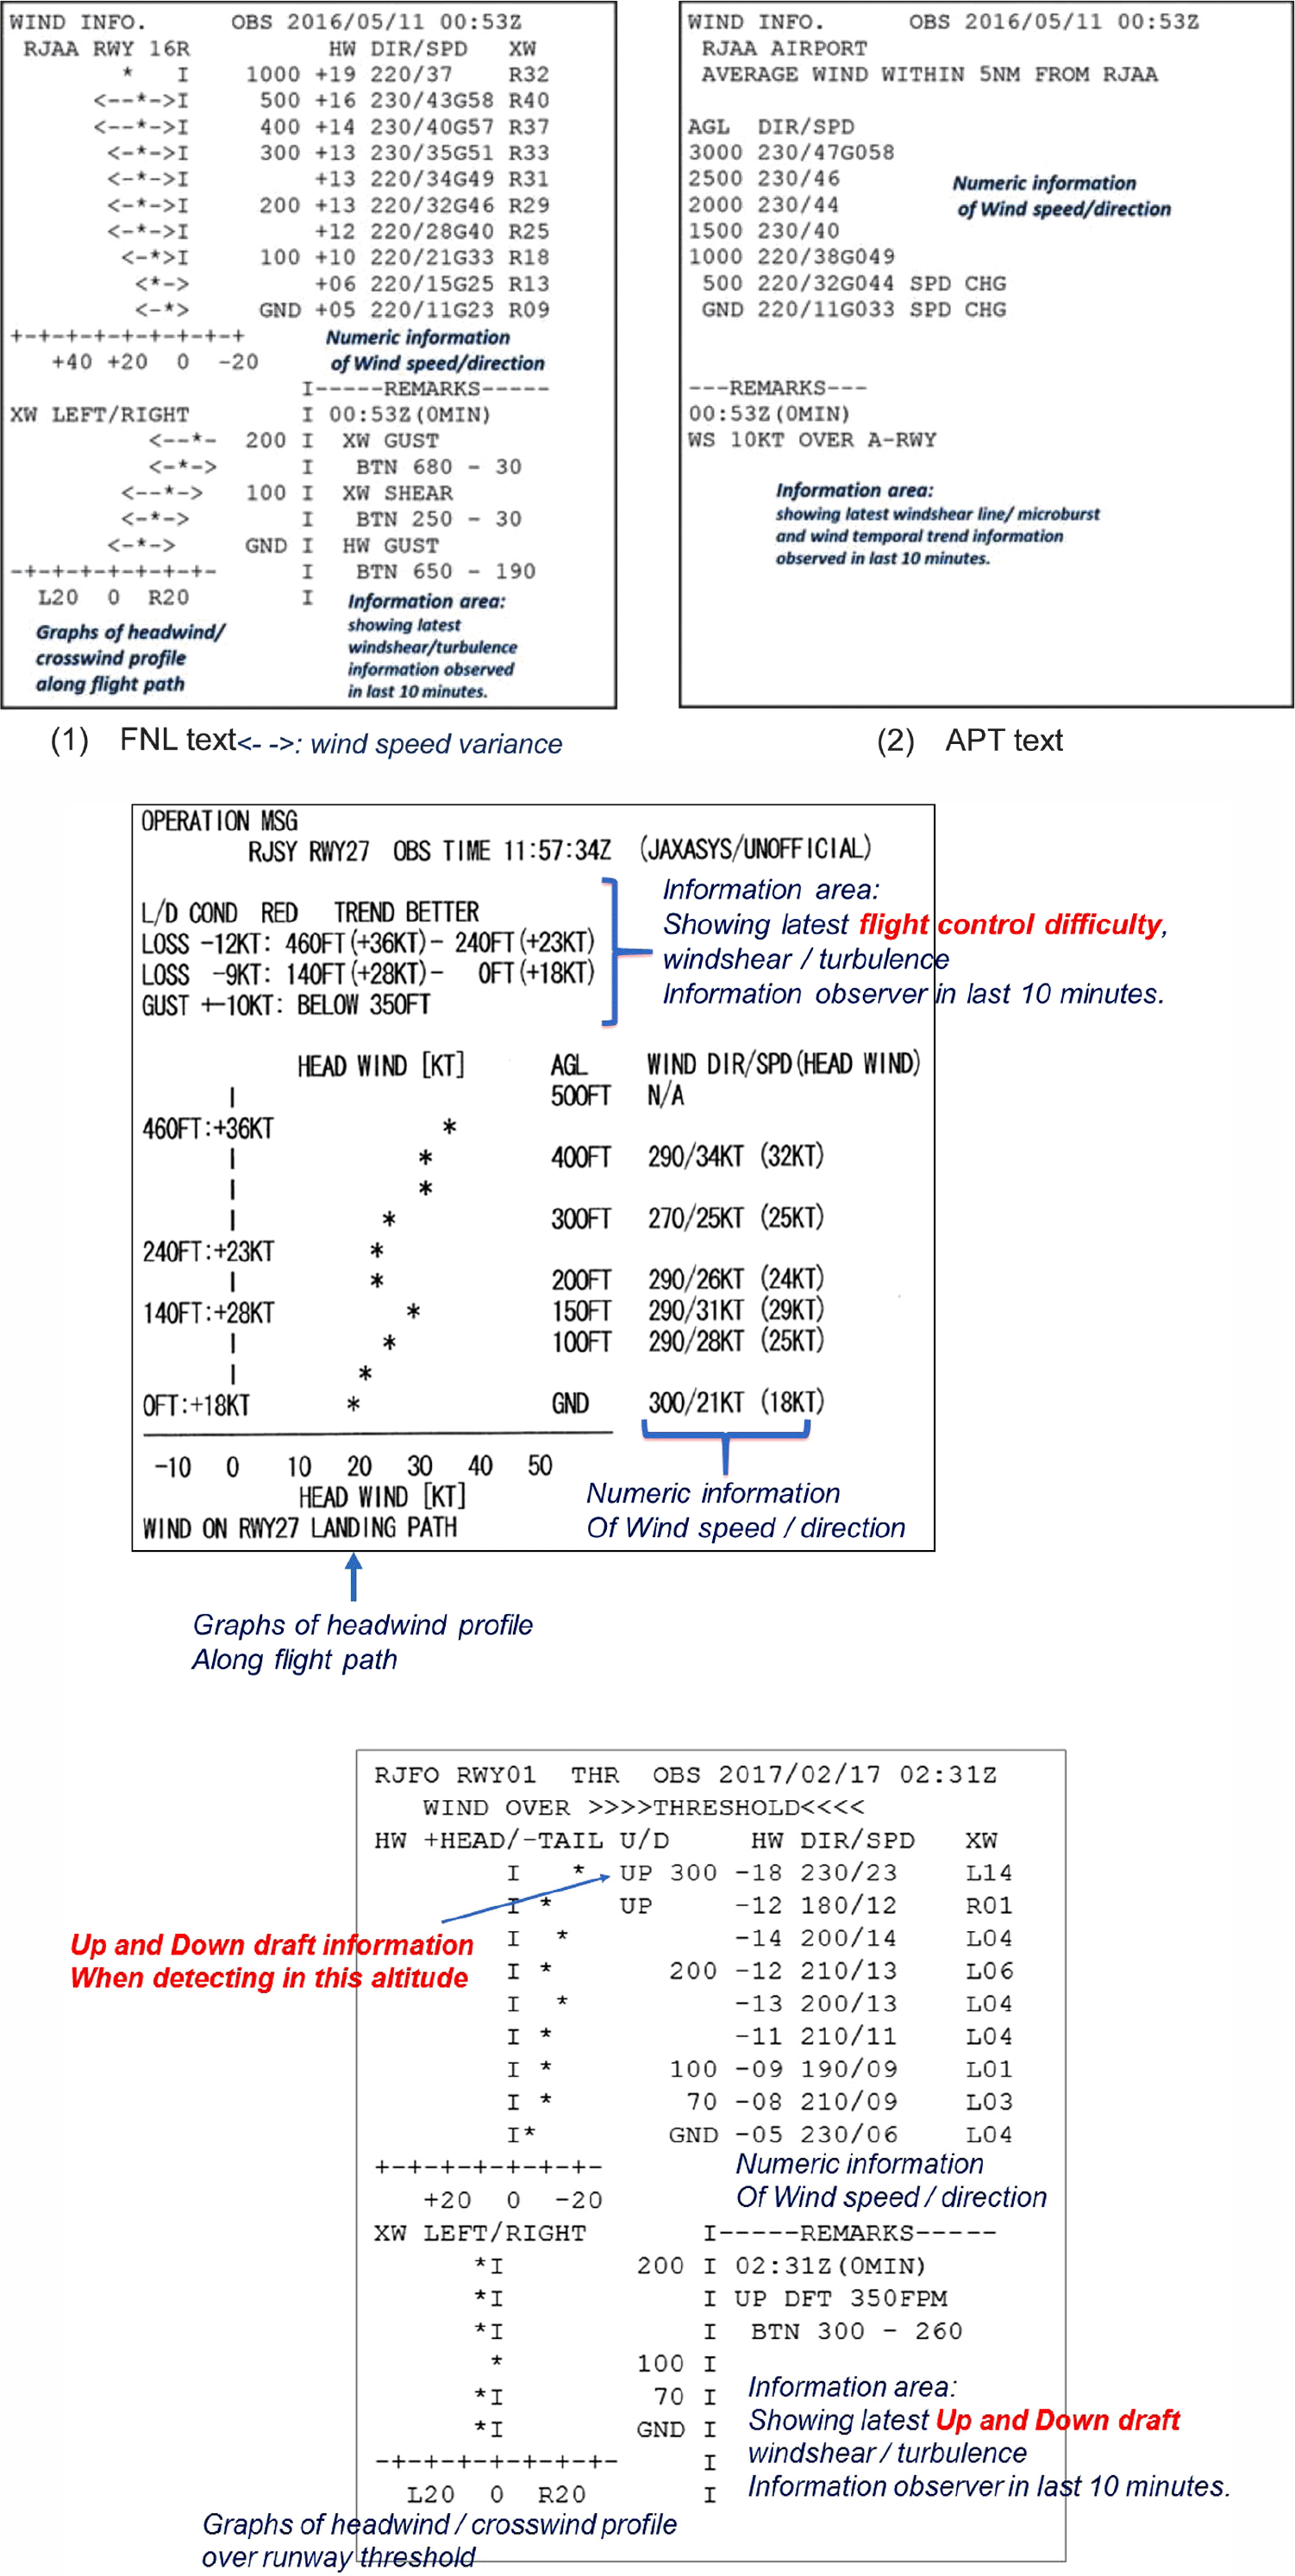
Examples of ACARS text displays of each system (a) ALWIN, (b) LOTAS and (c) SOLWIN.

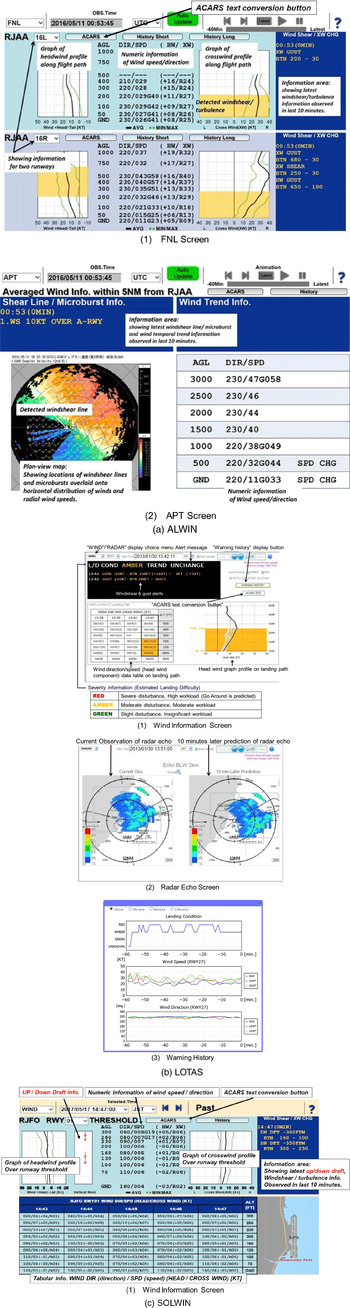
Examples of web display of each system (a) ALWIN, (b) LOTAS and (c) SOLWIN.

Operational concept of ALWIN, LOTAS and SOLWIN

HW: headwind, XW: crosswind, VW: vertical wind
Use of ALWIN text display in the cockpit.

On the other hand, with a ‘push’ operation(Reference Matayoshi, Iijima, Yamamoto and Fujita4), ground-based dispatchers or operations staff monitor the wind situation using a web display screen, shown in Fig. 4, and transmit the information to aircraft in flight when notable wind disturbances are observed. Operations staff can either uplink the ALWIN/LOTAS/SOLWIN text information shown in Fig. 3 to the aircraft over ACARS or verbally communicate the wind information indicated in the information area of the display over the company radio frequency. To facilitate push mode operations, we designed a function to generate an ACARS text message when the user clicks the ‘ACARS text conversion’ button in Fig. 4. This type of operation does not require any modifications to existing airline systems.
At present, pull operation is used by JAL with the ALWIN system at Japan’s largest international airports, Narita and Haneda, and on a trial basis with the SOLWIN system at Oita, a regional airport with about 14 daily scheduled flights. At the start of development, the push operation was used with the LOTAS system at Shonai Airport, but the pull operation with LOTAS is also possible with modifications to the ACARS ground system.
We now describe the main operating characteristics of each system in the following sections.
2.1 ALWIN
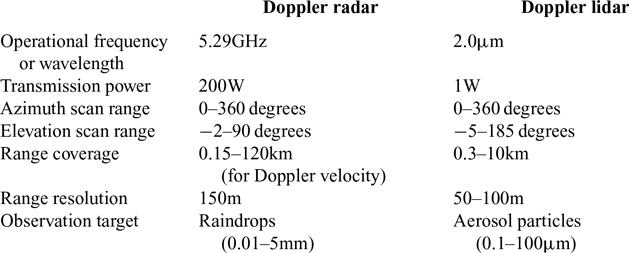
ALWIN is intended for airports with multiple runways and a high volume of daily airline traffic, such as international airports. Since high traffic means that low-level turbulence or windshear could affect many flights, and the impact of an accident or go-around will be high in such an operational environment, detailed wind information with a high update rate is needed. This requires a wind sensor that can cover a wide area, as shown in Table 1, which inevitably has a high cost. This leads to ALWIN potentially having the greatest installation and maintenance costs of our three systems.
However, the ALWIN systems that have been operated by the JMA at Tokyo’s Narita and Haneda airports since 2017 use the existing Doppler radar and lidar sensors used for conventional windshear alerting, so costs are only incurred for the ALWIN software development and the recurring sensor maintenance.
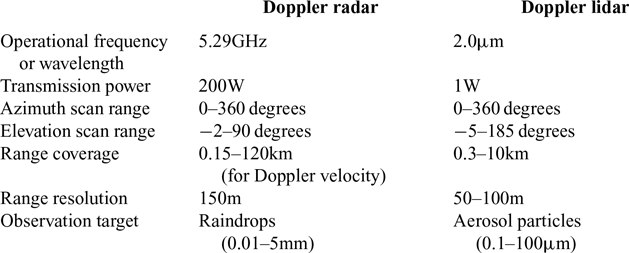
Major specifications of the Doppler radar and lidar used for ALWIN(Reference Matayoshi, Iijima, Yamamoto and Fujita4)
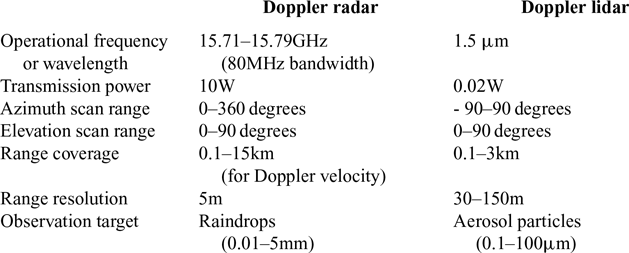
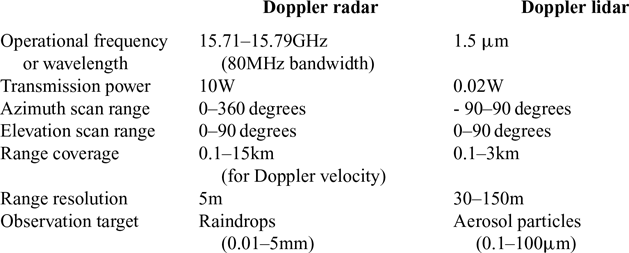
Major specifications of the Doppler radar and lidar used for LOTAS(Reference Matayoshi, Iijima, Yoshikawa and Ushio11)
2.2 LOTAS
Although the LOTAS wind sensor is assumed to be smaller and cheaper than that used by the ALWIN system, as shown in Table 2(Reference Matayoshi, Iijima, Yamamoto and Fujita4, Reference Matayoshi, Iijima, Yoshikawa and Ushio11), LOTAS can be considered as having the greatest functional capability of our three proposed systems because it provides novel flight control difficulty and landing-timing decision support strategic information, listed as one of its advantages in Table 1.
LOTAS is intended to be best suited to airports with only a few scheduled daily flights but where the weather environment is prone to changing rapidly, with strong precipitation and low visibility, as shown in Table 1. Although strong windshear in low visibility is a difficult environment for aircraft operations, system installation and maintenance costs must be reduced due to the lower cost benefit of the system at regional airports with only light scheduled traffic. Since such airports are not congested, aircraft have more opportunities to circle near the airport waiting for favourable landing conditions when there is rapidly changing weather with strong precipitation on the approach path, such as conditions associated with thunderstorm cells or the passage of a front. In such cases, the capability to evaluate a dynamically changing weather situation to determine the best timing for the landing is needed.
Considering these factors, in order to satisfy the conflicting demands of low cost and the need for strategic information under rapidly changing weather conditions, LOTAS provides not only information on low-level wind conditions during the approach and landing phases but also directly provides a measure of flight control difficulty, as shown in Figs 3(b)(1) and 4(b)(1) and described in detail in the next section, in addition to radar echo information to support landing-timing decisions in dynamic weather situations, as shown in Fig. 4(b)(2). It is hypothesised that flight control difficulty information provides direct support information to allow ground-based operations staff to advise flight crews regarding the wind situation via radio voice communication and ACARS, and to flight crews to predict the likelihood of a go-around. Moreover, it is hypothesised that a landing-timing decision support tool will assist both flight crews and operations staff particularly when conditions are changing rapidly. Flight crews will be able to time their approaches to give lower landing difficulty, while operations staff may contribute to the approach planning by advising crews of conditions and landing timing under strong winds and low visibility conditions by referring to the radar echo display of Fig. 4(b)(2)(Reference Iijima, Matayoshi and Yoshikawa5), as described in detail in the next section.
From the viewpoint of official meteorological observers such as the JMA, however, providing flight control difficulty information is considered to be slightly ‘delicate’, even if it is not official but for reference purposes or for reasons of responsibility in the case of an accident or incident. For example, in a case where the flight control difficulty level is indicated in LOTAS as ‘GREEN (easy)’, if severe windshear were to be encountered and an accident were to occur partly as a result of the wind situation, then it would be complicated to attribute responsibility between the flight crew and the information provider. ALWIN is therefore designed intentionally not to provide flight control difficulty information, at the present time, thus has slightly less functional capability than LOTAS.
2.3 SOLWIN
SOLWIN is targeted at regional airports with small budgets and, therefore, uses Doppler SODAR – a lower cost, less capable wind sensor than the other two systems, as shown in Fig. 2(c). Doppler SODAR measures upper-air winds by acoustic signals and has limited observation range, and its valid wind information is limited to below approximately 300ft.
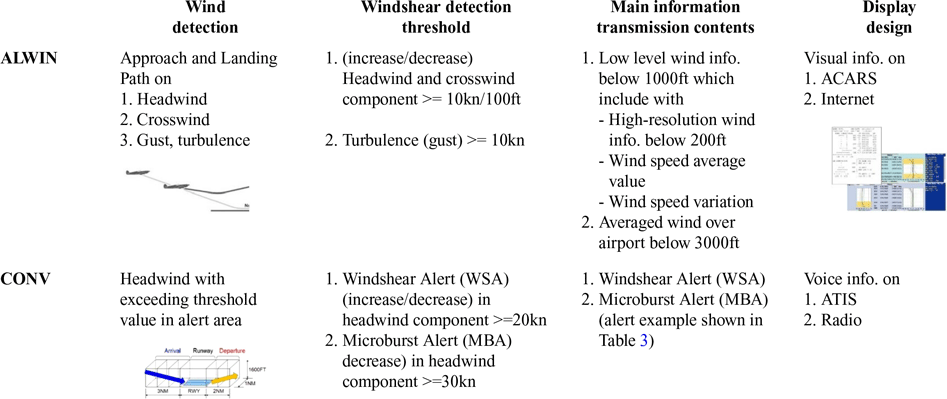
ALWIN design concept compared with CONV (conventional system)

3.0 DESIGN CONCEPTS
3.1 ALWIN
Table 3 shows the design concepts of the ALWIN system and compares it to a conventional system (CONV) that provides low-level windshear alerts using airport-based Doppler radars and/or lidar sensors.
3.1.1 Wind detection
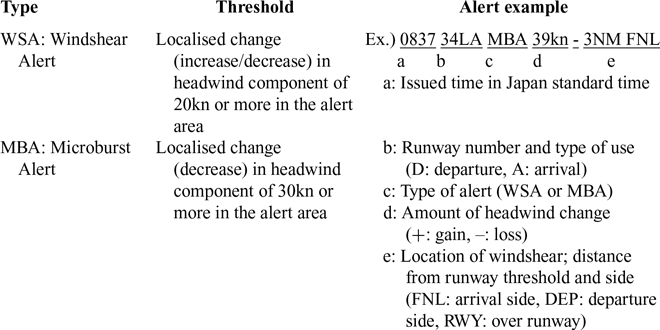
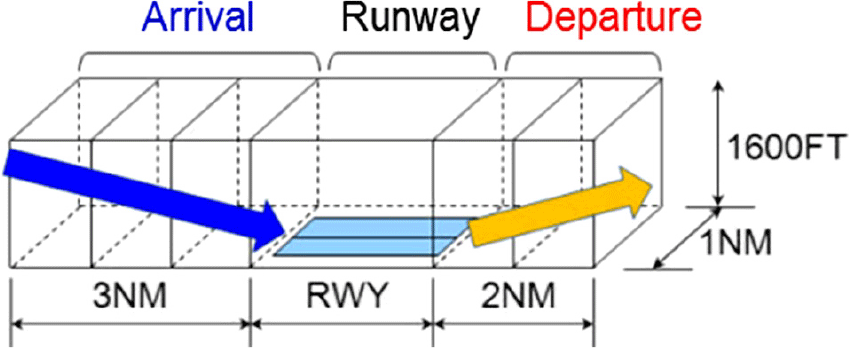
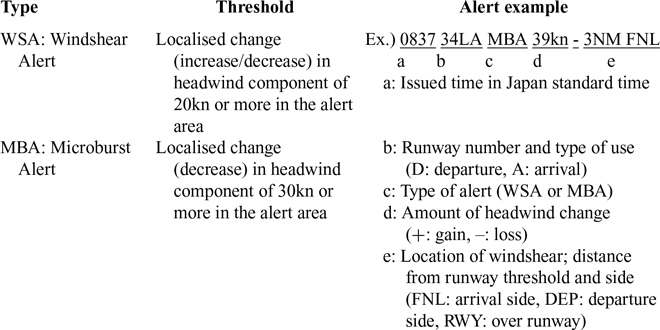
Since ALWIN is targeted at large-scale airports, it is likely that there will already be Doppler radars and/or lidar sensors installed for low-level windshear alerts. Conventional low-level windshear alerts are generated when airport-based Doppler radars and/or lidar detect significant changes in headwinds within alert areas established around the departure and arrival paths (Table 4 and Fig. 6)(Reference Matayoshi, Iijima, Yamamoto and Fujita4). These alerts are communicated to pilots in real-time by air traffic controllers via radiotelephony so that pilots can take immediate action to avoid the hazard. Alert threshold values of 20kn or 30kn can detect windshear of sufficient severity posing a high risk of an accident even if pilots were to take corrective action on encountering the phenomenon. Thus, existing systems provide only the minimum necessary windshear information: the coarse position of the windshear and the peak value of the headwind change. This information is insufficient to support normal operations and increase operational efficiency by reducing the number of go-arounds.
Types and thresholds of low-level windshear alert
Target areas of low-level windshear alert(Reference Matayoshi, Iijima, Yamamoto and Fujita4).

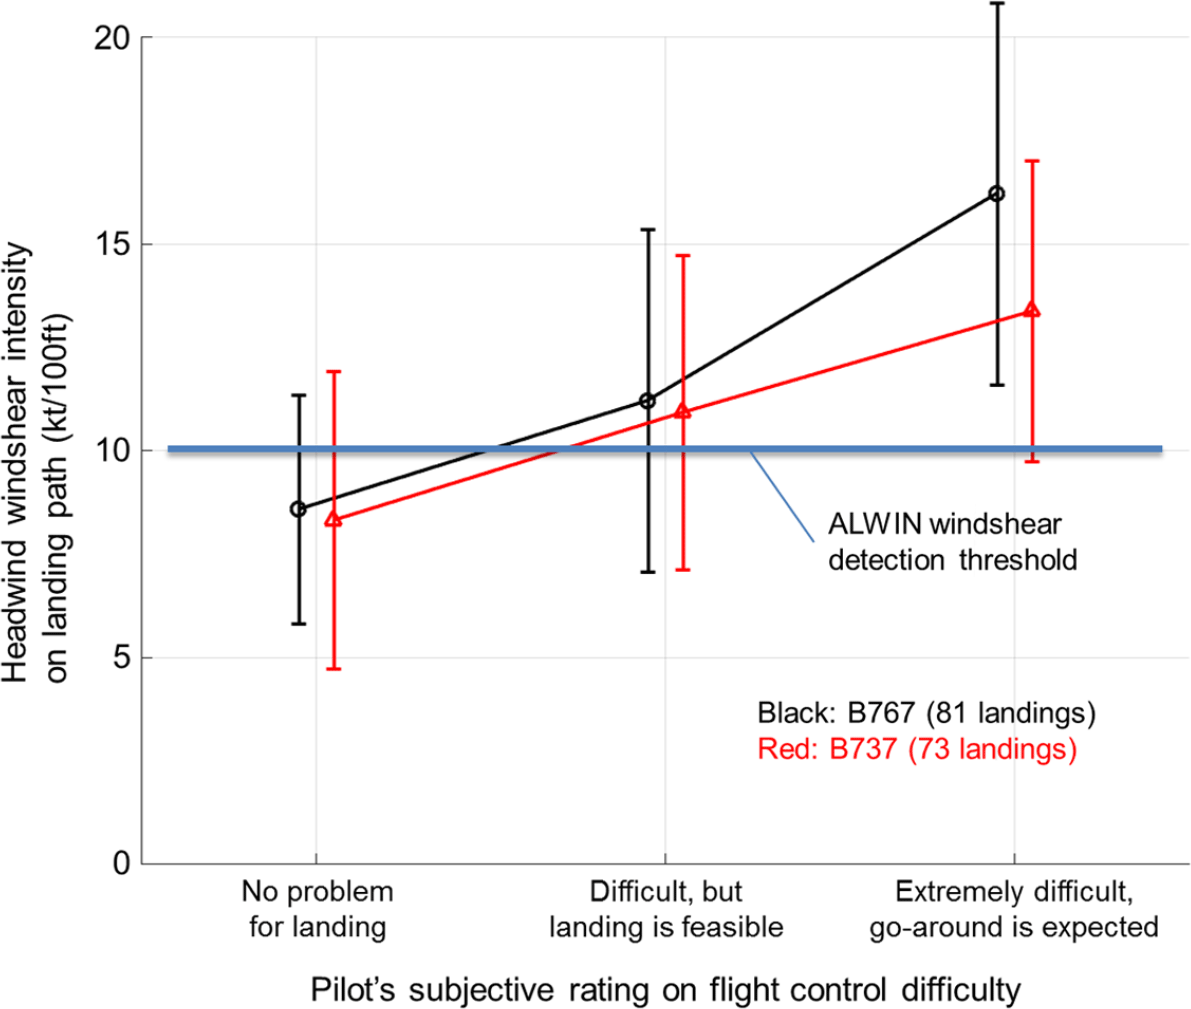
Relationship between windshear intensity and flight control difficulty during final approach(Reference Matayoshi, Iijima, Yamamoto and Fujita4).

We therefore conducted a flight crew survey(Reference Iijima, Matayoshi and Yoshikawa5), flight crew interviews and reviews of flight data from which we identified items of wind information that would be relevant to the approach and landing phases of flight and useful for operations. The identified wind detection information includes not only headwinds but also the crosswind component and gust information on the approach and landing flight path, as shown in Table 3. In addition, analyses of go-around events have revealed that aircraft attitude disturbances due to turbulence encounters below 500ft with significant crosswind as well as headwind components are a major cause of such events(Reference Iijima, Matayoshi and Yoshikawa5,Reference Matayoshi, Iijima, Yoshikawa and Ushio11) . Such turbulence that causes aircraft attitude changes is typically topographically induced or building wake and has small spatial structures (on the order of 100m) not covered by existing windshear detection systems that only detect disturbances with larger spatial structures (on the order of 1km).
3.1.2 Windshear detection thresholds
To support normal operations, the ALWIN windshear detection thresholds were reduced compared to existing windshear alert (WSA) and microburst alert (MBA) criteria (Table 3, with detail data in Table 4) in order to alert the presence of windshear that is strong enough to force a go-around or other operational disruption but not necessarily strong enough to be a flight safety hazard. In order to clarify a so-called ‘yellow signal’ (a caution rather than alert) wind situation, in which pilots will be able to make a successful approach and landing with moderate to high workload, the threshold value was determined based on our previous study on the effect of windshear on flight control difficulty during the landing phase(Reference Matayoshi, Iijima, Yoshikawa and Ushio11). Figure 7 shows the relationship between windshear intensity on the approach path and flight control difficulty (pilot subjective rating) for 154 landings at Shonai Airport, a Japanese regional airport(Reference Matayoshi, Iijima, Yamamoto and Fujita4). Although there is a large variation in the results, pilots felt that flight control was difficult when the windshear intensity exceeded 10kn/100ft(Reference Matayoshi, Iijima, Yamamoto and Fujita4). Accordingly, ALWIN indicates the presence of turbulence when the difference between the gust (peak) and average wind speeds exceeds 10kn. This turbulence detection threshold is the same as the gust reporting criteria of airport surface winds. This turbulence alert feature is a novel feature of ALWIN, which can detect turbulence with small-scale spatial structures that could cause aircraft attitude disturbances(Reference Matayoshi, Iijima, Yamamoto and Fujita4).
3.1.3 Information content and display design
(a) ACARS text display
Since ALWIN is targeted at large-scale airports with multiple runways and traffic exceeding 30 airline flights per day, manual ACARS transmission by ground operations staff is considered to be unrealistic. For this reason, ALWIN is assumed to be operated in pull mode rather than push mode as mentioned in Section 2.0.
The design of the ACARS text display is a highly important issue for the ALWIN system because the flight crew must make a rapid but accurate situation assessment of wind disturbances from the ACARS text during the high workload approach flight phase, while the character count of each ACARS text message is limited. We describe design concept of the ALWIN ACARS text message in the following paragraphs.
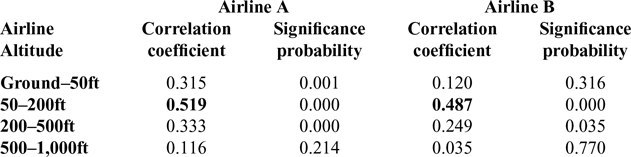
Correlation coefficient analysis results between subjective flight control difficulty altitude range and subjective workload rating(Reference Iijima, Matayoshi, Fujita and Yamamoto13)

The ALWIN ACARS message format provides not only the same critical microburst alert and windshear information as conventional systems(12) but also information that can support landing planning and decision-making such as Pilot Information Reports (PIREPs). We have proposed a novel ACARS message format, which is the world’s first routine operational ACARS message that contains a spatial graph rendered as text(Reference Iijima, Matayoshi and Yoshikawa5). We hypothesise that this headwind graph will intuitively provide pilots with better awareness of headwind changes with altitude. Based on the concept, the ALWIN ACARS text message provides two types of advisory information for aircraft operations support: Final (FNL) ACARS and Airport (APT) ACARS, as shown in Fig. 3(a)
FINAL (FNL) ACARS
The FNL ACARS message format focuses mainly on low-level (altitude) wind information on the final approach path to improve the resolution of the altitude and wind speed information provided to flight crews. The low-level wind information is limited to below 1,000ft, as shown in Table 3, because general flight crews comments (which were obtained from a previous study) indicated that it is necessary to obtain wind information at least below 1,000ft to allow pilots to satisfy the stabilised approach criteria for continuing an approach. Moreover, the FNL ACARS message provides high-resolution wind information below 200ft because subjective ratings of high flight control difficulty from our flight crew survey(Reference Iijima, Matayoshi, Fujita and Yamamoto13) correlated especially to altitudes below 200ft, as shown in Table 5. In addition, the FNL ACARS message provides not only average winds but also wind speed variation, shown as ‘< >’ in Fig. 3(a)(1), so that pilots can recognise rough air and/or turbulent conditions and the potential existence of updrafts and downdrafts.
Based on this concept, profiles of headwind and crosswind components along the final approach path are depicted by graphical text formats, as shown in Fig. 3(a)(1). Heights at which vertical windshear or turbulence exist are automatically detected and indicated in the ‘REMARKS’ area and on profile graphs. Vertical windshear is indicated when the wind speed change of either headwind or crosswind components exceeds 10kn/100ft, as mentioned in Section 3.1.2.
ALWIN’s FNL ACARS is therefore designed to support decision-making when determining the target approach speed, runway selection in the case of multiple parallel runways, and flight control strategy under windshear/turbulent /crosswind conditions.
AIRPORT(APT) ACARS
The APT ACARS message format shows the vertical profile of averaged winds over the airport in a tabular format that mainly focuses on global wind information up to high altitude. Notable changes in wind speed or direction are automatically detected and indicated in the table. The APT ACARS message format is designed to support flight planning for the timing of configuration changes (landing gear and flaps extension) by providing rough altitude wind direction/speed change information to flight crews.
Ground-based operators can retrieve the ALWIN text information by clicking the ‘ACARS text conversion’ button on the ALWIN web screen shown in Fig. 4(a). ALWIN text information is thus accessible in two ways: either as a display of text information on the ALWIN web screen or as text information downloaded directly from a server over a data communication network.
(b) Web display
ALWIN provides two types of advisory information for operations support staff through web pages that can be delivered over the Internet: a FNL screen and an APT screen, as shown in Fig. 4(a). The design concepts of the FNL and APT screens are as same as the ALWIN ACARS text message formats shown in Table 3.
ALWIN screen displays have been provided as a part of the JMA’s MetAir web-based aeronautical weather information service(14) since April 2017. Registered users can browse ALWIN information using ordinary web browsers.
FNL screen
In accordance with the design concept, the FNL screen shows profiles of headwind and crosswind components along the final approach path in graphical and tabular formats, as shown in Fig. 4(a)(1). Heights at which vertical windshear or turbulence exist are automatically detected and indicated in the Information Area and on profile graphs as coloured bands. Vertical windshear is indicated when the change in either headwind or crosswind components exceeds 10kn/100ft, as mentioned in Section 3.1.2.
APT screen
As with the APT ACARS message format, the APT screen shows the vertical profile of averaged wind over the airport in a tabular format that mainly focuses on global wind information up to high altitude. Notable changes in wind speed or direction are automatically detected and indicated as ‘SPD CHG’ or ‘DIR CHG’ in the table. The Information Area shows wind shear line, microburst and temporal wind change trends. This wind shear line and microburst information thresholds use the conventional criteria shown in Table 4 developed by the JMA.
The locations of windshear lines and microbursts are also shown in a plan-view ‘map’ format and overlaid onto the horizontal distribution of winds and radial wind speeds. Since this ‘map’ format aims at improving the wind situational awareness of ground-based operators, it is shown only in the web display of APT screen, not in the APT ACARS message.
Both the FNL and APT screens can provide historical wind information for up to 12 hours previously to allow operators to monitor wind changes over time.
3.2 LOTAS
Details of wind detection and windshear detection thresholds with LOTAS are almost the same as for the ALWIN system described in Sections 3.1.1 and 3.1.2. We focus here on the design concepts of the weather sensor coverage and the user interface.
3.2.1 Sensor coverage
LOTAS provides information on low-level wind disturbances (windshear, turbulence, etc.) and information to support approach planning. Based on the operational concept outlined in Section 2.2, Doppler radar and lidar sensors are used to detect atmospheric disturbances under all weather conditions, areas of low visibility due to rain and snow, and wind speed and direction, while precipitation intensity is obtained from Doppler radar.
Since the altitudes and distances from the airport at which low-level wind disturbances occur differ for each airport due to factors such as local terrain, we survey the altitudes and distances at which low-level wind disturbances are judged to have a significant impact on flight operations based on wind observation data, flight parameters (e.g. airspeed) of specific aircraft types, and interviews with flight crews and airline operations staff. Regarding the weather environment of LOTAS operations at Shonai Airport, for example, we determined that information should be provided on low-level wind disturbances below 500ft and radar echoes below 2km altitude within a 10NM radius of the airport.
It should be noted that if wind observations are required at higher altitudes or over a wider area, the installation and maintenance costs of LOTAS will increase.
3.2.2 Display design
At present, the design of LOTAS assumes push mode operation to avoid the cost of integrating LOTAS into the airline’s ACARS ground system. This is considered feasible because the operations staff workload will be lower at smaller scale airports with only a few scheduled daily flights. If the operations staff decides to advise a flight crew of the wind situation, they generate the LOTAS ACARS message text by clicking the ‘ACARS text conversion’ button in the wind information web display shown in Fig. 4(b)(1). The generated LOTAS ACARS text, shown in Fig. 3(b), is then manually copied to the company’s ACARS terminal to uplink the message or verbally communicated to the flight crew.
The design of the web display is highly important for the LOTAS system because the operations officers might have to assess wind disturbances and favourable aircraft landing timing in rapidly changing conditions with strong precipitation on the approach route. Moreover, concise and accurate advice must be communicated to flight crews during the high workload approach phase of flight.
Considering these requirements, the LOTAS display(Reference Iijima, Matayoshi and Yoshikawa5) prototype introduces graphical wind information and radar echo displays and a specific ACARS message text derived from a newly developed severity metric (estimated landing difficulty)(Reference Matayoshi, Iijima, Yoshikawa and Ushio11), headwinds and other information as shown in Figs 3(b) and 4(b).
The wind information display mainly provides alerts of low-level wind disturbances. The radar echo display, which shows precipitation intensity, is intended to be used for decision support to avoid areas of precipitation that will affect the aircraft’s approach and to plan the landing timing when there are areas of precipitation within 10NM of the airport. The proposed ACARS message text, which provides low-level wind conditions to flight crews, is designed to improve wind situational awareness, the ability to predict the future wind situation in dynamic conditions and in-flight approach and landing planning, similarly to ALWIN.
(a) Web display
Wind Information Display
The wind information display presents the following information: alert messages, a landing path headwind graph profile (HW graph) and a wind direction/speed (headwind component) data table (wind data table), as shown in Fig. 4(b)(1). These are presented side-by-side on the same screen to enable operators to easily assimilate the contents of alerts by the following process. The operator first obtains summarised alert information from the alert message area, grasps the general wind situation from the graphical information presented in the HW graph and finally confirms precise wind data from the numerical information in the wind data table. Based on this process, we hypothesise that ground staff will find it easier and more appropriate to use the system in push mode, rather than the pull mode used with ALWIN.
As mentioned earlier, the display also includes newly created severity information that reflects the impact of wind disturbances on aircraft state and flight control difficulty, and the ‘estimated landing difficulty’ metric(Reference Matayoshi, Iijima, Yoshikawa and Ushio11) for low-level wind disturbances to be presented in the alert messages area, shown as ‘L/D COND’ in Fig. 4(b)(1). The L/D COND for each aircraft type has three levels, ‘RED’, ‘AMBER’ and ‘GREEN’, as defined in Fig. 4(b)(1). Additionally, the alert message area provides landing difficulty trend information (e.g. ‘TREND UNCHANGE’), head/tail windshear component (‘GAIN/LOSS’) and altitude information.
Airline operations staff sometimes forecast low-level wind disturbances based on the previous few hours of observations. Therefore, the LOTAS display has a function to provide past information (called ‘Warning History’ in this paper) of L/D COND, wind direction and speed information over the previous several hours, as shown in Fig. 4(b)(3). The information is accessed by the Warning History button shown in Fig. 4(b)(1)
Radar Echo (Precipitation, Snow intensity) Display
As mentioned above, preparation for landing requires not only information on low-level wind disturbances but may also require radar echo information on the intensity of rain or snow. Conventional radar echo information, for example(15), is difficult to use for landing-timing decisions – its poor spatial resolution and low update rate (e.g. 10 minutes) make it hard for flight crews to decide when to commence an approach in a rapidly changing weather situation.
We therefore present a new radar echo information display with higher spatial resolution and update rate (e.g. 2 minutes) focusing on low altitudes (below 2km) in the approach area. To further support landing-timing decision-making, we propose a radar image that shows both the ‘current observation’ and a ‘10-minute (10-min) prediction’ of radar echoes superimposed on an approach chart, as shown in Fig. 4(b)(2), since it takes approximately 10 minutes from an aircraft leaving the ‘high station’ (initial approach fix) of the airport to starting its final approach and landing. By comparing the two images, an operations officer will be able to estimate what the situation will be 10 minutes later, that is during the landing phase, before the aircraft starts its approach, thus enabling better judgment of the landing timing.
(b) ACARS text display
The LOTAS ACARS, shown in Fig. 3(b), differs from the ALWIN ACARS display in that it provides an estimated landing difficulty metric(Reference Matayoshi, Iijima, Yoshikawa and Ushio11) (L/D COND). Although the LOTAS ACARS does not include the crosswind graph and wind variation notation ‘< >’ of the ALWIN ACARS, it is possible to include such information by customising the message according to the specific local weather environment of the airport. At Shonai Airport, used in the operational evaluation of LOTAS described in Section 4.0, the LOTAS ACARS message omitted the crosswind graph because the headwind shear was considered to be most problematic local weather phenomenon and was therefore prioritised.
3.3 SOLWIN
3.3.1 Wind detection
As shown in Table 1, although SOLWIN’s observation area is limited, it has the advantage of providing vertical wind speed information, that is updrafts and downdrafts, which the other systems do not. In order to support aircraft operations effectively, vertical wind speeds are presented in units of ft/min (fpm) rather than kn so that flight crews can more easily estimate the effect on the aircraft’s rate of climb or descent.
While horizontal wind information (wind direction/wind speed) reported to pilots is given as two-minute average values, an evaluation of SOLWIN at Oita Airport found that this was too long for vertical wind fluctuations, so the one-minute averages are given to allow severe updrafts and downdrafts to be indicated.
We hypothesise that displaying vertical speed change when significant updrafts and downdrafts exist will be helpful to pilots not only in the case of steady vertical winds but also for dealing with short-scale phenomena such as building wake, small mountain wave and hanger wave. (‘Hanger wave’ is turbulence in the wake of a hanger that is located near a runway in strong wind and can disturb aircraft just prior to touchdown.)
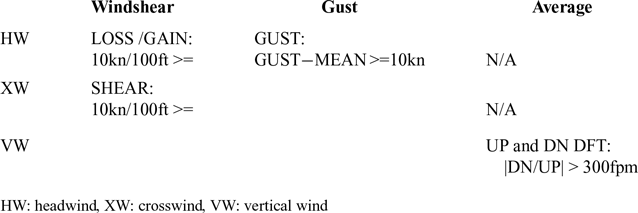
3.3.2 Windshear detection thresholds
SOLWIN uses the same headwind and crosswind threshold values to indicate the presence of windshear as ALWIN and LOTAS, namely 10kn/100ft. The values used in the operational evaluation presented in this paper are shown in Table 6 and were based on interviews with flight crews. These interviews were important because expressing vertical wind speed in fpm is novel. During the present SOLWIN evaluation phase, the presence of updrafts or downdrafts is displayed when the constant estimated vertical wind speed exceeds 300fpm. These values were selected considering a nominal rate of descent of approximately 700fpm for a Boeing 737-sized aircraft on final approach and the operational requirement to establish a stabilised approach with a descent rate of less than 1,000fpm; that is, a downdraft of more than 300fpm will cause the stabilised approach descent rate criterion of 1,000fpm to be exceeded.
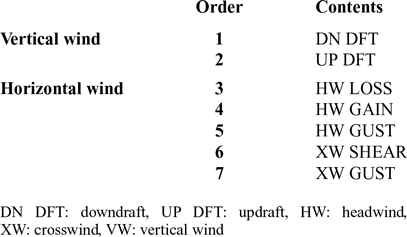
Based on this design concept, the windshear detection threshold values and priority of indication shown in Tables 6 and 7 were chosen.
3.3.3 Information content and display design
(a) ACARS text display
At the beginning of the system feasibility study for SOLWIN, although we assumed that SOLWIN would be used mainly in push mode, an airline expressed a desire for pull mode operation as its expectation of the effectiveness of SOLWIN increased.
Windshear detection thresholds in SOLWIN

HW: headwind, XW: crosswind, VW: vertical wind
SOLWIN information provision priority

DN DFT: downdraft, UP DFT: updraft, HW: headwind, XW: crosswind, VW: vertical wind
The design of the SOLWIN ACARS text display therefore also became an important issue. In particular, it was required that the new display design support intuitive awareness of up draft and down draft information. However, the size of the ACARS text display area is limited by the airborne ACARS software specification of 23 lines vertical by 39 letters horizontal, and flight crews also requested to see headwind and crosswind graphs. Therefore, simple indications of ‘UP’ and/or ‘DN’ were shown beside the headwind graph to allow flight crews to recognise intuitively the altitude areas in which updrafts or downdrafts exist, as shown in Fig. 3(c). As shown in the figure, the headwind graph only shows heights up to 300ft above the runway threshold due to the limitations of the Doppler SODAR sensor.
(b) Web display
The SOLWIN web display, shown in Fig. 4(c), is based on the same concept as the ACARS text display design described above.
Information is provided to ground-based operations staff in a tabular format to allow them to easily recognise wind situation tendencies, and because we suppose that SOLWIN will be used in both pull and push modes of operation.
4.0 OPERATIONAL EVALUATIONS
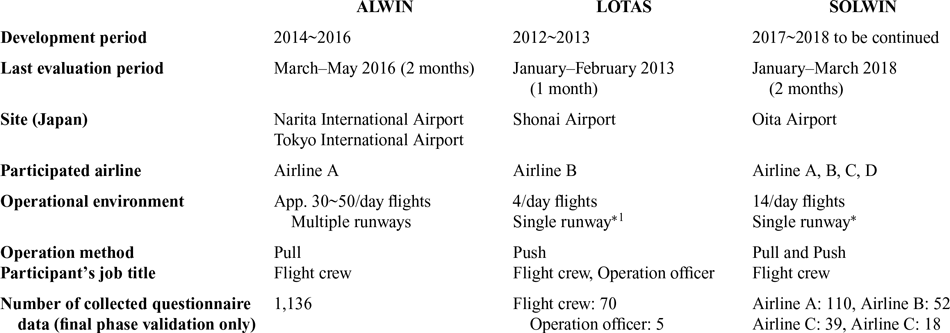
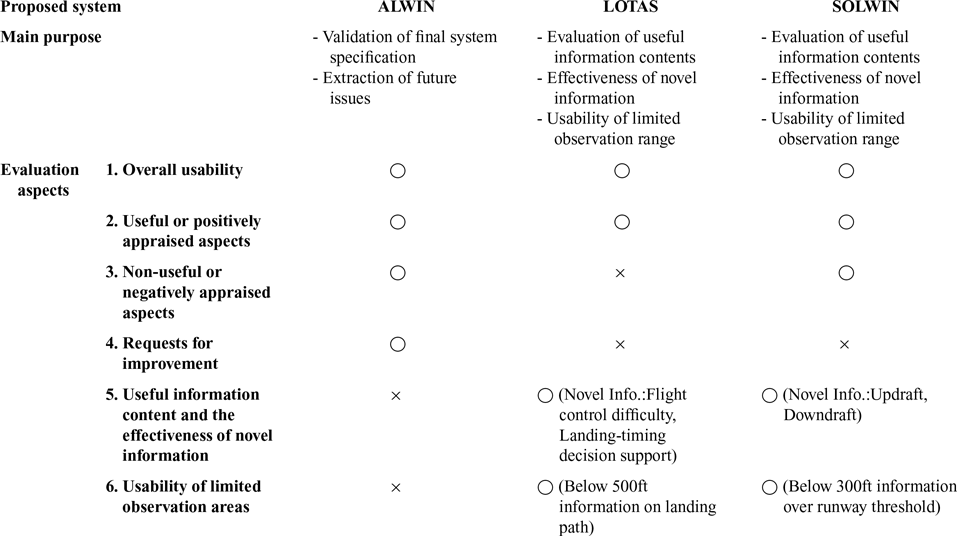
Evaluations of the operational usability of the ALWIN, LOTAS and SOLWIN systems were carried out with a number of airlines during system development, as shown in Table 8. Although the development of each system started previous to the operational evaluation described in this paper, we focus here on the final operational evaluation period of the system design in Table 8. Table 9 summarises the evaluation aspects of each system. The ‘○’ and ‘×’ in the cells of Table 9 indicate whether or not data were obtained to support the corresponding evaluation aspect.
Operational evaluations of ALWIN/LOTAS/SOLWIN

* LOTAS provides information only for runway 27; SOLWIN provides information only for runway 01
LOTAS and SOLWIN provides information at single runway (runway 27, runway 01), However ALWIN provides information at multiple runways. (wind data is different among runways).
Evaluation aspects of ALWIN/LOTAS/SOLWIN

The ‘○’ and ‘ב in the cell of Table 9 shows ‘Applicable’ and ‘N/A’, respectively.
Participants in the evaluation (pilots and ground-based operations staff from several Japanese airlines) were asked to rate the effectiveness and usability of each system in questionnaires and to provide comments. Information was gathered on which aspects of the system participants found to be useful or appraised positively, and which they did not find useful or appraised negatively.
4.1 ALWIN
Two operational evaluations were conducted in 2014 and 2015 at Narita and Haneda airports during the development of ALWIN with two Japanese airlines(Reference Matayoshi, Iijima, Yamamoto and Fujita4). After these preliminary evaluations, the final ALWIN system specification was implemented by the JMA, and a final operational evaluation was conducted in 2016 as shown in Table 8. The final version of the system has been operated by the JMA at these airports since 2017.
The displayed information content has already been clarified in a previous study, so this paper deals with the final operational evaluation that focused on validating flight crew usability of the final system specification and to identify any remaining issues to be dealt with in the future, as shown in Table 9.
The evaluation of the final system specification focused on changes from the previous ALWIN version, since information on the utility of ALWIN for aircraft operations, shown in Fig. 8, had already been obtained.
General useful points of ALWIN expressed by flight crews.

Moreover, since JMA might decide to improve the system according to airline feedback, the flight crew questionnaire also asked for opinions about future improvements.
4.2 LOTAS
The LOTAS system was the first of our proposed new airport wind information systems. The desired information from the LOTAS system was selected based on a flight crew survey about windshear and turbulence at Shonai Airport carried out in 2010–2012. Following system development, evaluation of the design concept regarding the information content and the effectiveness of novel information (estimated flight control difficulty and landing-timing decision support) was carried out in 2013.
To verify the effectiveness of LOTAS, because improvement of wind situation assessment by ground-based operations staff was considered a highly important issue as mentioned in Section 3.2, the questionnaire targeted not only flight crew evaluation but also looked at the effectiveness of push mode operation.
In operations, the LOTAS ACARS message was provided by ground-based operations staff to flight crews once for each flight, approximately 20–30 minutes before landing, in relatively calm or constant wind conditions, and twice when north westerly winds with average speeds above 15kn or gusts were indicated on the LOTAS wind screen (those being conditions identified with turbulence and windshear due to the local topography at Shonai Airport). If an estimated flight control difficulty of ‘AMBER’ or ‘RED’ was indicated on the LOTAS wind screen, the LOTAS ACARS information was provided twice or a third time, according to the judgment of the operations officer.
Since the evaluation of the general utility of the LOTAS system and requests for improvement have been presented previously(Reference Iijima, Matayoshi and Yoshikawa5,Reference Matayoshi, Iijima, Yoshikawa and Ushio11) , these discussions are omitted from this paper. However, assessment of aspects that were carried over from the LOTAS design to the ALWIN and SOLWIN system designs are discussed here under the ALWIN and SOLWIN evaluations.
Since LOTAS has a limited observation range characteristic due to using a small wind observation sensor, we assess the usability of this limited observation range in this paper.
4.3 SOLWIN
Operational evaluation of the SOLWIN system began in 2018 following the results of the evaluation of the effectiveness of ALWIN, as shown in Table 8. To compare the difference between pull and push mode operations, one participating airline, Airline A, used the system in pull mode while the other airlines used it in push mode. Flight crews obtained SOLWIN ACARS information at around the same time as routine airport weather information from ATIS broadcasts, etc., that is approximately 30–40 minutes before landing. Ground-based operations staff also uplinked SOLWIN ACARS messages to flight crews upon their request. Radio voice communication advising the wind situation was also conducted when windshear was detected by SOLWIN or on flight crew request.
Since the SOLWIN evaluation was the world’s first use of wind information obtained by Doppler SODAR to support aircraft operations, the information content and the effectiveness of the novel vertical wind information was evaluated to validate the effectiveness of our design concept.
Along with examining the utility and effectiveness of the information provided, we evaluated the usability of the limited observation area of the Doppler SODAR sensor. It was expected that the questionnaire responses would be particularly useful and revealing regarding the usefulness of the system to support operations because participants included not only flight crews, who were familiar with ALWIN (Airline A), but also crews who were not familiar with such operational evaluations (Airlines B, C and D).
5.0 RESULTS
5.1 Overall usability by flight crews
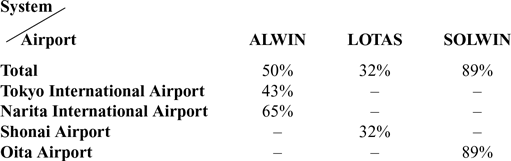
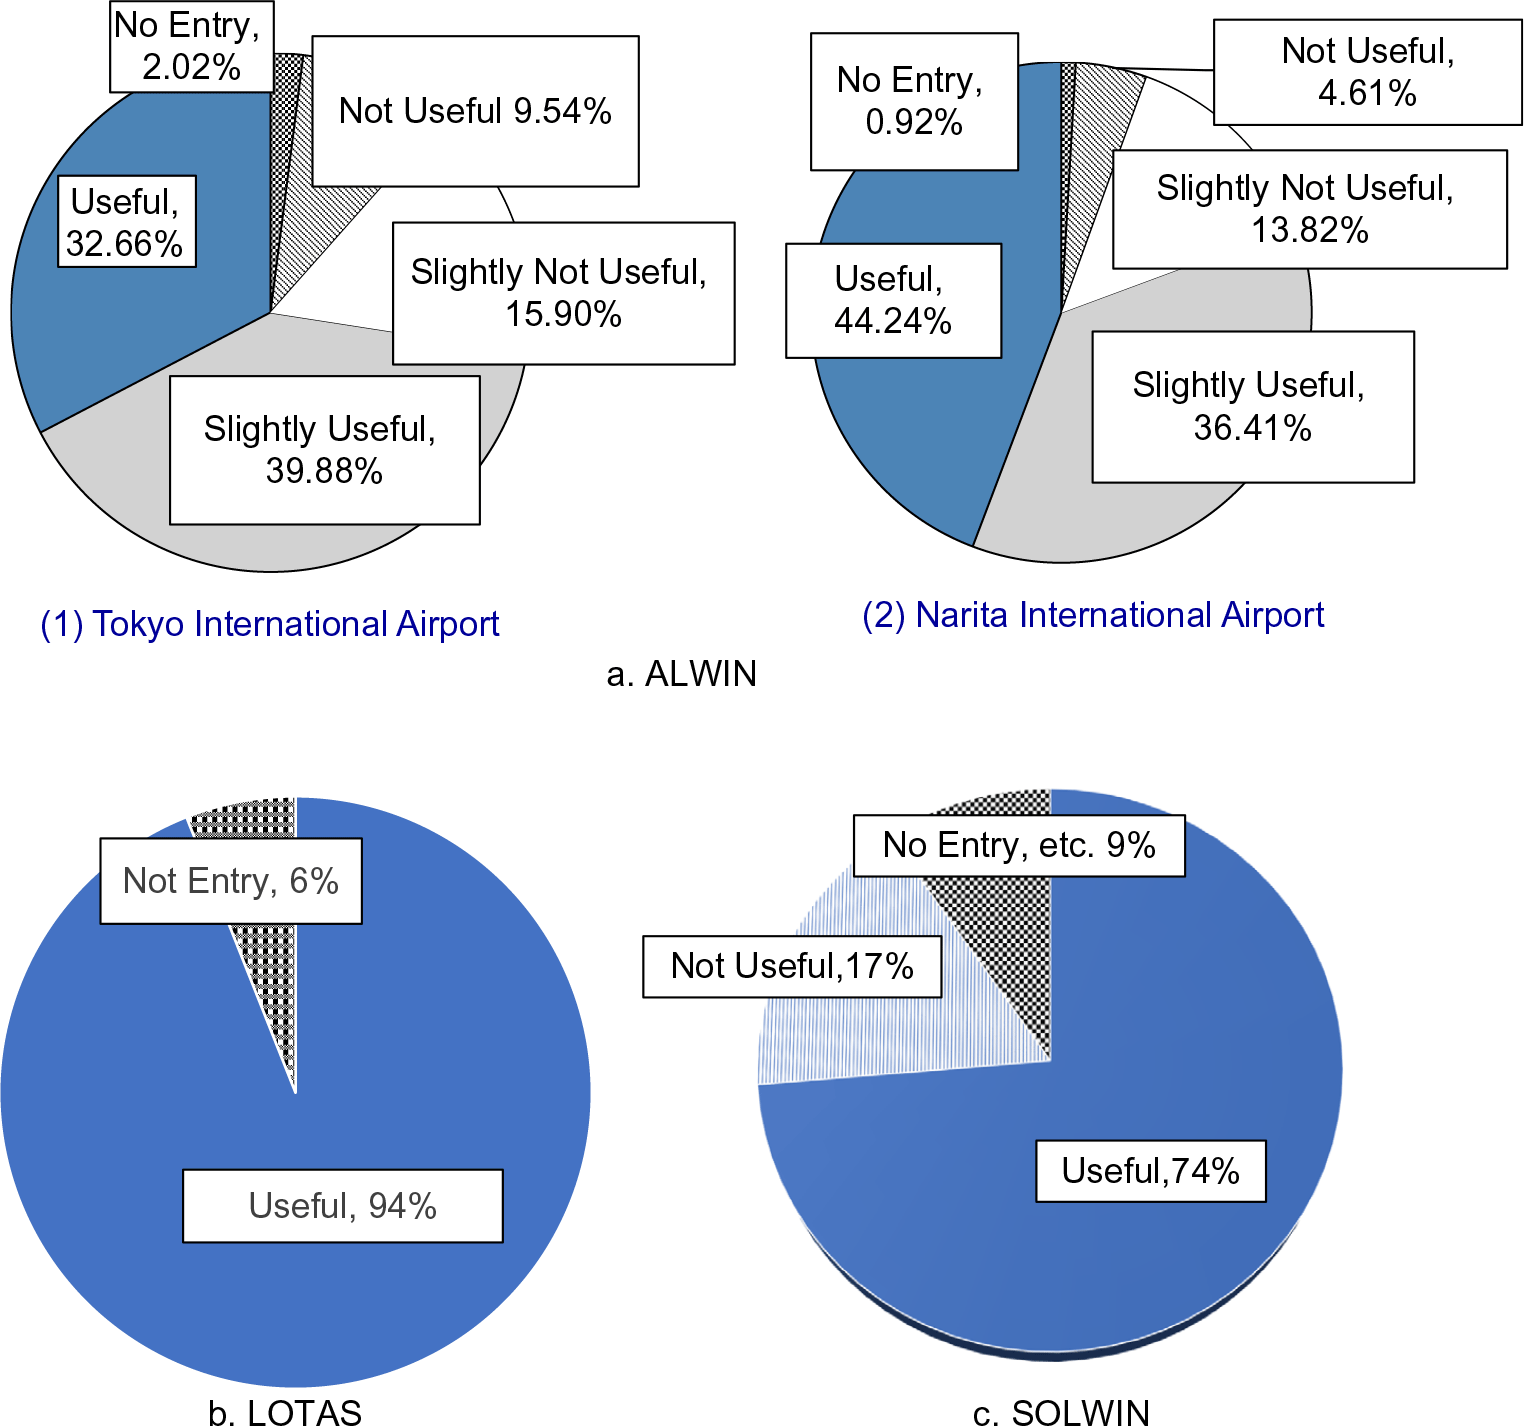
Table 10 shows the proportions of landing operations in which system ACARS messages were obtained by (pull) or provided to (push) flight crews, and Fig. 9 shows overall pilot evaluation results of each system at each airport where it was deployed. It should be noted that rating scales used in the questionnaires differed among each system due to modifications to improve the usability questionnaire after each evaluation. The rating scale of ALWIN had four points: ‘not useful’, ‘slightly not useful’, ‘slightly useful’ and ‘useful’; while those of LOTAS and SOLWIN had only two points: ‘not useful’ and ‘useful’.
ACARS acquisition rates

Overall flight crew usability ratings.

For ALWIN, approximately 65% of flight crews at Narita Airport and 43% of flight crews at Haneda Airport acquired ALWIN ACARS by pull operation, as shown in Table 10. Of those that responded, more than 80% of the flight crews at Narita and more than 70% of the flight crews at Haneda considered ALWIN to be ‘slightly useful’ or ‘useful’, as shown in Fig. 9(a).
For LOTAS, 32% of participating airlines’ flights landing at Shonai Airport on runway 27 were provided with information by ACARS message through push operation. Figure 9(b) shows that 94% of flight crews who responded considered the LOTAS ACARS message information to be ‘useful’.
For SOLWIN, approximately 90% of flight crews acquired SOLWIN ACARS at Oita Airport for landing, as shown in Table 10. Figure 9(c) shows that more than 70% of flight crews who responded considered SOLWIN to be useful.
5.2 Useful or positively appraised aspects by flight crews
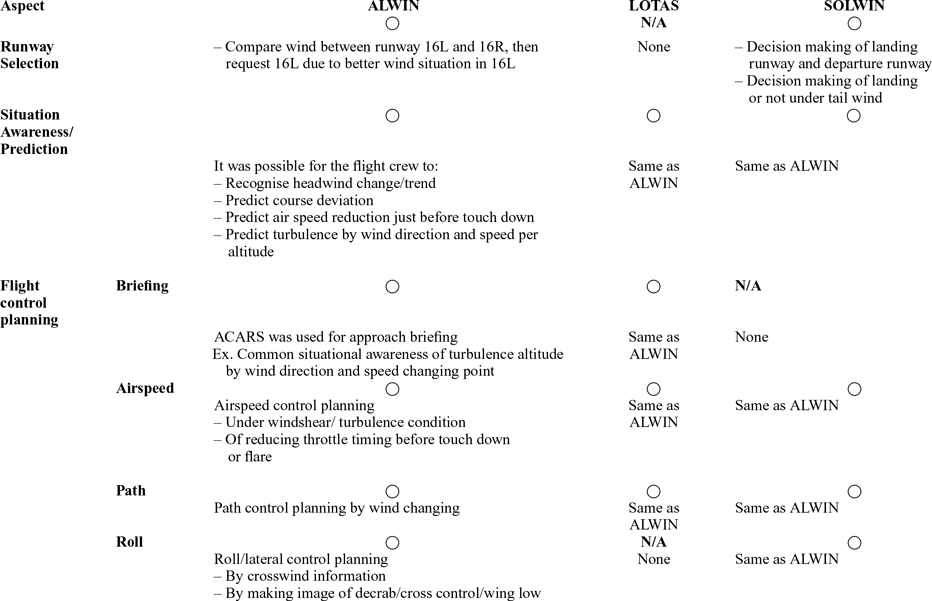
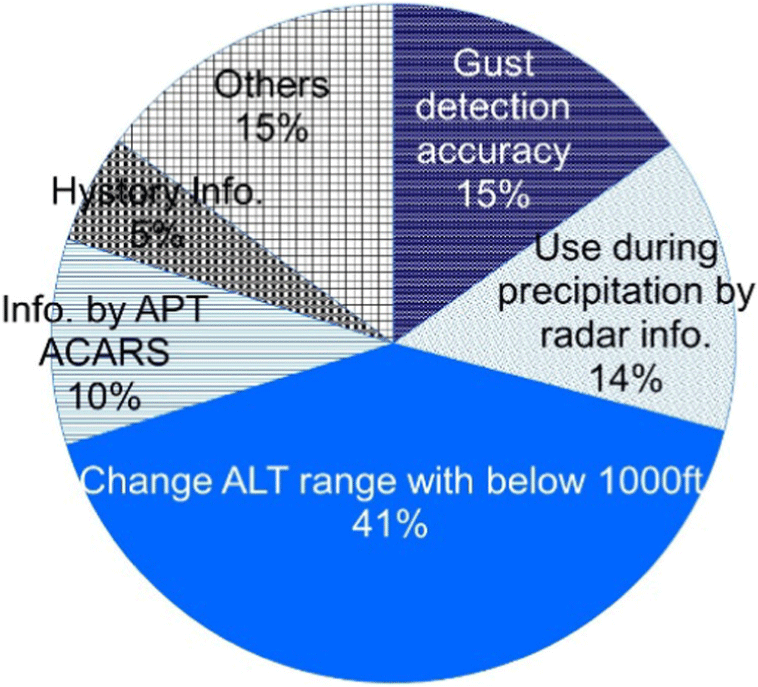
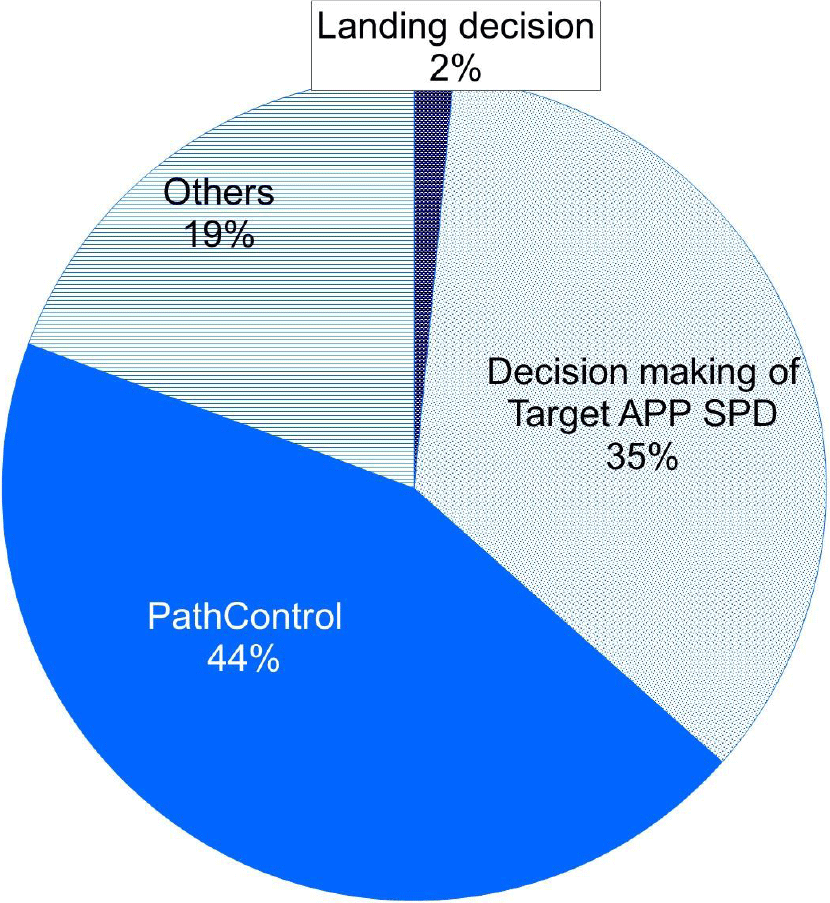
Flight crew comments on which aspects of the ACARS messages were found to be useful are summarised in Table 11. A ‘○’ in a table cell indicates that the comments obtained were made supporting the usefulness of an aspect, while ‘N/A’ indicates that no such comments were obtained. Figures 10 and 11 breaks down the proportions of questionnaire responses on aspects of ALWIN and SOLWIN messages that participants found useful or appraised positively.
Useful aspects of system ACARS messages

*decrab: To straighten out and align the crabbing aircraft with the runway just before touchdown.
Changes regarding useful aspects of ALWIN from previous version from collected questionnaire data.

Useful aspects of SOLWIN from collected questionnaire data.

5.3 Non-useful or negatively appraised aspects by flight crews
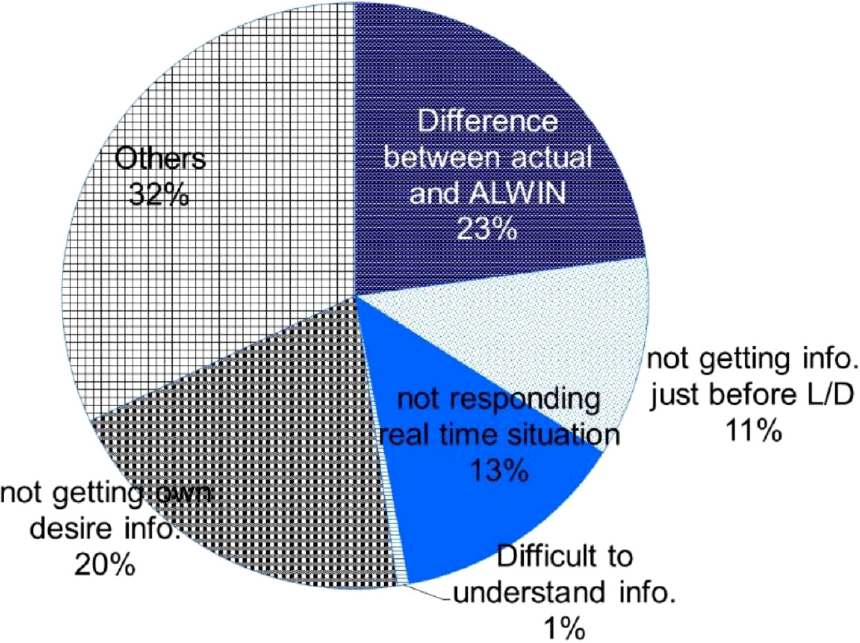
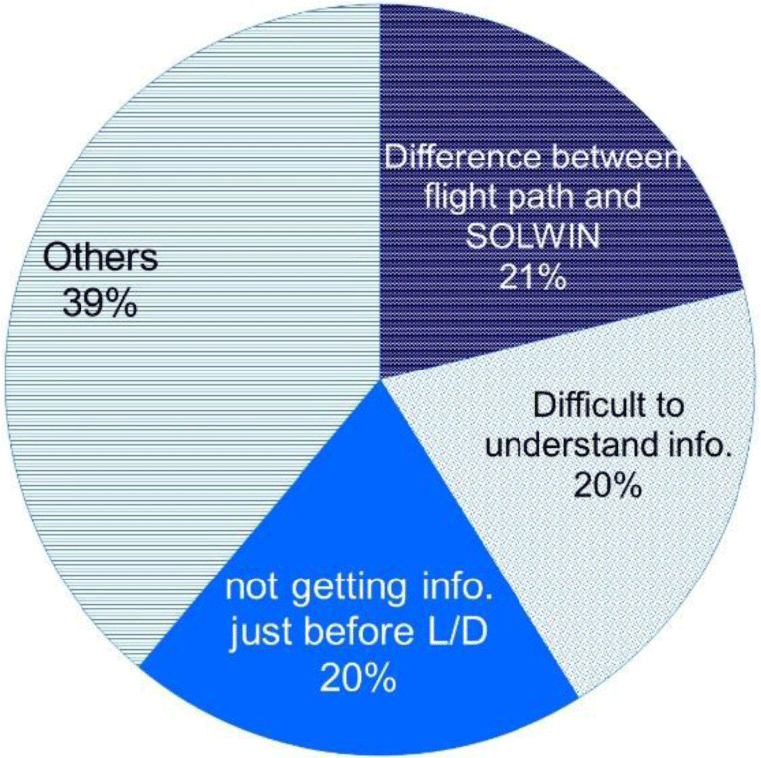
Figures 13 and 14, respectively, show aspects of the ALWIN and SOLWIN systems that flight crews did not consider to be useful or appraised negatively. (As described in Section 4.2, LOTAS is omitted.)
5.3.1 ALWIN
As shown in Fig. 13, regarding the evaluation of ‘difference between actual wind situation and ALWIN’, we collected many free comments that the actual wind situation was found to be more turbulent than had been indicated by ALWIN. These results were provided to the JMA, and the turbulence detection function was improved as a result.
Flight crew requests for SOLWIN implementation.

Non-useful or negatively appraised aspects of ALWIN.

Non-useful or negatively appraised aspects of SOLWIN.

Regarding ‘not getting own desire info (information)’, many comments were made relating to APT ACARS. During a certain period of the evaluation, high altitude APT ACARS data could not be provided at Haneda Airport due to the unavailability of Doppler lidar measurements.
5.3.2 SOLWIN
As shown in Figs 13 and 14, the aspects that were found not to be useful or were negatively appraised with the ALWIN system also received the same appraisal in the SOLWIN evaluation; that is, ‘difference between flight path (actual wind situation) and SOLWIN’ and ‘not getting info (information) just before landing’.
For the results of ‘others’, we obtained the following comments:
Some flight crews did not feel a need to use SOLWIN when the wind was relatively calm, and so evaluated it as ‘not useful’.
Other crews rated SOLWIN information as ‘not useful’, since the observation range of Doppler SODAR is limited and the winds were not sufficiently strong.
5.4 Requests for improvement
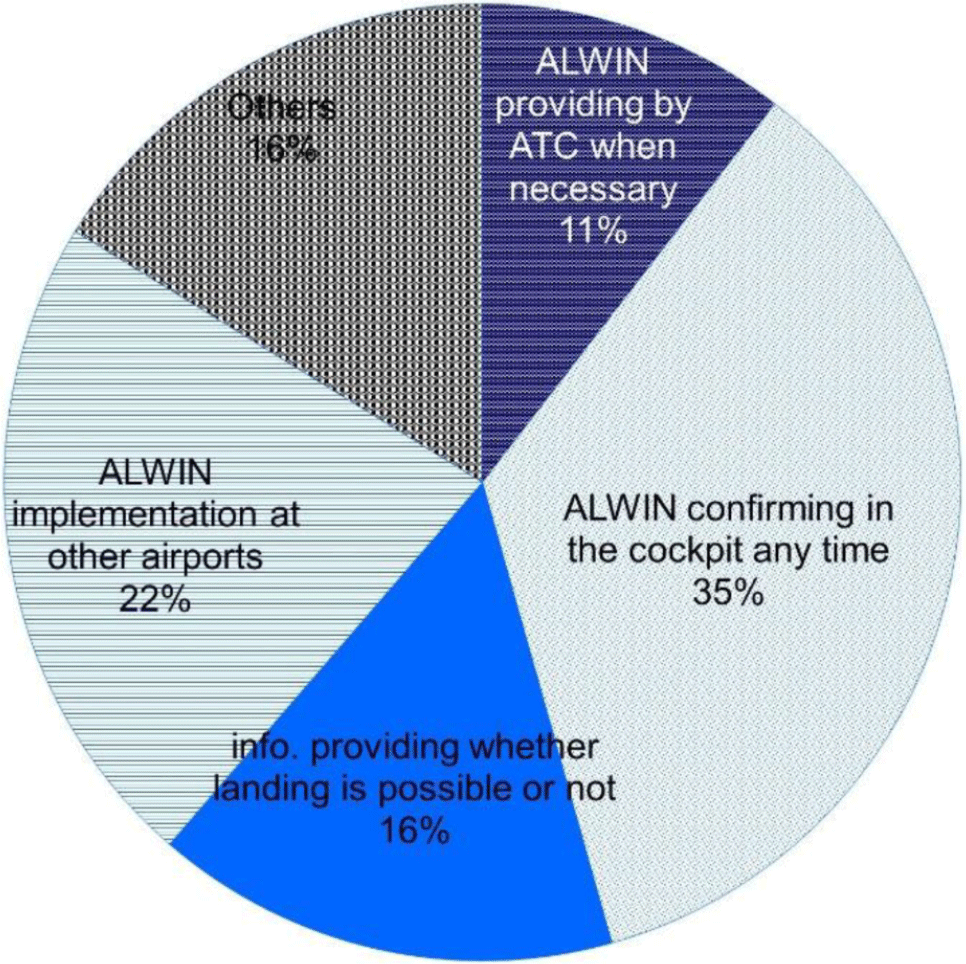
Figure 15 shows the requested items for improvement and their frequency for the ALWIN system. As already stated in Section 4.0, improvement requests for LOTAS and SOLWIN are not discussed here.
Requests for improvement.

As shown in Fig. 15, the requests were, in decreasing rank order, ‘ALWIN confirming in the cockpit any time’, ‘ALWIN implementation at other airports’, ‘information (info) providing by whether landing is possible or not’ and ‘ALWIN providing ATC (Air Traffic Control) when necessary’.
5.5 Useful information content and the effectiveness of novel information
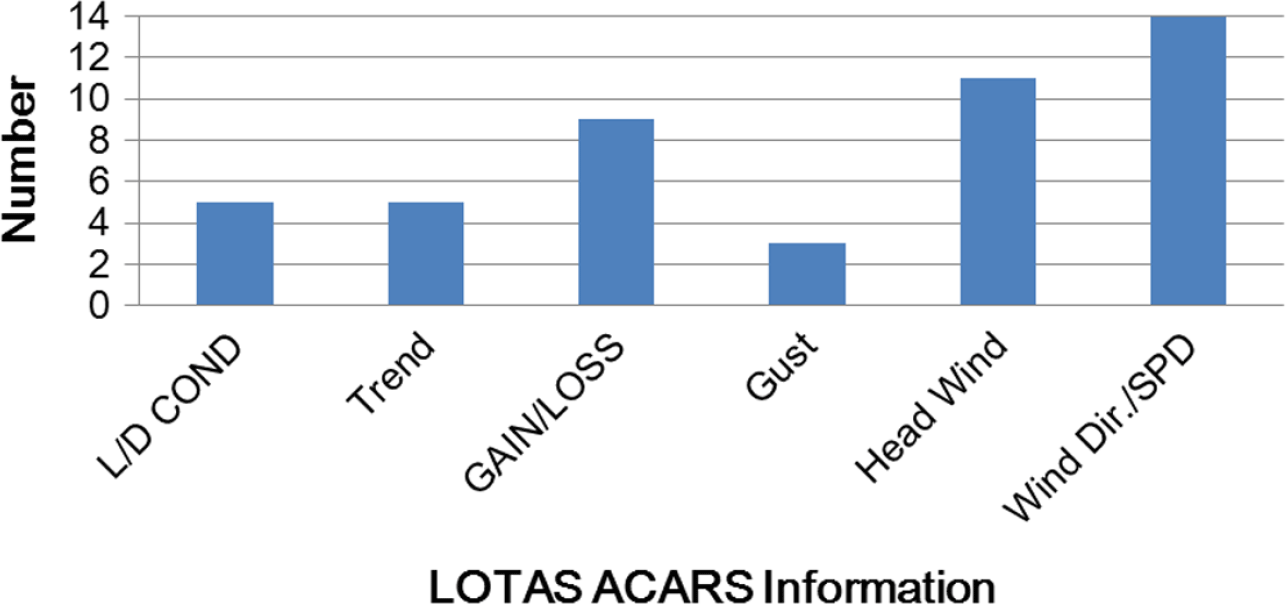
Regarding the evaluation of the useful items of information and the effectiveness of the novel information items, Figs 16–18 show the flight crew evaluation results of the useful contents of the proposed LOTAS ACARS message and the operation officer evaluation results of the useful contents of the LOTAS display as alert information and landing-timing decision support information, respectively.
Useful contents of LOTAS ACARS for flight crew(Reference Iijima, Matayoshi and Yoshikawa5).

Useful contents of LOTAS Web for operation officer: Alert information aspects(Reference Iijima, Matayoshi and Yoshikawa5).

Useful contents of LOTAS web display for operation officer: Landing-timing decision aspects(Reference Iijima, Matayoshi and Yoshikawa5).

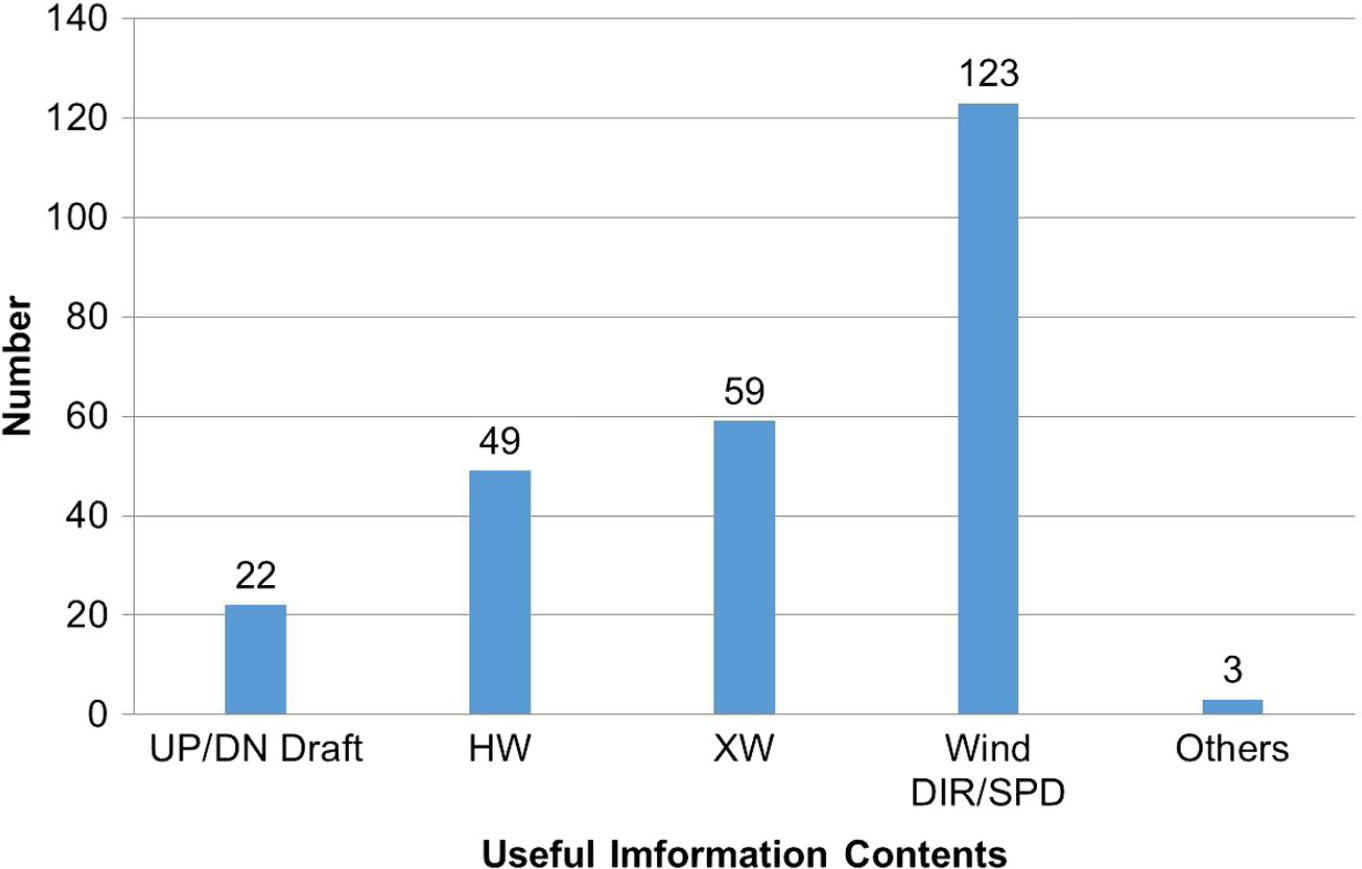
Figure 19 shows collected data regarding the useful information content of SOLWIN.
5.5.1 LOTAS
(a) ACARS text display for flight crews
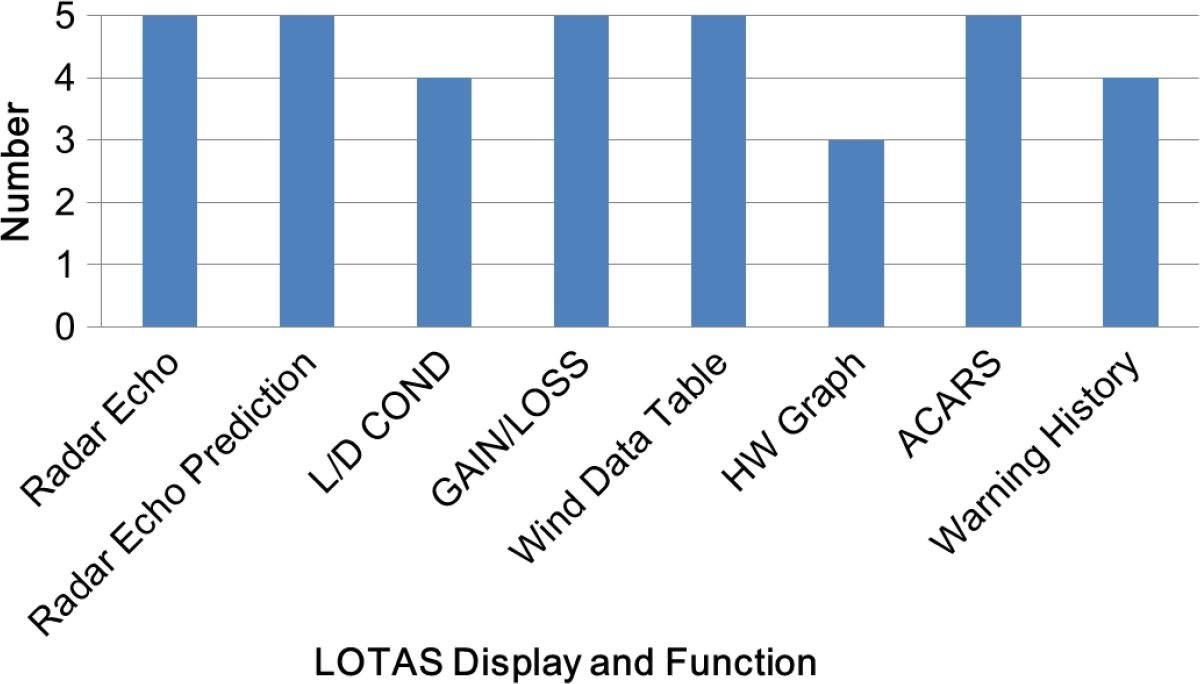
As shown in Fig. 16, the information items ‘Wind Direction and Speed on Landing Path (Wind DIR/SPD)’, ‘Headwind on Landing Path (Headwind)’ and ‘GAIN/LOSS Wind Information (GAIN/LOSS: Head/Tail Windshear Information)’ were rated as comparatively more useful than other items.
Useful contents of SOLWIN ACARS for flight crew for flight crew.

Regarding the ‘Headwind Graph’, we obtained many comments that the graph was helpful and effective because it gave flight crews an intuitive understanding of the wind situation, helping them to anticipate wind changes during approaches.
(b) Web display for operation officers
Regarding alert information, Fig. 17 shows that ‘Radar Echo’, ‘10-min later prediction of Radar Echo (Radar Echo Prediction)’, ‘GAIN/LOSS Wind Information (Head/Tail Windshear Information) (GAIN/LOSS)’, ‘Wind Direction and Speed (Headwind Component) Data Table (Wind Data Table)’ and ‘ACARS Text Conversion Function (ACARS)’ were rated as relatively more useful than other items.
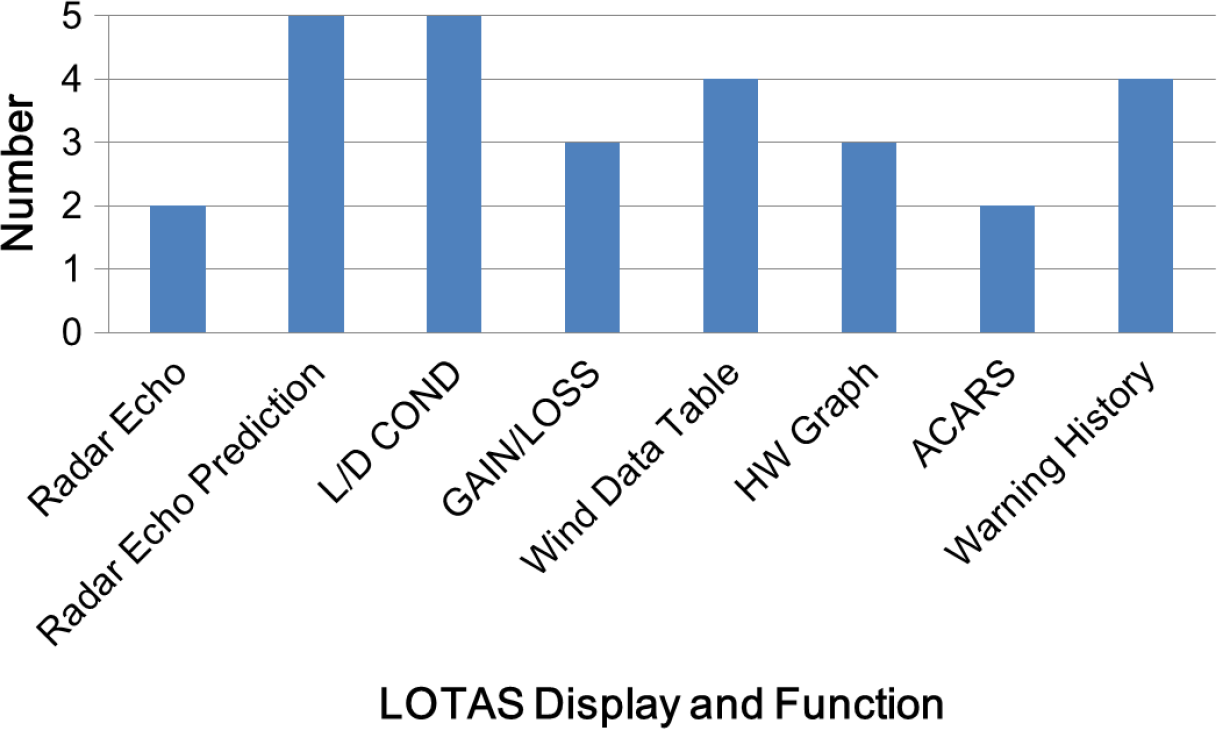
Regarding landing-timing decision support, Fig. 18 shows that all five operations officers who participated rated the ‘10-min prediction of Radar Echo (Radar Echo Prediction)’ and ‘L/D COND’ as ‘useful’, while ‘Wind Direction and Speed (Headwind Component) Data Table (Wind Data Table)’ and ‘Warning History’ functions were rated as ‘slightly useful’.
Regarding the appropriateness of the radar echo display area (distances of 5 or 10NM from airport, altitudes below 2km) for landing-timing decision support, we obtained subjective rating scores on a four-point scale of ‘inappropriate’, ‘slightly inappropriate’, ‘slightly appropriate’ and ‘appropriate’. All five operations officers selected ‘appropriate’.
5.5.2 SOLWIN
As shown in Fig. 19, the higher utility information contents were in rank order ‘Wind DIR/SPD (wind direction and speed)’; ‘XW (crosswind)’, which includes crosswind shear; ‘HW (headwind)’, which includes gain/loss of wind speed; and ‘UP/DN Draft (up and down draft)’. It should be noted that this information is obtained from data measured at heights up to 300ft at the runway threshold.
5.6 Usability of limited observation areas
5.6.1 LOTAS
(a) Wind information below 500ft
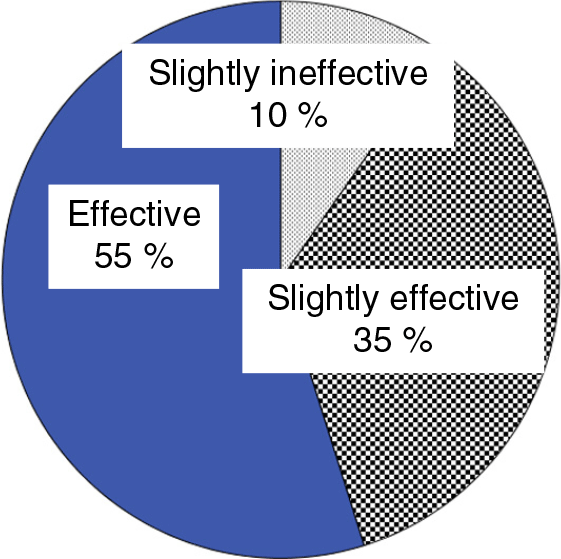
As shown in Fig. 20, about 90% of flight crews evaluated the wind information below 500ft provided by LOTAS as ‘effective’ or ‘slightly effective’. We obtained many comments regarding the ‘slightly effective’ evaluation, which indicated that although information on winds below 500ft is sufficient for turbulence awareness, information on winds below 1,000ft is desirable to help decide the flap setting to be used for landing. In the final evaluation of ALWIN, it was found that providing wind information below 1,000ft contributed in particular to the system’s utility, as mentioned in Section 5.2 and shown in Fig. 10.
(b) Radar echoes below 2km altitude within a 10NM radius of the airport
Usability of LOTAS wind information below 500ft(Reference Iijima, Matayoshi and Yoshikawa5).

Although the effectiveness of this information for landing-timing decision support is confirmed by Fig. 18, we obtained the following interesting comments from one operations officer who selected ‘slightly useful’:
If a 20-minute prediction of radar echoes is possible, it will be useful to decide whether or not aircraft should start their approach.
The 10-minute prediction of radar echoes is useful for deciding whether or not aircraft should ‘continue’ their approach.
5.6.2 SOLWIN
As mentioned in Section 5.2.2, we obtained many flight crew comments in the category ‘others’ relating to SOLWIN’s limited observation range. Typical comments show that providing wind information only below 300ft is insufficient, and flight crews requested wind information above 300ft as an improvement.
6.0 Discussion of Results
6.1 Overall usability by flight crews
As mentioned in Section 5.1, in summary, more than 70%~80% of the flight crews who responded to the questionnaires rated our proposed new airport low-level wind information systems as useful, and we therefore consider that they are effective for supporting normal aircraft operations.
6.2 Useful or positively appraised aspects by flight crews
As shown in Table 11, the information provided by each system was considered to be applicable to improving situational awareness of low-level wind disturbances, enabling their prediction and for flight control planning. It is therefore possible that the provided information might contribute not only to greater safety but might also reduce the number of go-around events that disrupt smooth operations, particularly because crews will be able to predict the reduction of airspeed due to windshear, plan flight control strategy and make runway selections accordingly.
From the collected questionnaire data, improvement of the FNL ACARS information – changing the altitude range of the headwind graph from 500ft in the previous ALWIN version to 1,000ft in final ALWIN version – was found to have particularly contributed to the utility of ALWIN shown in Fig. 10. As mentioned in Section 3.1.3, regarding the FNL ACARS design concept, this result clarified that wind information below 1,000ft is important for stabilised approaches. The effects of improving ‘gust detection accuracy’, ‘usage during precipitation by radar information’ and other aspects from the previous ALWIN version were also revealed as shown in Fig. 10.
For LOTAS, no flight crew comments were obtained regarding roll/lateral control because LOTAS does not directly provide crosswind information.
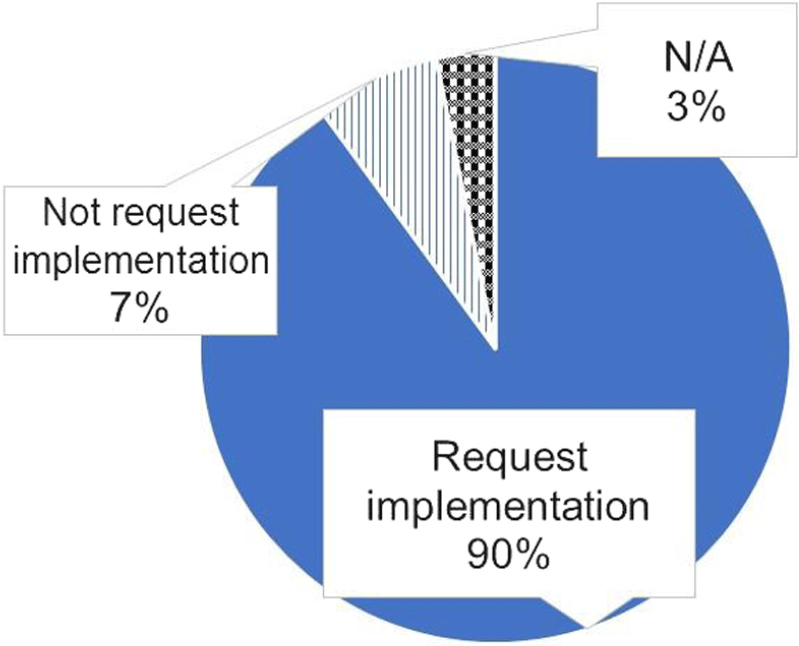
SOLWIN contributed to aircraft operation planning, especially concerning path control and deciding the target approach airspeed, as shown in Fig. 11. These results correspond to the summary of flight crew comments in Table 11 and the proportion of requests for SOLWIN implementation in Fig. 12.
6.3 Non-useful or negatively appraised aspects by flight crews
6.3.1 ALWIN
This result, mentioned in Section 5.3, indicates that flight crews regard high altitude information as important, and we hypothesise that APT ACARS supports flight planning (e.g. timing of configuration changes). In fact, one flight crew at Haneda Airport commented directly that they determined the target approach speed and timing of configuration changes from APT ACARS information. It is considered from a number of flight crew comments that the reason why the ALWIN system was rated as more useful at Narita Airport than at Haneda, as mentioned in Section 5.1, was due to the missing high-altitude information from APT ACARS messages.
Considering the aspects of ‘not getting information just before L/D (landing)’ and ‘not responding real time (changing wind) situation’, since flight crews could not obtain ALWIN ACARS just before landing due to the ‘sterile cockpit’ concept(Reference Sumwalt16), it is desirable to give future consideration to the real-time provision of ALWIN-type information.
6.3.2 SOLWIN
Since SOLWIN cannot measure wind data on the approach flight path, unlike ALWIN, a difference between the actual encountered wind situation and SOLWIN wind information is considered unavoidable.
Nevertheless, there were almost unanimous flight crew requests for SOLWIN implementation, as shown in Fig. 12, and we obtained positive comments shown in Table 11 as mentioned in Section 5.2. These results indicate that SOLWIN will be useful for regional airports, although some issues remain to be addressed in the future.
From the result of ‘difficult to understand info. (information)’, it is considered that the presentation of updraft and downdraft information is novel and crews had no experience as to how it could be applied, and that the ACARS message text itself may also be hard for flight crews to understand. A method for presenting the new severity metric message and how to apply it are future issues.
For the results of ‘others’, we discuss SOLWIN’s observation range limitation in Section 5.6.
6.4 Requests for improvement
As mentioned in Section 5.4, the result ‘ALWIN confirming in the cockpit any time’ corresponds to the non-useful aspects of ‘not getting information just before landing’ and ‘not responding real time (changing wind) situation’.
We are considering ways to present not only ALWIN but also LOTAS/SOLWIN information using in-cockpit graphical displays such as Electronic Flight Bag (EFB) or MFD Multi-Function Display (MFD).
We are also considering another approach using an airborne Doppler lidar system to directly provide predictive airspeed information and/or target approach speed, which takes into account windshear/turbulence presented on the cockpit Primary Flight Display (PFD) to support normal operations(Reference Iijima, Uemura, Matayoshi, Entinger, Matsumoto and Ueda17), in addition to providing wind information by airport-based Doppler radar and lidar.
For the request ‘ALWIN implementation at other airports’, we are mainly focusing on implementation of the SOLWIN system at regional airports as a cost-effective means of providing turbulence and windshear information.
Regarding the ‘info. (information) providing whether landing is possible or not’ request, as previously stated regarding the evaluation result for LOTAS in Section 5.5, a new severity metric message and its application are future issues to be addressed.
6.5 Useful information content and the effectiveness of novel information
6.5.1 LOTAS
(a) ACARS text display for flight crews
These results mentioned in Section 5.5.1 support our hypothesis regarding the ACARS text display design concept that converting spatial information into a textual graph promotes intuitive understanding of headwind changes with altitude. We consider that an intuitive understanding is highly important, as mentioned in the design concept, because a rapid but accurate situation assessment of wind disturbances is required during the high workload approach flight phase.
‘L/D COND’ (estimated flight control difficulty) was rated as effective information by fewer flight crews than the ‘Headwind Graph’. While the L/D COND indication is accurate (that is, it agrees with actual conditions) nearly 70% of the time(Reference Matayoshi, Iijima, Yoshikawa and Ushio11), it is possible that fewer crews regarded it as useful for aircraft operations because the information itself is novel and they had no experience as to how it could be applied. Moreover, it is possible that the meaning of L/D COND was not always sufficiently understood, since some crews asked about it after landing. Because of this, a method for presenting the new severity metric message and understanding how to apply it are future issues to be addressed.
(b) Web display for operation officers
These results mentioned in Section 5.5.1 and in Fig. 18 indicate the importance of predictive and historical information for landing-timing decision support. Additionally, it is considered that the flight control difficulty information (L/D COND) provided direct hints for ground-based operations staff to advise flight crews of the wind situation, as we hypothesised in the LOTAS operational concept in Section 2.2. Furthermore, one operation officer commented that information on changes of L/D COND provided by the ‘Warning History’ shown in Fig. 4(b) might be applicable to deciding whether or not to start the approach because past information on L/D COND may help the operator to predict its future state.
Thus, it is considered that LOTAS display and functions are effective for low-level wind disturbance alerting and landing-timing decision support. The novel L/D COND information was considered by operation officers to be effective for providing a direct cue with which to advise flight crews on the wind situation, although use of the same information by flight crews is a topic for future discussion.
6.5.2 SOLWIN
From the results in Fig. 19 and Table 10, it is considered that the proposed SOLWIN ACARS message is almost as effective for supporting aircraft operations as the other displays. However, Fig. 19 suggests that flight crews were not able to use updraft and downdraft information. On the other hand, the evaluation of ‘Wind DIR/SPD (Wind Direction and Speed)’ as the most useful information item corresponds to the evaluation result of LOTAS mentioned above and ALWIN in our previous study results. We suppose that since flight crews are familiar with the notation of wind direction and speed, which are normally provided by air traffic control and in other weather information, they were easily able to use this information.
Since flight crews mainly control not vertical speed but airspeed in windshear/turbulence conditions, presenting updraft and downdraft information as airspeed loss or gain information (in kn) rather than vertical speed might make airspeed control easier. Moreover, if updraft and downdraft information were to be included with such airspeed gain/loss information, the ACARS display would be further simplified and could provide more strategic information because flight crews would be able to use the SOLWIN information directly for airspeed control. Also, if the ACARS display were further simplified, the ‘difficult to understand info. (information)’ criticism of SOLWIN mentioned in Section 5.3 might be improved. How updraft and downdraft information should be displayed is therefore a subject for future discussion.
6.6 Usability of limited observation areas
6.6.1 LOTAS
As mentioned in Section 5.5.1, it is considered that when predicting the future weather situation from 10 to 20 minutes of historical data, information on changes in ‘L/D COND’ provided by the ‘Warning History’ shown in Fig. 4(b) might be applicable to deciding whether or not to start an approach.
It may therefore be possible to gain further effectiveness by increasing the radar echo prediction time to 20 minutes, enabling better advice from operations officers to crews as to when to start their approaches. This will be possible if the radar observation range is increased.
Summarising the usability of the limited observation area of the LOTAS system mentioned in Section 5.6, although the low-cost Doppler lidar and radar sensors(Reference Matayoshi, Iijima, Yoshikawa and Ushio11) used in this evaluation have only a tenth of the observation range of systems installed at major airports, they have been proven to be effective in providing operationally useful wind information up to 500ft altitude and radar echo information below 2km in altitude within a 10NM radius of the airport. The low-cost of these sensors and their effectiveness demonstrated by this evaluation might accelerate the installation of LOTAS at regional airports that are prone to severe low-level wind disturbances.
6.6.2 SOLWIN
Although SOLWIN’s Doppler SODAR wind observation sensor was installed at the runway threshold in this evaluation, it is necessary to install the sensors at locations that are highly correlated with turbulence or windshear on the landing path, for example due to local topography. If sensors can be installed at such locations where their data will be most effective, wind situational awareness might be improved even if only wind data below 300ft are available. It is therefore recommended that unless the Doppler SODAR observation range can be improved, the SOLWIN sensor locations should be determined at each airport by investigating the correlation between SOLWIN wind measurement data and flight data on the landing path.
There were also comments requesting installation of Doppler SODAR not only for the principal runway direction but along the landing paths at both ends of the runway. In fact, during evaluations, even if a flight crew landed not on runway 01 but on the reciprocal runway 19, where SOLWIN information was not provided, they still used the SOLWIN system. Questionnaire data showed that approximately 20% of flights that used SOLWIN landed on runway 19, and it is considered that in such cases, flight crew estimated the runway 19 approach wind situation from the SOLWIN information for runway 01. While it will be possible to provide wind information for both ends of a runway by installing sensors under both approach paths, this will increase cost and might negate SOLWIN’s low cost advantage shown in Table 1. We suppose that cost benefit analyses of not only the SOLWIN system but also LOTAS and ALWIN are future issues.
7.0 CONCLUSIONS
This paper describes the design concepts and validations of three types of new airport low-level wind information systems that provide landing aircraft with quantitative and visualised wind information to enhance pilot situational awareness of wind conditions and ultimately to mitigate air service disruption due to low-level wind disturbances. The three types of systems, ALWIN and LOTAS using Doppler radar/lidar and SOLWIN using Doppler SODAR, have differing capabilities and costs and are intended to offer cost-effective solutions for a range of airports depending on the airport’s scale and local weather characteristics. The results from the evaluation of these systems during actual airline flight operations and issues for future consideration that arose are summarised as follows.
1. Overall effectiveness verification
Given that 70~80% of flight crew ratings evaluated the systems as useful, our proposed new airport low-level wind information systems are considered to be effective for supporting aircraft operations.
The information provided by the systems is considered to improve situational awareness of low-level wind disturbance, to enable its prediction and to allow flight control planning. Thus, the information by these systems might contribute not only to greater safety but might also reduce the number of go-around events that disrupt smooth operations, particularly because crews will be able to predict the loss of airspeed due to windshear, plan flight control strategy and make appropriate runway selection.
The ACARS text display design concept of converting spatial information into a textual graph promotes intuitive understanding of headwind changes with altitude.
Wind direction and speed information both on the approach path and above the runway threshold was appraised as the most operationally useful information content provided by the ALWIN, LOTAS and SOLWIN systems.
2. System effectiveness verification
The ALWIN and LOTAS operational evaluation results indicate that information on winds below 1,000ft on the approach and landing path is important for achieving a stabilised approach.
ALWIN APT ACARS usability results confirmed that the importance of high-altitude wind information on the approach and landing path for supporting flight planning (e.g. the timing of flap/gear extension).
The LOTAS display and functions are effective for low-level wind disturbance alerting and landing-timing decision support.
90% of participating flight crews requested SOLWIN implementation.
The SOLWIN system contributed to aircraft operations planning, particularly for path control and target approach airspeed determination.
3. Usability of novel information
A new estimated flight control difficulty metric, L/D COND, is considered to be effective in providing a direct cue for operations officers to advise flight crews of the wind situation. However, its application to flight crews is an issue for future discussion.
The method for presenting the new severity metric message in the SOLWIN system (as updraft and downdraft indications) and how to apply it are future issues.
4. Usability of the limited observation area of LOTAS and SOLWIN
Although the low-cost Doppler lidar and radar sensors used in the LOTAS evaluation had only a tenth of the observation range of systems that are typically installed at major airports for conventional windshear detection and alerting, they are proven to be effective for providing operationally useful wind information up to 500ft altitude and radar echo information below 2km altitude within a 10NM radius of an airport.
The low cost of these sensors and their effectiveness demonstrated by this evaluation might accelerate the installation of LOTAS at regional airports that are prone to severe low-level wind disturbances.
If the observation range of Doppler SODAR cannot be improved, the location of the SOLWIN sensor(s) should be determined at each airport by investigating the correlation between SOLWIN wind measurement data and flight data on the landing path.
Flight crews landing on the reciprocal runway to the runway for which the SOLWIN sensor was installed used the SOLWIN system.
5. General future issues
We are considering ways to present not only ALWIN but also LOTAS/SOLWIN information using in-cockpit graphical displays such as EFB (Electronic Flight Bag) or MFD (Multi-Function Display) to provide real-time wind information.
Cost benefit analysis of all three systems is a future issue.