


Introduction
The Improving Access to Psychological Therapies (IAPT) initiative was introduced in England to provide widespread access to primary mental health services for those experiencing mild to moderate depression and anxiety. Since its inception in 2007, demand has continued to increase. There are now more than 200 IAPT sites in England and the number of national referrals has reached more than 800000 (HSCIC, 2014). Although the increase in demand is a credit to the success of the IAPT initiative, it presents questions around how to best manage the continued delivery of effective evidence-based treatments in the face of such demand.
IAPT operates a stepped model of psychological intervention such that ‘low-intensity’ interventions are the first-line treatment for most clients before more intensive interventions are offered. Low-intensity interventions are primarily delivered by ‘psychological well-being practitioners’ (PWPs) who are trained to deliver evidence-based low-intensity interventions for depression, anxiety or stress as recommended by the National Institute for Clinical Excellence guidelines (NICE, 2004, 2009). ‘High-intensity’ interventions are reserved for those who have not improved following low-intensity interventions or for whom low-intensity treatment is not deemed suitable. In these cases the client receives an episode of individual CBT by an accredited CBT therapist.
Access to IAPT services may be via referrals from health and social care professionals or service users referring themselves directly. In the service studied, potential clients are screened based on referral information and if there are no obvious indicators to warrant refusal at that stage (e.g. psychosis), clients are contacted and a telephone assessment (‘triage’) date is offered. Those clients who are deemed suitable for IAPT input following triage are assigned to one of two levels of care (i.e. low- or high-intensity intervention) based on clinical need. Given the number of referrals that most IAPT services now receive, most services have a waiting list for triage and start of treatment (Department of Health, 2011). Overall, length of waiting times will depend on the match between demand and service capacity, and this applies at both levels of intervention.
IAPT is commissioned on the basis that it can prove its effectiveness in delivering evidence-based treatments for common mental health disorders (Richards & Suckling, Reference Richards and Suckling2008). At present, IAPT services are evaluated on a number of ‘key performance indicators’, one of which is the number of clients who ‘move towards recovery’ following treatment. A client has moved towards recovery if they start treatment as a ‘case’ (scoring above a threshold on at least one standard measure of depression or anxiety) and end treatment as a ‘non-case’ (below threshold on both measures). As part of routine practice within IAPT services, clients complete measures of depression and anxiety at each clinical contact allowing for clinical contact and change to be tracked over time. Outcome monitoring of this kind is a strength of the IAPT model in that service and client factors associated with outcomes can be examined even when clients do not complete therapy.
There is relatively little research which has examined factors related to recovery within IAPT services. The most comprehensive report is that published in 2011 by Gyani and colleagues which examined factors related to recovery in the first year of IAPT and synthesized data from 32 sites (Gyani et al. Reference Gyani, Shafran, Layard and Clark2011). Findings from this report suggest that (1) clients with higher starting scores are less likely to recover and receive a greater number of treatment sessions than those with lower starting scores, (2) self-referring clients are no more likely than GP-referred clients to recover, and (3) in general, a greater number of treatment sessions is associated with recovery. Findings also demonstrated that those services that had more experienced CBT therapists within a clinical team and those with a greater ‘step-up’ rate had better recovery rates. Finally, it was noted that primary diagnosis was significantly associated with recovery but there was a pervasive problem of inadequate reporting of client diagnosis.
Many of these findings are consistent with other psychotherapy research which has examined factors in relation to outcomes for CBT interventions. In line with Gyani and colleagues (Reference Gyani, Shafran, Layard and Clark2011), there is evidence to suggest that CBT is less effective the more severe the presenting problem (Hagby et al. Reference Hagby, Donnelley, Corry and Vos2006). However, where Gyani and colleagues found an effect of treatment length on recovery, a meta-analysis which synthesized data from over 33 studies, presents little evidence to suggest that the modality of treatment or length of treatment has an impact on outcome (Hagby et al. Reference Hagby, Donnelley, Corry and Vos2006). There is comparatively little research on the impact of waiting times on recovery; however, a study conducted in a primary-care setting which compared outcomes in a group who immediately received a guided self-help intervention compared to a wait-list condition, found no negative impact of an 8-week wait on outcomes (Lucock et al. Reference Lucock, Kirby and Wainwright2011).
The present audit
The present investigation considered what factors might be related to recovery within a London borough IAPT service. At the time of this audit, the rate of recovery within this service was 37%, a rate well below the standard which is expected by the Department of Health (i.e. a recovery rate of 50%; Department of Health, 2011) and below the average service recovery rate of 46%. The service was concerned to understand and to urgently address the declining rate of recovery.
In the months prior to this clinical audit, a number of changes and new pressures were presenting to the service. First, in line with most IAPT services, the number of referrals to the service had steadily increased since the service began: 350 referrals/month in 2010 to over a 1000 referrals/month in the latter part of 2012. In addition, this time was also marked by changes and reductions to a number of other psychotherapy services and Community Mental Health Teams within the borough and it was hypothesized that this too might be contributing to the sharp increase in referrals. Due to the increase in referrals, waiting times for assessment and treatment had increased and low-intensity therapists were facing pressure to engage clients for fewer sessions to open up access to as many clients as possible. The service had also undergone an 8% reduction in staff in the 9 months preceding the audit.
The aim of this audit was to examine the impact of two service-related factors (waiting times and number of clinical contacts) and one client factor (severity of anxiety and depression at initial assessment) in relation to a client's recovery status at the completion of treatment. It is hypothesized that recovery status will be negatively associated with starting scores and positively associated with the number of clinical contacts. As the increase in waiting times coincided with the decline in recovery rate, it was hypothesized that longer waiting times would be associated with poorer recovery.
A cross-sectional correlational design was used within this clinical audit. The period when the recovery rate was low (hereafter referred to as time 2) was compared with the same time the previous year when the recovery rate was higher (hereafter referred to as time 1). Three factors: waiting times, number of clinical contacts and starting scores on depression [Patient Health Questionnaire-9 (PHQ-9; Kroenke et al. Reference Kroenke, Spitzer and Williams2001) and anxiety Generalized Anxiety Disorder Questionnaire-7 (GAD-7; Spitzer et al. Reference Spitzer, Kroenke, Williams and Löwe2006)] were calculated and examined separately for each level of intervention (i.e. low-intensity intervention or ‘step 2’ and high-intensity intervention or ‘step 3’). These factors were examined in relation to recovery at two time points.
Method
Sample
Data were extracted from the IAPTus service database within a South London IAPT service. The borough is the fifth most deprived borough in London and the 14th most deprived in England. Thirty-two percent of households are considered as low income and over a third of residents are from ethnic minorities (Lambeth First, 2011). Data were extracted from the database to identify those clients who received any form of low-intensity treatment (psychoeducation, computerized CBT, guided self-help, group intervention or workshop) or received an episode of individual CBT treatment (with a high-intensity therapist) within a 2-month period (September and October) in 2011 and 2012 and had been discharged by the time of the analysis.
Staffing levels at the two time periods were 41.5 therapists (whole time equivalent) in September/October 2011 and 36.5 therapists in September/October 2012. The ratio of step-2 to step-3 therapists did not differ across the two time periods (46% of clinicians were step-2 therapists and 54% were step-3 therapists).
Measures
PHQ-9
The PHQ-9 is a 9-item self-report measure of depressive symptoms used routinely within IAPT services. Higher scores indicate greater severity. Scores range from 0 to 27. A score of 9 is considered the clinical cut-off and thus a score of ≤9 is required for IAPT ‘recovery’ (NHS England, 2014).
GAD-7
The GAD-7 is a 7-item self-report screening measure for generalized anxiety disorder (GAD) and used in IAPT services as a measure of anxiety symptomatology. Scores range from 0 to 21. A score of 7 is considered the clinical cut-off and thus a score of ≤7 is required for IAPT recovery (NHS England, 2014).
Procedure
The dataset includes only those who were considered ‘cases’ at triage (scores above the clinical cut-off on either the PHQ-9 or the GAD-7) and that had at least two questionnaire scores (to allow ‘recovery’ to be calculated). Thus, this audit excludes those who failed to engage following the initial referral and those who failed to make contact following triage.
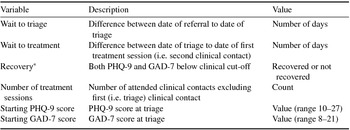
Once data were reduced to only include those clients who met ‘caseness’ at triage and had at least two clinical contacts, a total number of 988 client records were reviewed (454 at ‘time 1’ and 534 at ‘time 2’). Data pertaining to these client records were then obtained from IAPTus including information about contact with the service (e.g. date of referral/discharge and number of treatment sessions) and scores of depression (PHQ-9) and anxiety (GAD-7). Diagnosis was not included in the present dataset due to inconsistent and unreliable reporting across cases (see Table 1 for a list of included variables).
Included variables

PHQ-9, Patient Health Questionnaire; GAD-7, Generalized Anxiety Disorder Questionnaire.
* For some disorders (e.g. panic, post-traumatic stress, obsessive compulsive), disorder-specific measures are used and recovery is defined by a cut-off score for that particular measure. Those cases which had a disorder-specific measure were still included in this evaluation but recovery for that case was defined in terms of the PHQ-9 and GAD-7. This did not significantly change the recovery rates (i.e. overall recovery rates remained equally low even when disorder-specific measures of recovery were included) and allow for comparisons with the analyses completed by Gyani and colleagues (Reference Gyani, Shafran, Layard and Clark2011).
This investigation was considered a clinical audit and therefore did not require ethical review.
Results
Descriptive statistics
Prior to analyses, the reason for discharge was investigated for each time period to identify the proportion of cases that had been given a ‘dropped out’ of treatment code within the IAPTus database. At step 2, 29% had dropped out at time 1 compared to 22% at time 2. At step 3, 17% had dropped out at time 1 and 19% at time 2.
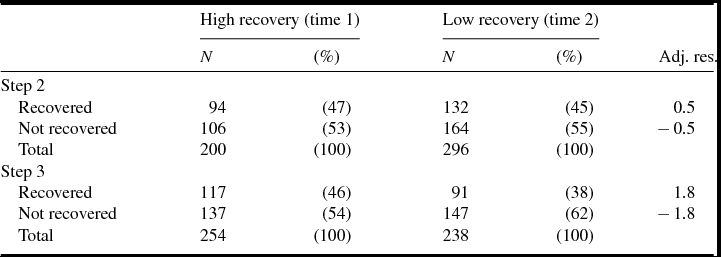
Table 2 displays the number of discharges and proportion of recovery at the two time periods. At both steps, the proportion who recovered decreased: from 47% to 45% at step 2 and from 46% to 38% at step 3. χ2 analyses revealed that there was no significant difference between the time periods on recovery status, although the difference was approaching significance at step 3 (step 2: χ2 1 = 0.28, p = 0.60; step 3: χ2 1 = 3.02, p = 0.08).
Number of discharges and proportion of recovery at a period of low and high recovery

Adj. res., Adjusted standardized residual.
Comparisons between time 1 and time 2
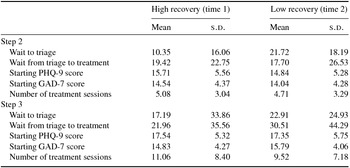
A series of parametric t tests were conducted to examine if there were significant differences between the time periods in terms of waiting times, starting scores and number of clinical contacts. All variables were normally distributed except the waiting time variables which were positively skewed; however, given this test was in relation to a large sample and the variances between the two groups were not significantly unequal, a parametric t test was selected. Where multiple comparisons were conducted the Bonferroni correction was applied. Results are presented by each step separately. Means and standard deviations are presented in Table 3.
Means and standard deviations for each variable at a period of low and high recovery

PHQ-9, Patient Health Questionnaire; GAD-7, Generalized Anxiety Disorder Questionnaire.
At step 2, t tests revealed that there was a significant difference in wait to triage (t 492 = −7.15, p<0.0001) with clients waiting on average 11 days longer to be triaged at time 2. There was no significant difference between the time periods in terms of waiting time from triage to treatment (t 492 = 0.75, p = 0.46), starting scores (PHQ-9: t 494 = 1.7, p = 0.08; GAD-7: t 494 = 1.26, p = 0.21) or total number of treatment sessions (t 494 = 0.91, p = 0.36).
At step 3, t test analyses revealed that there was significant difference between times 1 and 2 in terms of wait to triage, with clients waiting on average 6 days longer to be triaged at time 2 (t 490 = −2.30, p = 0.002). There was an average increase in wait from triage to treatment of 9 days at time 2 but this did not reach significance when the Bonferroni correction was applied (t 490 = −2.37, p = 0.02). On average, clients were presenting with GAD-7 scores 1 point higher at time 2 compared to time 1 but this difference was only approaching significance (t 490 = −2.54, p = 0.01). There was no difference in PHQ-9 scores between the time periods (t 490 = 0.38, p = 0.70). Finally, clients were having fewer treatment sessions at time 2 but this difference was not significant when the Bonferroni correction was applied (9 vs. 11 sessions, t 490 = 2.18, p = 0.03).
Variables related to recovery
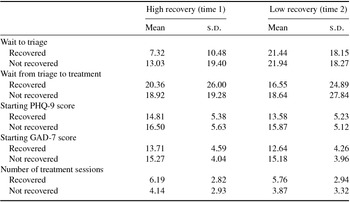
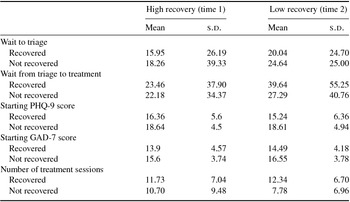
Next, the extent to which starting scores, clinical contact and waiting times may be differentially related to recovery at the two time points was explored. Results are presented by each step separately. Means and standard deviations are presented in Tables 4 and 5.
Step 2: means and standard deviations for each variable by recovery status

PHQ-9, Patient Health Questionnaire; GAD-7, Generalized Anxiety Disorder Questionnaire.
Step 3: means and standard deviations for each variable by recovery status

PHQ-9, Patient Health Questionnaire; GAD-7, Generalized Anxiety Disorder Questionnaire.
Step 2
At both times 1 and 2, significant differences between the recovered and non-recovered groups were only observed for the number of treatment sessions. There was a significant difference between the recovered and non-recovered group in terms of the number of treatment sessions completed, with recovered clients receiving on average two sessions more than those in the unrecovered group (time 1: t 198 = −5.03, p<0.001; time 2: t 294 = −0.511, p<0.001).
In terms of starting scores, there were only differences between the recovered and non-recovered groups at time 2 (PHQ-9: t 294 = 3.79, p<0.001; GAD-7: t 294 = 5.3, p<0.001). At time 1, those in the recovered group had lower PHQ-9 (t 198 = 2.17, p = 0.03) and GAD-7 (t 198 = 2.56, p = 0.01) scores at the start of treatment compared to the non-recovered group but this was not significant when the Bonferroni correction was applied.
Only wait to triage at time 1 (t 165.28 = 2.63, p = 0.009) approached significance. Wait to triage was not significant at time 2 (t 292 = 0.24, p = 0.81) nor was wait from triage to treatment at either time period (2011: t 197 = −0.446, p = 0.66; 2012: t 292 = 0.673, p = 0.50).
Step 3
At time 1, only starting scores were related to recovery, with those who recovered starting with lower PHQ-9 scores (t 215.21 = 3.52, p = 0.001) and GAD-7 scores (t 216.48 = 3.2, p = 0.002). There were no significant differences between those who recovered and those who did not recover in terms of the other variables: waiting times (wait to triage: t 243 = 0.53, p = 0.60; wait from triage to treatment: t 243 = −0.28, p = 0.78) or number of treatment sessions (t 238.4 = −0.97, p = 0.34).
By contrast, there were differences between the recovered and non-recovered groups at time 2 across almost all variables. The recovered group received more treatment sessions (t 235 = −4.97, p<0.001) and waited longer from triage to treatment (t 146 = −1.83, p = 0.05) but this only approached significance when the Bonferroni correction was applied. Those in the recovered group also started with significantly lower starting scores on both the PHQ-9 and GAD-7 at time 2 (PHQ-9: t 154.17 = 4.28, p<0.001; GAD-7: t 235 = 3.91, p<0.001). It was only wait to triage which was not significantly related to recovery at time 2 (t 234 = 1.38, p = 0.17).
Summary
Overall, results reveal that there were differences with regard to only some of the investigated variables between the periods of high and low recovery. As expected given the substantial increase in referrals, waiting times for triage had significantly increased for service users at both levels of intervention. There was no difference in the severity of clients presenting to the service at time 2. There was a decrease, but not significant one, in the number of treatment sessions clients received at step 3 between times 1 and 2.
In support of our hypothesis, lower starting scores were consistently associated with recovery. There was partial support for the hypothesis that there would be an association between number of treatment sessions and recovery. At step 2, there was a consistent association between the number of treatment sessions and recovery, but at step 3 the number of sessions was only associated with recovery at time 2. The hypothesis that waiting times would be related to recovery was not supported by the data.
Discussion
The present investigation was interested in exploring the impact of waiting times, client starting scores and number of clinical contacts in relation to recovery at two different time periods as part of a clinical audit within an IAPT service. Results reveal that (1) clients’ starting scores were consistently associated with recovery, but this relationship was not different between times 1 and 2 nor was there a significant change in the severity of clients between the two periods; (2) increased waiting times at time 2 were not associated with recovery status and (3) the amount of clinical contact was associated with recovery at both levels of intervention.
Waiting times
The results from this evaluation suggest no role of waiting time in relation to the decline in recovery. Although waiting times undoubtedly increased during the period of low recovery, particularly in terms of how long clients waited for triage, waiting times were not significantly associated with recovery at either time period. This finding was surprising but is in line with other research in primary care (Lucock et al. Reference Lucock, Kirby and Wainwright2011). A limitation of the present investigation is that only those cases who attended triage, and who attended one further clinical contact, were included in the analyses. It is conceivable that this may underestimate the impact of waiting times, if longer waiting times result in some clients being less likely to attend triage as has been reported elsewhere (e.g. Mander, Reference Mander2014) or more likely to ‘drop out’ between triage and the beginning of treatment.
Baseline severity
Results from these analyses suggest that the observed decline in recovery is not due to an increase in the severity of clients’ starting scores at time 2. Although those with higher starting scores were shown to be less likely to recover, this was consistent at both time periods and for both steps. Overall, this replicates recovery data published from the first year of IAPT services (Gyani et al. Reference Gyani, Shafran, Layard and Clark2011) and is a reflection that those clients with higher scores are required to make greater change in order to move below ‘caseness’. This highlights a limitation of the definition of recovery used by IAPT services which does not account for those who make significant change but do not move below caseness by the end of treatment. Alternative definitions to recovery (i.e. ‘reliable change’ index; NHS England, 2014) which are currently being introduced nationally may be more sensitive in differentiating those who do and do not benefit from treatment within IAPT services.
Although the present investigation explored if the severity of depression and anxiety in clients had changed over time or was associated with recovery, it does not provide information about the extent to which client ‘complexity’ may have changed over time. Certainly within the service where the present investigation was conducted, the clinical team was of the opinion that over time there has been an increase in the complexity of clients presenting to the service: in particular, that clients are now presenting with greater comorbidity (Axis I and II) and greater social adversity. A more detailed analysis would need to be completed to account for these types of client differences. There are plans for the Mental Health Clustering Tool (Department of Health, 2012) to be used more routinely by IAPT services which would allow for different combinations of need and severity to be measured. It is possible that routine collection of ‘level of need’ in this way will allow for some of these kinds of questions to be answered more readily.
Length of treatment
The number of treatment sessions did appear to be an important factor in relation to recovery at both time periods and for both levels of intervention. Contrary to expectations, there was no significant difference in clinical contacts being offered at step 2 between the time periods examined. This is in spite of the service being more stringent about the number of sessions offered by PWPs at time 2. However, the heterogeneity of treatment modalities within step 2 should also be acknowledged when considering this finding. There are some low-intensity interventions, such as computerized CBT, that allow for up to 12 sessions and this differs from workshops and guided self-help which involve substantially less clinical contact but are still considered within the same level of intervention. Thus, it is possible that the effect of reducing the number of guided self-help sessions was masked by other types of intervention which allow for greater clinical contact at lower therapist cost. Unfortunately, the IAPT database does not readily allow for analyses to be completed based on individual types of treatment within each step making this question beyond the scope of the present investigation.
Visual inspection of the data also highlighted that during the period of lower recovery (time 2), a greater proportion of clients were discharged following only one treatment session. It is hypothesized that many of these cases may represent those clients who were invited for a ‘further assessment’ session, sessions which were introduced within the service to better determine IAPT suitability if suitability was not clear from the telephone triage. This poses a question as to whether or not these cases should be included in the recovery rate. It may not be appropriate to consider such cases ‘unrecovered’ if they are directed elsewhere for more appropriate treatment and thus are not actually treated within IAPT. Arguably, there is a distinction between those who have only two clinical contacts because they were not well suited to the service, in contrast to those who did not engage with treatment (i.e. dropped out), and the former may not be a fair reflection of IAPT performance.
A consistent finding from these analyses is that a greater number of clinical contacts was associated with recovery at both steps. On average, those who had recovered had six and 11–12 clinical contacts at steps 2 and 3, respectively. The association with recovery was significant at both time periods for step 2, but only significant at time 2 for step 3 when the difference in number of clinical contacts between those who did and did not recover widened. One plausible explanation for this finding at step 3, is that the service is getting better at identifying those who are not appropriate for CBT and therapists are not ‘endlessly’ treating patients if they are not progressing or engaging with treatment. Indeed, the service had been encouraging clinicians to do this more actively at time 2 due to the stark increase in referrals. Another possibility is that therapists may feel implicit or explicit pressure to discharge clients as soon as possible due to the increase in waiting times within the service. Regardless of the reason for fewer sessions, these results suggest that high-intensity interventions offered in this IAPT service are on average, lower than that which is recommended by NICE guidelines. A finding that replicates data published in the National Audit of Psychological Therapies, which has reported that only 30% of clients receive the minimum number of sessions recommended by NICE guidelines (Royal College of Psychiatrists, 2011). Given that NICE recommends an episode of treatment being at least ten sessions for most disorders (e.g. 16–20 for moderate depression, 12–15 for GAD, up to 14 for social phobia, at least 10 for obsessive compulsive disorder, 8–12 for post-traumatic stress disorder), it is possible that inadequate clinical contact may explain the relationship between number of clinical contacts and recovery in this audit.
Service changes following the audit
Following dissemination of the findings from this audit, a number of recommendations were made in an effort to improve rates of recovery within the service. First, clinicians were provided with an opportunity to reflect on their own client outcomes to identify areas for continued professional development. This involved clinicians providing outcome data on all of their discharged clients over a 6-month period and outcomes were compared across therapists. Clinicians were encouraged to develop action plans in supervision to address individual recovery issues. As part of this process, the use of the Cognitive Therapy Scale – Revised (CTS-R; Blackburn et al. Reference Blackburn, James, Milne, Baker, Standart, Garland and Reichelt2001) within supervision and as part of appraisals for high-intensity therapists was increased. Clinicians with notably high recovery rates were also invited to share suggestions which have been compiled as a service resource. Overall, the individual outcome review highlighted particularly poor outcomes for clients with a diagnosis of post-traumatic stress disorder; thus, this became a particular focus for training, supervision and audit. Finally, following consultation with step-3 clinicians, a rolling programme of refresher training in disorder-specific CBT protocols was implemented across four IAPT services in the Trust.
Limitations
The present audit does have some limitations. First, this investigation presents data from a clinical audit and is a reflection of ‘real life’ clinical data. As a result, the analyses are restricted to that which can be conducted within a routine clinical service. For example, we were unable to include diagnostic group in these analyses due to the unreliable inclusion of this information in the available dataset. The available dataset was also limited in that data for step 3 included those cases who failed to recover following a low-intensity intervention and were ‘stepped up’ to high intensity, as well as those who only received a high-intensity intervention. Ideally, these groups would be examined separately. This dataset also fails to represent those cases that dropped out of treatment following triage (i.e. did not have two clinical contacts). Moreover, within the sample studied that did have at least two clinical contacts, it is not clear if there were significant differences in the ‘reason for discharge’ over time or if this was related to recovery. Nevertheless, the data presented herein do represent performance data of the kind that is presented to commissioners and thus we would argue is ‘ecologically valid’ in this respect. Second, a limitation of a correlational design that examines many factors is that there is a heightened risk of Type I errors. More controlled investigations are required to replicate these findings and to identify what may be mediating or moderating relationships between client and service factors and recovery.
Finally, there are a number of other factors that may influence recovery which were not included in this audit. In particular, it is not clear to what extent this reduction in recovery may also be due to client characteristics (e.g. personality factors, comorbidity, psychosocial stress). The growth of IAPT in terms of awareness and accessibility means that services may now be faced with accommodating a wider range of clients than was once the case; although this warrants formal investigation. It may be that guidelines around managing client complexity need to be more clearly explicated (in terms of referral, assessment and treatment) and provision of additional training and resources be considered in order to adequately meet the needs of referrals that are now being received by IAPT services. The quality of CBT delivery within routine clinical settings can also vary and this may be another factor related to treatment outcomes (see Shafran et al. Reference Shafran, Clark, Fairburn, Arntz, Barlow, Ehlers, Freeston, Garety, Hollon, Ost, Salkovskis, Williams and Wilson2009 for a discussion). Thus, exploring additional client and therapist factors in relation to IAPT recovery are likely to be fruitful avenues for future research.
The present audit highlights a number of considerations as the demand for IAPT continues to increase and the nature of referrals to IAPT services continues to evolve. In particular, this evaluation suggests that those receiving high-intensity interventions require a reasonable amount of clinical contact to reach recovery and that service pressures may challenge clinicians to offer treatments of a clinically recommended length. As the IAPT model becomes more and more prevalent across diagnoses and levels of care, identifying factors related to recovery are going to be critical in maintaining the integrity of mental health services and achieving adequate levels of recovery.
Recommendations for future research
Improve sensitivity in predicting those who do and do not make change in treatment by:
-
(1) Examining how service and client factors are related to recovery, both when traditional and alternative recovery criteria is used (i.e. ‘reliable change’).
-
(2) Exploring moderators of recovery including diagnostic groups, comorbidity, client complexity and mode of therapy. This will require consistent reporting of these factors within the IAPT database.
-
(3) Identifying patterns of drop-out (e.g. how they may differ by treatment type and diagnosis).
-
(4) Consider therapist factors in relation to recovery including therapist drift and/or how therapist experience may relate to clinical outcomes with certain patient groups.
Ethical standards
Approval was obtained from the Trust's Research and Development body to carry out this service evaluation. No formal ethical review was required given the nature of this audit.
Acknowledgements
This research received no specific grant from any funding agency, commercial or not-for-profit sectors.
Declaration of Interest
None.
-
(1) Within IAPT services, service-defined recovery appears to be associated with the severity of the presenting problem and the number of clinical contacts received as part of treatment.
-
(2) Within IAPT services, waiting times do not appear to be related to service-defined recovery status, but further research is required to determine the impact of waiting times on client's initial engagement with IAPT services.
-
(3) Early discharge for some clients, whether planned or due to drop-out, may mean that clinical contact within IAPT services is not in line with guidelines recommended by NICE and this may negatively impact client recovery.



Comments
No Comments have been published for this article.