INTRODUCTION
Carbohydrate, which makes up 700 − 800 g/kg of the dairy cow's diet and contributes towards the cow's energy requirements is one of the dietary components of importance in dairy cow rations (Nocek & Russell Reference Nocek and Russell1988; Koenig et al. Reference Koenig, Beauchemin and Rode2003). Carbohydrate can be divided into two main fractions: fibre carbohydrate and non-fibre carbohydrate (NFC). Fibre carbohydrate consists of cellulose, hemicellulose, lignin and a portion of pectin, and it is determined as neutral detergent fibre (NDF) content in plant materials, whereas NFC consists of sugars, starches, pectins and short chains of cellulose-like substrates (e.g., β-glucans) (Van Soest et al. Reference Van Soest, Robertson and Lewis1991). Meanwhile, dietary crude protein (CP), which can be degraded into a source of ammonia nitrogen (N) for rumen microbial crude protein (MCP) synthesis and amino acids for milk protein yield, is another important nutrient in dairy cow diets.
Johnson (Reference Johnson1976) proposed that the synchronized release between N from CP and energy from carbohydrates in the rumen could maximize MCP synthesis. The synchronization was confirmed in dairy cows fed rations with a matched NFC : CP ratio (Aldrich et al. Reference Aldrich, Muller, Varga and Griel1993). Herrera-Saldana et al. (Reference Herrera-Saldana, Gomez-Alarcon, Torabi and Huber1990) also reported that rations synchronized for the rapid release of N and energy were associated with a greater efficiency of MCP synthesis than were asynchronous rations. However, recent research has suggested that the ratio between rumen-degradable CP and rumen-fermentable carbohydrates is a much more important determinant of MCP synthesis than a synchrony in the rates of N and energy release (Dewhurst et al. Reference Dewhurst, Davies and Merry2000; Huhtanen & Shingfield Reference Huhtanen, Shingfield, Park and Stronge2005). Meta-analyses of studies on the impact of carbohydrate content in dairy cow diets showed that greater dietary NFC content increased the utilization of ruminal ammonia N for MCP synthesis (Nocek & Russell Reference Nocek and Russell1988; Hoover & Stokes Reference Hoover and Stokes1991). In comparison with NFC, NDF is poorly digested but is essential for milk and milk protein yield by stabilizing ruminal fermentation to stimulate microbial growth. So far, limited information about the effect of dietary NDF : CP ratio on MCP synthesis is known in the rumen when the ingredient and inclusion level of a concentrate are fixed for high-concentrate total mixed rations (TMRs) with a constant forage-to-concentrate ratio. The objective of the present study was to evaluate effects of dietary NDF : CP ratio on duodenal microbial N flow and N losses in lactating cows fed high-concentrate TMRs with different forage combinations.
MATERIALS AND METHODS
Animals and management
Five lactating Holstein cows (543 ± 25 kg body weight (BW, mean ± s.d.), 60 ± 13 days in milk and average daily milk yield of 20 ± 2 kg/day in second lactation) were fitted with rumen cannulas (Type 2C: Bar Diamond Inc., Parma, Idaho, USA) and served as experimental animals. The cows were housed in individual 10 m2 concrete-floor pens, each of which had a separate feed bunk and watering point. The surgical preparation of cows was done 3 months before the start of the study at the Experiment Farm of the College of Animal Science and Technology, China Agricultural University (Beijing, China). The animals had free access to water and were fed TMRs as described in the latter experimental design twice daily at 07·00 and 19·00 h. All experimental handlings were conducted under the approval of the Animal Care and Use Committee of China Agricultural University, Beijing, China.
Experimental design
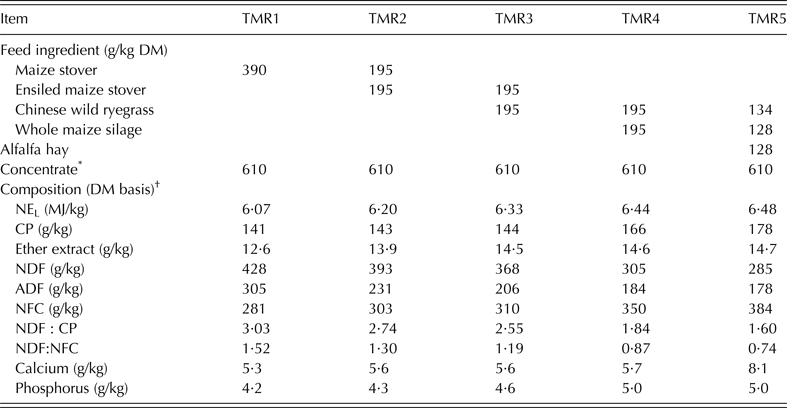
A 5 × 5 Latin square design for the cows was applied to investigate the effect of dietary NDF : CP ratio on duodenal MCP flow and N utilization. Five high-concentrate TMRs with different forage combinations of maize stover, ensiled maize stover, Chinese wild ryegrass, whole maize silage and alfalfa hay were formulated to contain the following dietary NDF : CP ratio: TMR1 3·03 : 1 (428·2 g NDF/kg : 141·4 g CP/kg); TMR2 2·74 : 1 (392·7 g NDF/kg : 143·2 g CP/kg); TMR3 2·55 : 1 (368·3 g NDF/kg : 144·4 g CP/kg); TMR4 1·84 1 (304·8 g NDF/kg : 165·8 g CP/kg); TMR5 1·60 : 1 (285·0 g NDF/kg : 178·0 g CP/kg). The TMRs with a constant forage-to-concentrate ratio (39 : 61, dry matter (DM) basis) were formulated to meet or exceed the nutrient requirements of a Holstein cow yielding 20 kg of milk/day with 3·5% milk fat according to Chinese Feeding Standard of Dairy Cow (China standard NY/T 34 2004). Ingredient composition of the five TMRs is listed in Table 1. The whole experiment was completed in five periods: each period consisted of 18 days including 15 days of adaptation and 3 days of rumen content sampling, and rumen fluids were intensively collected on day 16, day 17 and day 18 in each period. In each period, diets contained 5–10% orts in the first week, and then feeding was restricted in the subsequent days. The ingredient mix was adjusted based on weekly forage DM analysis, and each individual cow's feed intake and milk yield were recorded daily during the last 3 days of each experimental period.
Feed ingredient composition of high-concentrate TMRs with different forage combinations

* The concentrate (per kg DM) contained 538·8 g maize meal, 142·3 g soyabean meal, 71·1 g cottonseed meal, 40·7 g rapeseed meal, 50·8 g wheat bran, 122·0 g distillers dried grains, 10·2 g salt, 10·2 g calcium hydrogen phosphate, 10·2 g limestone and 3·2 g premix per kg. The premix used in the concentrate contained 2100·0 mg I, 2000·0 mg Cu, 2500·0 mg Mn, 8000·0 mg Zn, 60·0 mg Se, 20·0 mg Co, 950·0 kIU Vitamin (V) A, 400·0 kIU VD and 7·5 kIU VE per kg.
† NEL, net energy for lactation estimated based on NRC (2001); CP, crude protein; NDF, neutral detergent fibre; ADF, acid detergent fibre; NFC, non-fibre carbohydrate estimated as: NFC = 100 − (NDF + CP + ether extract + ash).
Sampling procedure
Samples of the rations and orts were collected daily on days 16, 17 and 18 of each period, stored at −20 °C, and bulked per cow for each experimental period. Composite samples of orts were based on daily amounts of the orts for each cow. After the experiment, pooled samples of the TMRs and orts were dried at 65 °C for 48 h, ground through a 1-mm screen using a Wiley mill for later chemical analyses of DM, CP and ether extract, NDF, acid detergent fibre (ADF) and ash content.
Milk yield of each individual cow was recorded at each of the twice daily milkings (05·00 and 17·00 h) on the last 3 days of five 18-day periods. Milk samples from morning and evening milking were collected into vials that contained a preservative (dichromate potassium, K2Cr2O7) on days 16, 17 and 18 of each period. Milk samples were then pooled daily based on milk yield and frozen at −20 °C for later analysis of milk fat, protein, lactose, solids and calculation of solids-not-fat (SNF).
Blood samples (10 ml) were collected from the coccygeal vein of each cow into heparinized test tubes at 07·00, 11·00 and 15·00 h (day 16); 09·00, 13·00 and 17·00 h (day 17); and 08·00 h (day 18) of each period. The samples were then centrifuged at 3000 g for 15 min at 4 °C to obtain the plasma. All of the plasma samples were stored at −80 °C for later analyses of blood urea N, according to the method described by Wang et al. (Reference Wang, Liu, Yuan, Wu, Zhai and Ye2007).
During each experimental period, after 15 days of adaptation to the new TMR, a sampling period of 3 days was arranged. Rumen contents of the cows were collected at 01·00, 07·00, 13·00 and 19·00 h (day 16); 03·00, 09·00, 15·00 and 21·00 h (day 17); and 05·00, 11·00, 17·00 and 23·00 h (day 18). Samples were collected from different compartments of the rumen via rumen cannulae using a vacuum pump, pooled in an equal portion, mixed thoroughly by hand and filtered through four layers of muslin. They were then centrifuged at 1000 g for 30 min at 4 °C. The supernatant of the rumen liquid fraction without digesta particles was immediately stored at −20 °C for later analysis of ruminal ammonia N.
Total faeces were collected over the 24-h period from the rubber bedding during days 16, 17 and 18 of each sampling period. One kilogram of faecal samples were mixed with 250 ml tartaric acid (10%), thereafter the mixed sample were dried at 65 °C for 48 h, ground through a 1-mm screen using a Wiley mill for later N analysis. Following the method of Cao et al. (Reference Cao, Ma, Yan, Li and Zhang2009), an apparatus that can allow continuous and precise collection of total urine was prepared for the cows. The apparatus is composed of an anterior urethra, a urine cup and a collection barrel. The apparatus was positioned in the cows 24 h before initiation of the urine collection, and daily urine was collected continuously without leakage and measured during the last 3 days of each period. Urine samples were acidified during collection to a pH <3·0 by addition of 2·0 M sulphuric acid (H2SO4). Aliquots were filtered through four layers of muslin, diluted 1 : 9 with distilled water, stored frozen at −20 °C, and later analysed for N, allantoin and uric acid contents.
Chemical analysis
Samples of the forage, concentrate and orts were analysed following AOAC (1999) for DM (ID 930·5), CP (ID 984·13), calcium (ID 927·02), phosphorus (ID 984·27) and ash (ID 942·05). Both NDF and ADF were analysed (Van Soest et al. Reference Van Soest, Robertson and Lewis1991) with heat-stable α-amylase (Sigma no. A3306; Sigma Chemical Co., St. Louis, MO, USA) with sodium sulphite and corrected for residual ash content. Milk fat, true protein and lactose were analysed by infrared analysis (Dairy Cow Milk Analysis Centre, Beijing, China) with a Foss FT6000 (Foss North America Inc., Eden Prairie, MN, USA).
The rumen fluid samples (1 ml) were mixed with 0·3 ml of 250 g/l meta-phosphoric acid solution for 30 min and centrifuged at 15 000 g at 4 °C for 10 min. Following the method described by Verdouw et al. (Reference Verdouw, Van Echteld and Dekkers1978), ammonia N concentration in the supernatants was analysed at 540 nm with a microplate reader RT-6500 (Rayto Instruments, Shenzhen, China).
The allantoin and uric acid in the urine samples were determined to estimate ruminal MCP flow into the duodenum according to the method described by Chen et al. (Reference Chen, Chen, Franklin, Ørskov and Shand1992). Prior to analysis, the frozen urine samples were thawed at room temperature. The thawed urine was diluted 1 : 4 with distilled water, and then 0·5 ml of the diluted sample, 2·5 ml distilled water and 0·5 ml 0·5 M sodium hydroxide (NaOH) were added to 10-ml tubes, which were shaken at 80 rpm for 2 min and incubated at 100 °C for 7 min. After cooling with iced water, 0·5 ml 0·5 M hydrogen chloride (HCl) and 0·5 ml 0·023 M phenylhydrazine hydrochloride were added into the tube, shaken again and incubated at 100 °C for 7 min. The incubation was stopped by cooling with iced water, and then 1·5 ml of 11·4 M HCl and 0·5 ml of 0·05 M potassium ferricyanide were added to the tubes and shaken for 20 min. The absorbance of the mixed solution was read at 522 nm by a microplate reader RT-6500 (Rayto Instruments, Shenzhen, China). Meanwhile, a blank was run to correct the concentration of the allantoin.
An aliquot of 1 ml diluted (1 : 4) urine, 2·5 ml phosphate buffer (pH 6·50) and 150 μl 0·1 M xanthine oxidase (Sigma Chemical Co., St. Louis, MO, USA) were added to 10-ml tubes, shaken at 80 rpm for 2 min and incubated at 100 °C for 90 min. The colour of the mixed solution was read at 293 nm by the microplate reader RT-6500 (Rayto Instruments, Shenzhen, China). Meanwhile, a blank was run to correct the concentration of the uric acid.
Calculations
Dry matter intake (DMI) was computed in each period, based on daily individual cow records of TMR offered and refused and the 65 °C DM contents of the TMR and orts. NFC content in the TMRs was calculated (NRC 2001) as follows:
 $${\rm NFC}\, = {\rm 1}00 - ({\rm NDF} + {\rm EE} + {\rm CP} + {\rm ash}).$$
The average daily milk yield throughout the whole experimental period and concentration of milk components in the last 3 days of each period were computed using morning and evening milk production as weighing factors. The yield of energy-corrected milk (ECM, kg/day) was calculated with the milk energy output according to Cabrita et al. (Reference Cabrita, Bessa, Alves, Dewhurst and Fonseca2007):
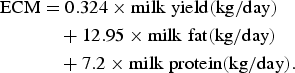 $$\eqalign{{\rm ECM} &= 0.{\rm 324} \times {\rm milk \;yield} (\rm kg/\rm day)\cr&\quad + {\rm 12}.{\rm 95} \times {\rm milk \;fat (kg/day})\cr&\quad + {\rm 7}.{\rm 2} \times {\rm milk \;protein (kg/day)}{\rm.}}$$
The yield of solids-corrected milk (SCM, kg/day) was estimated using the method of Tyrell & Reid (Reference Tyrell and Reid1965):
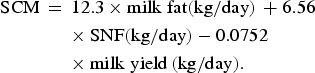 $$\eqalign{{\rm SCM}\, &= \,{\rm 12}.{\rm 3} \times {\rm milk \;fat (kg/day)}\, + {\rm 6}.{\rm 56}\cr&\quad \;\times {\rm SNF (kg/day)} - 0.0{\rm 752}\cr&\quad \;\times {\rm milk \;yield}\,{\rm (kg/day)}{\rm.}}$$
The yield of 3·5% fat-corrected milk (FCM, kg/day) was determined according to Maynard et al. (Reference Maynard, Loosli, Hintz and Warner1979):
 $${\rm FCM}\, = 0.{\rm 35} \times {\rm milk \;yield (kg/day)}\, + {\rm 15}.0 \times {\rm fat \;yield (kg/day)}{\rm.} \hskip8.3pc$$
Milk efficiencies were calculated as FCM divided by DMI, whereas milk energy (Mcal/day) was estimated according to Khorasani et al. (Reference Khorasani, Okine, Corbett and Kennelly2001):
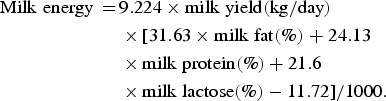 $$\eqalign{{\rm Milk \;energy}\, = \, & 9.224 \times {\rm milk \;yield (kg/day})\cr & \times [31.63 \times {\rm milk \;fat (\% )} {\rm \;+\; 24}{\rm. 13}\cr & \times {\rm milk \;protein (\% ) + 21}{\rm. 6} \cr & \times {\rm milk \;lactose (\% ) - 11}{\rm. 72]/1000}{\rm.}}$$
Urinary purine derivative (PD) excretion was used to firstly estimate daily absorption of microbial purine bases duodenal microbial N flow:
 $$\eqalign{&{\rm Absorption \;of \;microbial \;purine \;bases (mmol/day)}\,\cr &\quad{\rm =} \,\displaystyle{{{\rm PD} - 0.{\rm 385} \times {\rm B}{{\rm W}^{0.{\rm 75}}}} \over {0.85}}\comma}$$
where PD is the urinary PD excretion (allantoin and uric acid; mmol/day), 0·385 mmol/kg BW0·75 is a correction for endogenous PD, and 0·85 is a recovery coefficient (Verbic et al. Reference Verbic, Chen, MacLeod and Ørskov1990). Duodenal microbial N flow was then estimated as follows:
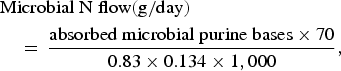 $$\eqalign{&{\rm Microbial \;N \;flow (g/day)}\,\cr&\quad = \,\displaystyle{{{\rm absorbed \;microbial \;purine \;bases} \times 70} \over {0.83 \times 0.134 \times 1,000}},}$$
where 70 is the N content of purines (mg N/mmol; Chen et al. Reference Chen, Chen, Franklin, Ørskov and Shand1992) and 0·134 is the ratio of purine N to total N in rumen micro-organisms assumed based on the data of Valadares et al. (Reference Valadares, Broderick, Valadares Filho and Clayton1999) and a digestibility coefficient of 0·83 for microbial purines (Chen et al. Reference Chen, Chen, Franklin, Ørskov and Shand1992).
Statistical analysis
Data in the experiment were analysed using PROC GLIMMIX of SAS (2004) according to the following model:
 $${Y_{ijk}}\, = \,m\, + \,{T_i}\, + \,{P_j} + \,{(P{\rm ^{\prime}}T)_{ij}}\, + \,{C_k}\, + \,{e_{ijk}},$$
where Y ijk is the response variable, 〈t〉 μ 〈/t〉 is the overall mean, T i is the fixed effect of treatment (i = TMR1–5), P j is the fixed effect of period (j = 1–5), (P × T)ij is the interaction between period and treatment, C k is the random effect of cow (k = 1–5) (within period) and ε ijk is the residual error. Sampling time as repeated measurements in each period was added to the model for the analysis of ammonia N and blood urea N. First-order autoregressive and compound symmetry (homogeneous and heterogeneous) were tested as covariance structures, and the covariance structure with the least Akaike's Information Criterion (AIC) was retained in the final model. Least-squares mean and standard error (s.e.m.) were calculated with the least-squares mean statement of the general linear model procedure. Orthogonal polynomial contrasts were performed to determine linear and quadratic effects of dietary ratio of NDF to CP. Significance was declared at P < 0·05 unless differences were considered to indicate a trend towards significance at 0·05 < P < 0·10.
RESULTS
Effect of dietary neutral detergent fibre : crude protein ratio on milk performance
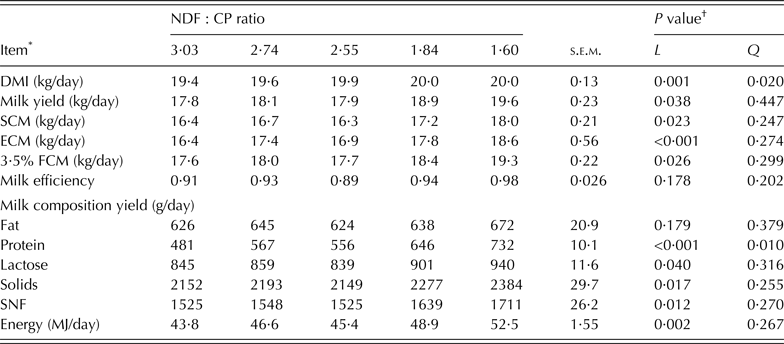
As shown in Table 2, DMI (P = 0·001), milk yield (P = 0·038), SCM (P = 0·023), ECM (P < 0·001) and 3·5% FCM (P = 0·026) increased linearly with a decrease in dietary NDF : CP ratio (Table 1). Milk protein (P < 0·001), lactose (P = 0·040), solids (P = 0·017), SNF (P = 0·012) yields and milk energy (P = 0·002) also increased linearly with the decreasing ratio. However, no difference occurred for milk fat yield among the treatments.
Effect of dietary NDF : CP ratio on milk performance of lactating dairy cows fed high-concentrate TMRs (concentrate : forage = 61 : 39) with different forage combinations
* DMI, dry matter intake; SCM, solids-corrected milk; ECM, energy-corrected milk; 3·5% FCM, milk yield corrected by 3·5% milk fat content; milk efficiency = 3·5% FCM/ DMI: SNF, solids-not-fat.
† L and Q represent linear and quadratic effects of dietary NDF : CP ratio, respectively.
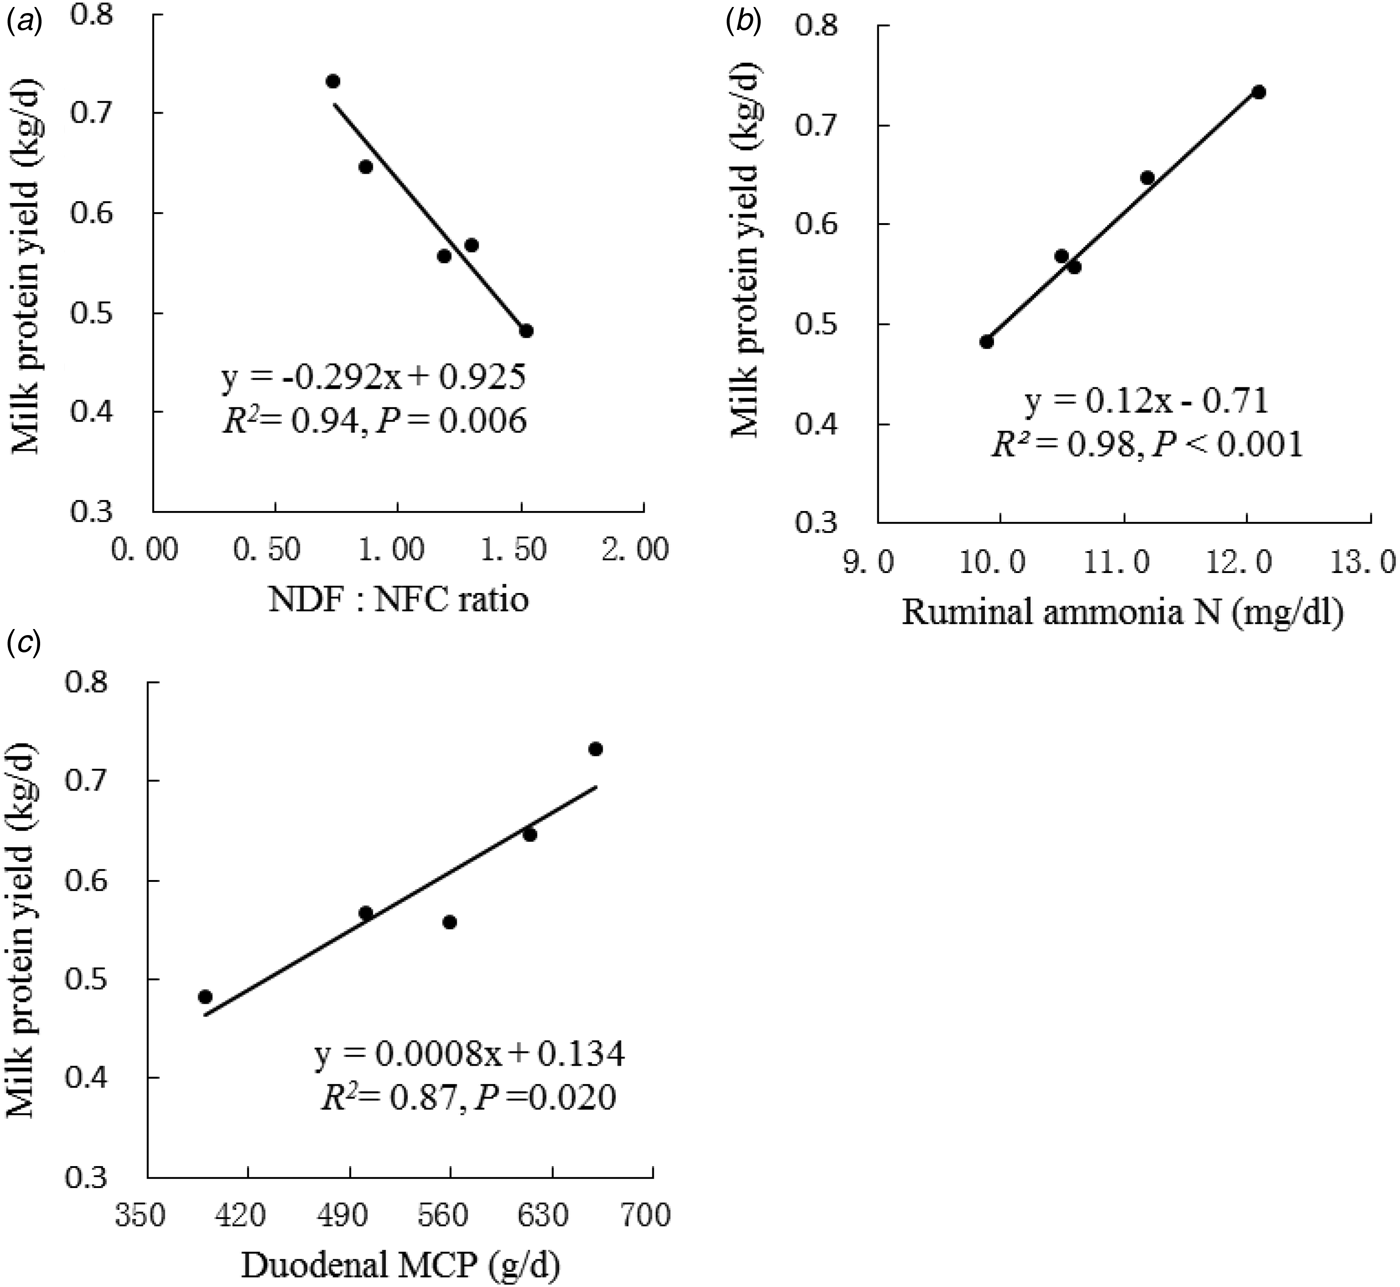
As shown in Fig. 1, milk protein yield was negatively correlated with dietary NDF : NFC ratio (R 2 = 0·94, P = 0·006), but positively correlated with the mean ruminal ammonia N (R 2 = 0·98, P < 0·001) and duodenal MCP (R 2 = 0·87, P = 0·02), respectively.
Regressions of milk protein yield on (a) dietary NDF : NFC ratio, (b) ruminal ammonia N concentration and (c) duodenal MCP.
Effect of dietary NDF : CP ratio on ruminal ammonia N and blood urea N concentrations and excretion of PDs.
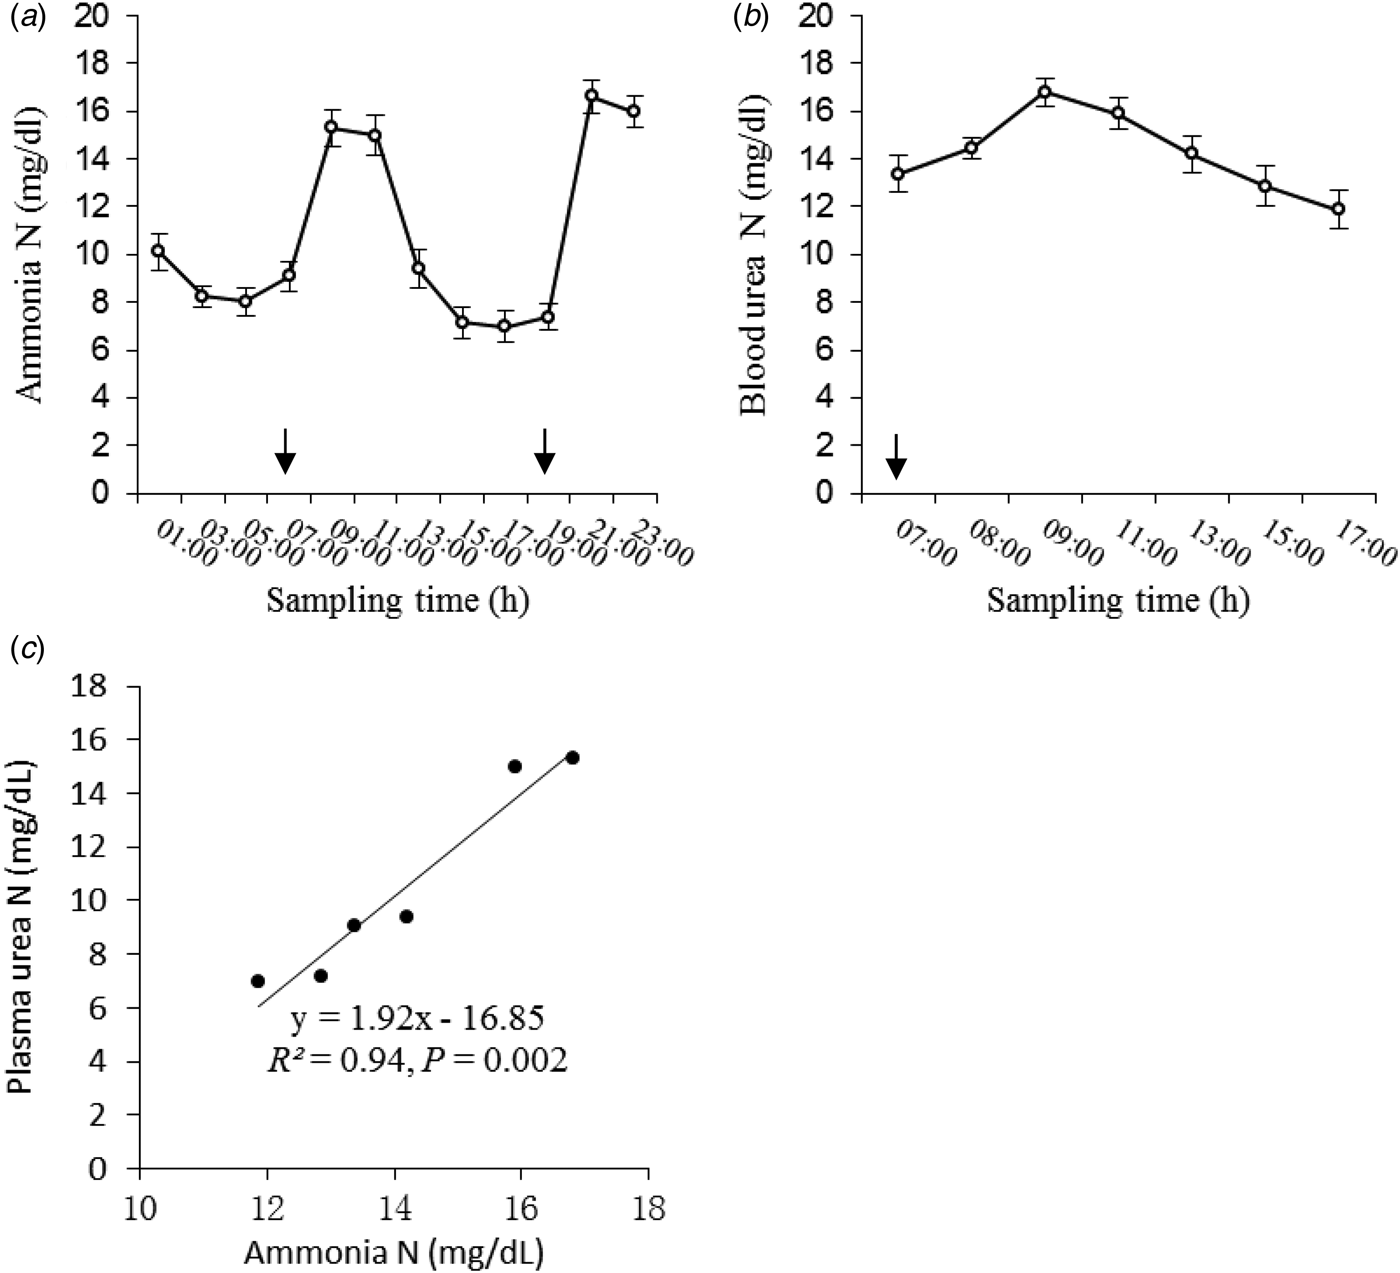
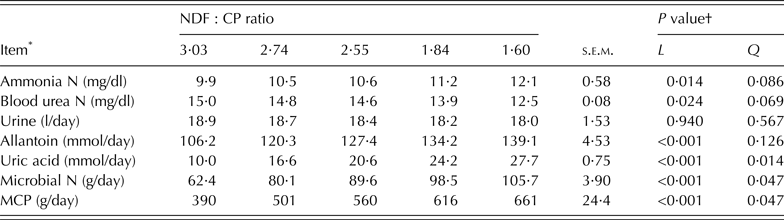
As shown in Table 3, the mean concentration of ruminal ammonia N across different sampling time was increased linearly with the decreasing dietary NDF : CP ratio (P = 0·014). Diurnal ammonia N varied from 6·9 to 16·6 mg/decilitre over a 24-h period, and the ammonia N concentration peaked 2 h after the morning (09·00 h) and afternoon feedings (21·00 h), then declined during the next 6 h (Fig. 2(a)).
Diurnal variations of (a) ammonia N in the rumen, (b) blood urea N in lactating cows and (c) the linear regression of the blood urea N on ruminal ammonia N concentration. Arrows indicate when TMRs were offered; each of circle and bar at a same sampling time represent least-squares means and s.e.m., respectively, across five high-concentrate TMRs with different forage combinations; each dot represents a least-squares mean value at a same sampling time across the different rations.
Effect of dietary NDF : CP ratio on daily urinary excretion of purine derivatives and duodenal microbial N in lactating dairy cows fed high-concentrate TMRs (concentrate : forage = 61 : 39) with different forage combinations
* Microbial N, estimated duodenal microbial N outflow from the rumen based on urinary purine derivatives excretion; MCP, microbial crude protein.
† L and Q represent linear and quadratic effect of dietary NDF : CP ratio, respectively.
The mean concentration of blood urea N decreased linearly (P = 0·024), and the highest blood urea N occurred at the NDF : CP ratio of 3·03 : 1, and the lowest occurred at the ratio of 1·60 : 1. The blood urea N concentration varied from 11·8 to 16·8 mg/dl depending on the sampling time (Fig. 2(b)); it started to increase 1 h after the morning feeding (07·00 h) and peaked 2 h (09·00 h) later, then declined during the next 8 h. In the present study, the blood urea N concentration was positively correlated with ammonia N concentration (Fig. 2(c), R 2 = 0·94, P = 0·002).
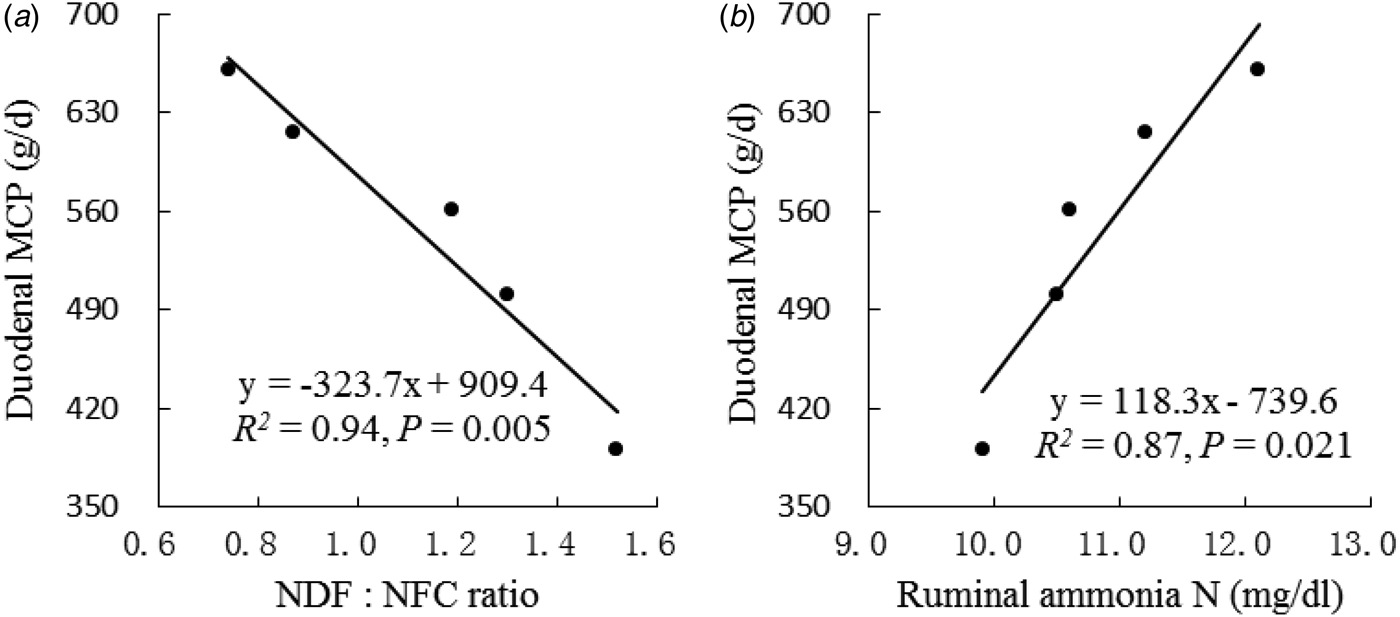
As shown in Table 3, although daily urine excretion did not differ, allantoin and uric acid excretions in the urine increased linearly with decreasing NDF : CP ratio (P < 0·001). Meanwhile, duodenal microbial N flow and estimated MCP yield also increased linearly with decreasing NDF : CP ratio (P < 0·001). Duodenal MCP yield from the rumen (Fig. 3) was negatively correlated with the dietary NDF : NFC ratio (R 2 = 0·94, P = 0·005), whereas it was positively correlated with the mean ammonia N concentration in the rumen (R 2 = 0·87, P = 0·021).
Regressions of the duodenal MCP on (a) dietary NDF : NFC ratio and (b) ruminal ammonia N concentration.
Effect of dietary neutral detergent fibre : crude protein ratio on nitrogen utilization
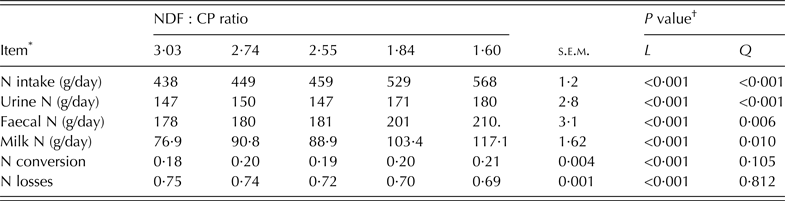
As shown in Table 4, N intake increased quadratically with decreasing NDF : CP ratio (P < 0·001), while urine N (P < 0·001) and faecal N (P = 0·006) decreased quadratically against the ratio. Milk N yield (P < 0·001) and N conversion (P < 0·001) increased linearly with decreasing NDF : CP ratio (P < 0·001). Consequently, N losses decreased linearly (P < 0·001) with decreasing ratio.
Effect of dietary NDF : CP ratio on N utilization in lactating dairy cows fed high-concentrate TMRs (concentrate : forage = 61 : 39) with different forage combinations
* N conversion = milk N/N intake; N losses = (Urine N + faeces N)/N intake.
† L and Q represent linear and quadratic effect of dietary NDF : CP ratio, respectively.
DISCUSSION
Effect of dietary carbohydrate and protein ratio on milk and milk protein yield
Allen (Reference Allen2000) noted that forage NDF was positively correlated with bulk density of the diet, and thus the decreasing NDF : NFC ratio generally resulted in an increase in DMI. In the present study, increased milk yield was closely associated with the increased DMI: Martin & Sauvant (Reference Martin and Sauvant2002) noted that DMI as a driving force in milk yield is essential for lactating dairy cows to obtain high milk production and maintain their prolificacy. Wattiaux & Armentano (Reference Wattiaux, Armentano and Wattiaux2006) noted that dietary NFC yielded more energy than NDF in the rumen because its fermentation rate and extent were greater than NDF. Through the diet, the mammary gland is supplied with energy and amino acids to sustain milk production. In the present study, milk yield and energy increased linearly with decreasing ratios of NDF : NFC and NDF : CP, probably due to the increase of fermentation energy from NFC and rumen-degradable proteins to meet energy and amino acid requirements for milk production, respectively. Moorby et al. (Reference Moorby, Dewhurst, Evans and Danelón2006) reported that an increase in milk yield of nearly 8 kg/day was observed when dietary energy intake was increased along with increased DMI (>7 kg/day) by increasing concentrate to forage ratio from 20 : 80 to 65 : 35. A similar increase in milk yield with increased energy intake was also reported in two other studies (Rinne et al. Reference Rinne, Jaakkola, Kaustell, Heikkila and Huhtanen1999; Kuoppala et al. Reference Kuoppala, Yrjänen, Jaakkola, Kangasniemi, Sariola and Khalili2004). The milk yield increments observed in the present Latin square study were not as high as those observed by the above researchers, probably due mainly to feed intake restriction. Under a fixed concentrate-to-forage ratio (61 : 39), the results in the present study indicated that increasing dietary NDF : NFC ratio without the increase of DMI was not beneficial for milk yield whenever maize stover was included as sole forage source or partially replaced by Chinese wild rye grass with comparatively less NDF and more NFC content.
Grings et al. (Reference Grings, Roffler and Deitelhoff1991) reported that daily milk yield increased linearly from 36·6 to 38·6 kg as dietary CP content increased from 138 to 239 g/kg DM. Wang et al. (Reference Wang, Liu, Yuan, Wu, Zhai and Ye2007) noted that increasing dietary CP content often increased the milk production of lactating dairy cows, and it was explained that more rumen degradable proteins were metabolized by rumen microbes to produce more ammonia N for MCP synthesis. Although the absolute increases in milk yield are rather marginal, the milk component yield except milk fat yield was significantly increased with decreasing NDF : CP. The positive correlation of milk protein yield with ruminal ammonia N and duodenal MCP flow agrees with Wright et al. (Reference Wright, Moscardini, Luimes, Susmel and McBride1998), who reported that the increase of dietary CP content satisfied the requirement of available N release for MCP synthesis, resulting in the increase not only in milk yield but also in milk protein yield. Under a fixed concentrate-to-forage ratio (61 : 39), the results of the present study suggested that milk protein yield instead of milk fat was mainly increased by increasing dietary CP content when the maize stover was excluded and replaced in a stepwise fashion by maize silage combined with Chinese wild ryegrass and/or alfalfa hay in the TMRs.
Effect of dietary carbohydrate and protein ratio on rumen ammonia, blood urea nitrogen and microbial crude protein synthesis
In the rumen, ammonia is derived from microbial degradation of dietary protein and non-protein N, from hydrolysis of urea recycled to the rumen, and from degradation of MCP. In the present study, ammonia N concentration increased with increasing dietary CP intake and further confirmed the previous report of Leng & Nolan (Reference Leng and Nolan1984), who reported that ammonia was mainly derived from the degradation of dietary protein by rumen microbes. Diurnal ammonia N in the present study varied throughout the 24-h period in relation to the time of feeding, probably due to increased availability of rumen-degradable protein after feeding in the morning and afternoon. Rodríguez et al. (Reference Rodríguez, Stallings, Herbein and McGilliard1997) also observed a peak in ammonia N concentration at 2 h after feeding in lactating cows. In the present study, the diurnal ammonia N profile in relation to the time of feeding suggests that an increase in feeding frequency could be beneficial for stabilizing the rumen environment, especially ammonia N concentration.
Russell et al. (Reference Russell, Sniffen and Van Soest1983) noted that ruminal proteolysis and deamination will proceed to complete conversion of dietary protein to excessive ammonia N if carbohydrate availability is low. The excessive ammonia N absorbed through the rumen wall into the blood will convert to urea N in the liver (Linn & Olson Reference Linn and Olson1995). In accordance with ammonia N variation in the rumen, blood urea N also peaked after the time of feeding. In the present study, the positive correlation between blood urea N and rumen ammonia N (R2 = 0·94) further confirmed that blood urea N came mainly from the ruminal ammonia N. Tyrrell et al. (Reference Tyrrell, Moe, Flatt, Schurch and Wenk1980) noted that the process of converting absorbed rumen ammonia to blood urea N by the liver requires adenosine triphosphate. Although the dietary energy content and ruminal ammonia N increased with the stepwise decrease of dietary NDF : NFC and NDF : CP ratios, the lack of increase in blood urea N was probably due to the increase of ruminal MCP yield. The above results suggest that the concentration of blood urea N may reflect the efficiency of ruminal ammonia utilization to some extent.
Meng et al. (Reference Meng, Kerley, Ludden and Belyea1999) noted that dilution rate significantly influenced ruminal microbial fermentation of carbohydrates, and it was positively correlated with MCP yield and microbial growth efficiency. Rodríguez et al. (Reference Rodríguez, González, Alvir, Repetto, Centeno and Lamrani2000) noted that higher DMI could lead to an increase of rumen out-flow rate. In contrast, the slight increases in DMI observed in the present study were unlikely to have influenced microbial growth efficiency and MCP yield by increasing the rumen out-flow rate. Since dietary NFC is fermented faster than NDF in the rumen, decreasing ratios of NDF : CP and NDF : NFC should be beneficial for microbial capture of ammonia N from rumen degradable CP to produce MCP by taking up ATP from the fermentation of dietary NFC. Hoover & Stokes (Reference Hoover and Stokes1991) found that microbial protein produced in the rumen was always high when the diets contained high NFC proportion, and this could explain why the duodenal microbial N flow in Fig. 3 was positively correlated with ruminal ammonia N and negatively correlated with dietary NDF : NFC ratio (Fig. 3).
Ammonia N is the preferred N source of fibre-degrading microbes in the rumen (Russell et al. Reference Russell, O'Connor, Fox, Van Soest and Sniffen1992), and provision of rumen degradable fibre, can enhance ruminal ammonia utilization (Firkins Reference Firkins1997). Hristov & Ropp (Reference Hristov and Ropp2003) noted that a diet providing a comparatively high ratio of NDF : NFC (e.g., 341 g NDF/kg and 403 g NFC/kg) enhanced transfer of ruminal ammonia and microbial N into milk protein compared with a diet containing low NDF : NFC ratio (e.g., 261 g NDF/kg and 478 g NFC/kg). In the present study, the greatest duodenal microbial N flow occurred when dietary NDF : CP ratio was 1·60 : 1 (285 g NDF/kg : 178 g CP/kg, DM basis), suggesting that the ratio of 1·60 : 1 under the fixed concentrate-to-forage ratio (61 : 39) was beneficial for rumen MCP synthesis. Allen & Mertens (Reference Allen and Mertens1988) noted that dietary NDF content in rations of lactating cows should be limited to between 280 and 320 g/kg DM, and the deficiency of rumen available energy due to high NDF content could explain why the rumen MCP synthesis was lower in TMRs that included maize stover rather than maize silage under the fixed concentrate-to-forage ratio.
Effect of dietary carbohydrate to protein ratio on nitrogen utilization
If the ruminal ammonia is not utilized for MCP synthesis, it will form urea. The urea leaves the liver via the bloodstream, equilibrates with body tissues, and is concentrated in the kidney for excretion in the urine, which represents a net N loss to the animal and contributes to environmental pollution (Tamminga Reference Tamminga1992). Because rumen microbes form a large proportion of their cell protein from ruminal ammonia N (Hristov & Broderick Reference Hristov and Broderick1996), enhanced MCP synthesis may result in more efficient transfer of ammonia N into body and milk proteins, thereby reducing N loss.
Improving the efficiency of microbial ammonia capture in the rumen by decreasing dietary NDF : CP ratio reduced N losses in the present experiment. Maize stover, a common source of roughage, is characterized by high NDF content and low available energy. In contrast, alfalfa usually results in high intakes due to its high digestibility and passage rate of DM and NFC, while maize silage is actually a mix of concentrate (maize starch) plus fibrous DM, thus increasing energy availability in the rumen. Despite an increase in daily N intake observed with decreasing NDF : CP ratios, the decrease of urinary and faecal N excretion resulted in an increase of duodenal MCP yield and N retention in milk, and the decrease of blood urea N further confirmed, metabolizable N was mainly used for MCP yield and N retention. The increase of milk N indicated more N retention occurred in milk protein synthesis with high milk N efficiency.
In the present study, the milk protein yield in Fig. 1 was negatively correlated with dietary NDF : NFC ratio, and positively correlated to ruminal ammonia N and duodenal MCP flow, suggesting that increasing the dietary carbohydrate availability and CP by decreasing NDF : CP ratio may increase N retention in milk protein, thereby decreasing N losses in faeces and urine.
In summary, decreasing NDF : NFC and NDF : CP ratios in the TMRs under a fixed forage to concentrate ratio (39 : 61) resulted in a reduction of blood urea N and N excretion into urine and faeces though slight differences in DMI were presented in lactating cows. The enhanced N utilization in the maize silage-based TMRs in comparison with maize-stover-based TMRs increased milk yield and the synthesis of milk protein instead of milk fat in lactating cows, very possibly due to high transfer of ammonia N into rumen MCP with the huge increase of dietary NFC content and the decrease of NDF : CP ratio. The present results indicate that not only increasing dietary non-structural carbohydrate content but also adjusting the ratio of structural carbohydrate to CP ratio are important diet formulation strategies for mitigating N losses in lactating cows.
The authors appreciate financial supports of National Key Basic Research Program (Project no. 2011CB100801) and Modern Dairy Industrial Science and Technology Program (Project no. 2012BAD12B02) of The Ministry of Science and Technology of the People's Republic of China and Innovation Funds for Graduate Student of China Agricultural University (Beijing, China).