Introduction
Seed germination results from the competition between the embryo growth potential and the mechanical constraints imposed by tissues surrounding it (Endo et al., Reference Endo, Tatematsu, Hanada, Duermeyer, Okamoto, Yonekura-Sakakibara, Saito, Toyoda, Kawakami, Kamiya, Seki and Nambara2012; Steinbrecher and Leubner-Metzger, Reference Steinbrecher and Leubner-Metzger2016). Wild soybean (Glycine soja) possesses a hard tegument that impedes germination by avoiding water uptake during imbibition. However, this hardness feature has been lost among the many transformations undergone by cultivated soybean [(Glycine max, L.) Merr.] during domestication (Sakamoto et al., Reference Sakamoto, Abe, Kanazawa and Shimamoto2004; Doebley et al., Reference Doebley, Gaut and Smith2006; Paulsen et al., Reference Paulsen, Colville, Kranner, Daws, Högstedt, Vandvik and Thompson2013). Therefore, and although the tegument still retains some restrictions to germinate during development (Montechiarini, Reference Montechiarini2018), the embryo growth potential becomes the main force to complete germination after drying maturation in soybean seeds. Moreover, while the loosening of surrounding tissues is a pre-requisite to germinate for several species, the embryo growth potential is still necessary for radicle emergence in all seeds (Bradford and Nonogaki, Reference Bradford and Nonogaki2007; Nonogaki et al., Reference Nonogaki, Bassel and Bewley2010; Bewley et al., Reference Bewley, Bradford, Hilhorst and Nonogaki2013). Observations made on several species have shown that elongation of the embryonic axis is due to cell expansion, not cell division (Gimeno-Gilles et al., Reference Gimeno-Gilles, Lelièvre, Viau, Malik-Ghulam, Ricoult, Niebel, Leduc and Limami2009; Sliwinska et al., Reference Sliwinska, Bassel and Bewley2009). Additionally, Sliwinska et al. (Reference Sliwinska, Bassel and Bewley2009) have shown that, in Arabidopsis thaliana, this enlargement preferentially occurred at the radicle–hypocotyl transition zone, commonly known as ‘elongation zone’ (EZ). Germination thus leads to cell expansion within the EZ, resulting from cell wall relaxation and enough hydrostatic pressure coupled to water uptake as the driving force. Water uptake during that process is governed by the difference in water potential between seeds and the incubation media (Weitbrecht et al., Reference Weitbrecht, Müller and Leubner-Metzger2011), and involves three consecutive phases. During Phase I, water uptake is fast and physically driven until reaching the second phase, when water uptake stops and water contents remain relatively constant. At the end of the second phase, cells in the EZ experience a cell wall relaxation that allows completing germination at the beginning of Phase III (germination sensu stricto) and continuing with water uptake onward (Bewley et al., Reference Bewley, Bradford, Hilhorst and Nonogaki2013).
Plant cell walls determine cell shape, keep cells together, protect plants against pathogens and allow that high turgor pressures can be developed by cells thus giving great stability to plants. At the same time, its flexibility allows cells to grow through stress relaxation and controlled irreversible extension. This process starts with the selective loosening of the cell wall and requires the coordinated de novo synthesis of structural components to be included in the growing cell wall to maintain its mechanical integrity (Cosgrove, Reference Cosgrove2000; Darley et al., Reference Darley, Forrester and McQueen-Mason2001; Sampedro and Cosgrove, Reference Sampedro and Cosgrove2005). Briefly, cellular expansion depends on the subtle balance between the rigidity and relaxation of the cell walls. Both properties are connected by a cyclic mechanosensing pathway, which describes a strictly regulated cell wall remodelling process (Wolf et al., Reference Wolf, Hématy and Höfte2012). During germination, cell expansion in the EZ is promoted by water entrance as a result of a decreasing osmotic potential, most likely due to the early mobilization of stored reserves to the growing embryo (Bradford and Nonogaki, Reference Bradford and Nonogaki2007). The specific modifications promoting cell wall loosening during germination have yet to be completely elucidated, although expansins, cellulases and xyloglucan endotransglycosylase/hydrolases are most certainly involved (Cosgrove, Reference Cosgrove2016; Sangi et al., Reference Sangi, Santos, Alexandrino, Da Cunha, Coelho, Ribeiro, Lenz, Ballesteros, Hemerly, Venâncio, Oliveira and Grativol2019). Expansins are considered as a primary agent, whereas the other proteins act secondarily during cell wall remodelling (Hernández-Nistal et al., Reference Corpet2010; Xu et al., Reference Xu, Lantzouni, Bruggink, Benjamins, Lanfermeijer, Denby, Schwechheimer and Bassel2020). Moreover, although cell wall loosening might be due, in part, to lytic activity, expansins have been identified as the most potent wall loosening catalysts, despite having no detectable lytic activity (Cosgrove, Reference Cosgrove2016). A total of 75 expansin genes have been identified in the soybean genome, most of which map on chromosome 17. They were grouped in four divergent subfamilies, which are conserved within each subfamily. As a result of soybean expansin gene duplication through evolution, many expansin genes may have overlapping functions. However, the differences among the cis-elements in the promoter regions and positive selection might be responsible for the functional divergence of duplicated genes, and the expression profiles of the soybean expansins support the idea that most of them are highly cell type- or organ-specific (Zhu et al., Reference Zhu, Wu, Song, Yin, Qin, Yan and Hu2014).
Expansins induce cell wall relaxation and creep by a still enigmatic molecular mechanism; they neither hydrolyze the cell wall nor exhibit other enzymatic activities. The effects of expansins on the cell wall are maximal at low pH (~4), consistent with their role in the acid growth response of plants by rapidly promoting cell elongation through auxin-induced acidification of the cell wall space (Cosgrove, Reference Cosgrove2000, Reference Cosgrove2016).
Germination can be inhibited both osmotically, by reducing water uptake, and/or physiologically, by affecting the biomolecules responsible for the relaxation and enlargement of cell walls. In the first case, while the osmotic restriction to water uptake by polyethylene glycol (PEG) solutions has been well studied in different plant expansion processes (Brummell et al., Reference Brummell, Harpster, Civello, Palys, Bennett and Dunsmuir1999; Chen and Bradford, Reference Chen and Bradford2000; Wrobel and Yoder, Reference Wrobel and Yoder2001; Pezzotti et al., Reference Pezzotti, Feron and Mariani2002; Giordano and Hirsch, Reference Giordano and Hirsch2004; Gray-Mitsumune et al., Reference Gray-Mitsumune, Mellerowicz, Abe, Schrader, Winzéll, Sterky, Blomqvist, McQueen-Mason, Teeri and Sundberg2004; Jones and McQueen-Mason, Reference Jones and McQueen-Mason2004; Balestrini et al., Reference Balestrini, Cosgrove and Bonfante2005; Belfield et al., Reference Belfield, Ruperti, Roberts and McQueen-Mason2005; Dotto et al., Reference Dotto, Martínez and Civello2006), a common molecular effect on expansins is not conclusively defined (Bradford and Nonogaki, Reference Bradford and Nonogaki2007). In the second case, the plant hormone abscisic acid (ABA) is the main known inhibitor of seed germination by preventing cell wall loosening (Schopfer and Plachy, Reference Schopfer and Plachy1985; Gosparini et al., Reference Gosparini, Busilacchi, Vernieri and Morandi2007; Gimeno-Gilles et al., Reference Gimeno-Gilles, Lelièvre, Viau, Malik-Ghulam, Ricoult, Niebel, Leduc and Limami2009; Hernández-Nistal et al., Reference Hernández-Nistal, Martín, Esteban, Dopico and Labrador2010). Noteworthy, a time window of ABA action was demonstrated in A. thaliana seeds, after which ABA control upon germination is lost (Chiu et al., Reference Chiu, Pan, Zhao and Gazzarrini2016). The inhibitory mechanism is mediated by blocking the proteasome activity. ABA has also been reported to control the accumulation of structural proteins associated with cell wall remodelling during germination of Medicago truncatula (Gimeno-Gilles et al., Reference Gimeno-Gilles, Lelièvre, Viau, Malik-Ghulam, Ricoult, Niebel, Leduc and Limami2009) and Cicer arientinum (Hernández-Nistal et al., Reference Hernández-Nistal, Martín, Esteban, Dopico and Labrador2010) seeds, with expansin expression being transcriptionally down-regulated by the phytohormone.
In the present work, we studied expansion growth during germination of soybean embryonic axes, focusing our molecular analysis on the EZ. We found that growth of embryonic axes in distilled water was correlated with increased expression of an expansin gene in the EZ during germination, which we identified as EXP1 by in silico analyses. Our results also show that the expression level of EXP1 in the EZ changed differentially during the incubation of axes under inhibitory conditions in the presence of ABA or PEG. Noteworthy, even though both ABA and PEG treatments inhibited germination, EXP1 expression displayed opposite behaviours in the presence of the two inhibitors, being repressed and induced, respectively. Additionally, the expression levels of EXP1 correlated with the ABA effect on embryonic axes' growth during the time window of ABA responsiveness, which corresponds to about 6 h of water incubation. We therefore propose an early role for EXP1 in the initial cell wall loosening of the EZ during embryonic axes' growth, being a candidate target of control during soybean seed germination.
Materials and methods
Plant material and germination assays
Embryonic axes of dry mature soybean [Glycine max (L.) Merr.] seeds, cv. Williams 82, were used. Axes were manually dissected using a surgical blade and then incubated in the dark at 27 ± 1°C in sterilized Petri dishes on top of three filter papers saturated with different incubation media, which were renewed daily. Axes were considered germinated when an enlargement ≥2 mm of the radicle extreme was registered. Percentages of germination (%G) and axes' (Ax) water uptake (μl Ax−1) were recorded at different times of incubations depending on the experiments. To determine water uptake, every replicate was previously superficially dried and weighted in a Precisa 205 A SuperBal – series scale (10−5 g).
Three germination assays were performed. The first two assays were carried out to study the physiological and osmotic effect on soybean embryonic axis germination, and the last assay was conducted to further explore the ABA role in that process. In the first germination assay, three replicates of ten axes each were incubated in distilled water, 50 μM ABA or −1 MPa PEG solution (Michel, Reference Michel1983) during 168 h. This ABA concentration and the water potential of the PEG solution were chosen based on previous reports showing that they inhibit soybean embryonic axis germination (Montechiarini, Reference Montechiarini2018). In the second germination assay, three replicates of ten axes each were first incubated in 50 μM ABA or −1 MPa PEG during 24 h and then transferred to distilled water, continuing the incubation for an additional 24 h. In the third germination assay, two replicates of 110 axes were first incubated in distilled water. Then, lots of ten axes were transferred every hour (from 1 to 12 h) to 50 μM ABA, and incubation continued for 24 h. Controls of ABA incubation (0 h) were included.
Identification of the EZ by in vivo non-destructive cell enlargement measurements
Macroscopic observations
Axes of dry mature soybean seeds were equidistantly marked with water-insoluble ink and then incubated in distilled water or in 50 μM ABA at 27 ± 1°C. The same axes were periodically photographed during incubation. Their enlargement during germination was visualized from changes in marks, such as widening in shape and/or in distance between two successive marks, before and after incubation. These changes allowed the localization of the EZ. Time-lapse videos were constructed to better visualize the embryonic axes' growth as the incubation time progressed in the two incubation media (Supplementary Material).
Microscopic observations
Because of the requirement of hydrated tissues to carry out the in vivo non-destructive microscopic observations, axes of soybean seeds at physiological maturity (before starting drying maturation) were used in this experiment. Axes were incubated in germination conditions in distilled water during 12 h. Cell sizes in the EZ were registered at 0 and 12 h of incubation. Images were obtained at 540 nm (wavelength of the chlorophyll contained in the axes) using a Nikon C1 plus (Nikon Instruments Inc., Melville, NY, USA) confocal microscope mounted on an Eclipse TE-2000-E2 inverted microscope with laser system illumination. Images were photographed using 5× or 20× objectives (numerical aperture 0.8) with 3× scanning zoom and analysed using the EZ-C1 software. The reported results for macroscopic and microscopic observations are representative of, at least, ten incubated axes.
Total RNA isolation
At least three axes of dry mature soybean seeds were collected at different incubation times in the dark at 27 ± 1°C in different incubation media depending on the experiment. Then, axes were manually dissected in two zones, the EZ and the extremes (E) at each side of the EZ (the plumule and the radicle). Both E and EZ were immediately frozen in liquid N2 and stored at −70°C until RNA purification. Total RNA was isolated from ~30 mg of tissue using the SV Total RNA Isolation System kit (Promega, Madison, WI, USA), according to the manufacturer's instructions. RNA was suspended in 100 μl of nuclease-free water and stored at −70°C. RNA quality was confirmed on a Lambda Bio+ Spectrophotometer (Perkin Elmer Inc., Waltham, MA, USA) and its integrity on a 2% (w/v) agarose gel dyed with 0.5 μg μl−1 ethidium bromide (EtBr). One μg of total RNA was employed as a template to synthesize cDNA using SuperScript™ II Reverse Transcriptase (Invitrogen, Thermo Fisher Scientific, Waltham, MA, USA), according to the manufacturer's instructions, in 20 μl final volume.
Design of primers
To screen expansin cDNAs of the EZ during soybean germination, four degenerate pairs of primers were designed (Sequencher; PRIMER 3; Rozen and Skaletsky, Reference Rozen and Skaletsky2000) and synthesized (IDT, Biodynamics, CABA, Argentina) based on the root-specific expansin gene previously associated with soybean root elongation (EXP1; accession no. AF516879; Lee et al., Reference Lee, Ahn, Song, Choi and Lee2003) and on other soybean sequences which had the highest Basic Local Alignment Search Tool (BLAST; https://www.ncbi.nlm.nih.gov/) homology to an expansin (TC96054) related to ABA inhibition of M. truncatula embryonic axis germination (Gimeno-Gilles et al., Reference Gimeno-Gilles, Lelièvre, Viau, Malik-Ghulam, Ricoult, Niebel, Leduc and Limami2009).
Identification of expansins expressed in the EZ from soybean embryonic axes
Only one putative expansin cDNA could be isolated from the EZ of germinated axes (12 h of incubation in distilled water) by reverse transcription (RT-PCR), using one pair of primers (Fw: 5′-GGTAGCCTCATTGGATTATGC-3′; Rev: 5′-GCCTTGATAGAGGGCTTGG-3′). PCRs (40 cycles) were carried out in a thermocycler TC-PRO (Boeco, Germany) using the following conditions: 30 s at 95°C for denaturation, 30 s at 56°C for annealing and 1 min at 72°C for elongation. The amplified products from five replicates were verified on a 1.5% agarose gel, dyed with 0.5 μg μl−1 EtBr and sequenced (Macrogen Inc., Korea). Forward and reverse sequences of all five replicates were analysed by BLAST to assign the consensus expansin sequence. The construction of a phylogenetic tree (Supplementary Material) was conducted using the MEGA-X program (Kumar et al., Reference Kumar, Stecher, Li, Knyaz and Tamura2018), and the alignment of sequences (Supplementary Material) was carried out using the Multiple Sequence alignment software (Corpet, Reference Corpet1988; http://multalin.toulouse.inra.fr/multalin/).
Expansin mRNA expression analysis
Quantitative analyses on real-time PCRs (qPCR) were carried out in a Rotor-Gene Q Series (Qiagen®, Hilden, Germany) using cDNA from the EZ of axes and primers specifically designed for the expansin sequence previously identified, which are expected to amplify a 131-bp fragment. Glyma05g37470 was used as a reference gene since it was reported as optimum for soybean seed germination (Li et al., Reference Li, Fan, Zhang and Fu2012). The reaction contained Real Mix 2× (Biodynamics), 10 μM of forward (5′- GCCCTTCCTAACAACAATGG-3′) and reverse primers (5′-CATGGAACCCTTTGAAATAGC-3′) and 2 μl of a 1:5 dilution of cDNA, in 15 μl final volume. Negative controls (without cDNA) were also included. Reaction conditions (40 cycles) were: 15 s at 95°C for denaturation, 30 s at 58°C for annealing and 40 s at 72°C for elongation. Reactions were carried out by triplicate with two biological replicates.
Expansin expression levels in the EZ were measured after different incubation times in distilled water, 50 μM ABA, or −1 MPa PEG and normalized against the levels measured in dry mature axes. Expansin expression levels in the EZ were also measured at 6 h of incubation in 50 μM ABA after 6 or 12 h of previous water incubations and normalized against the respective levels measured before ABA incubation. Results were analysed with the REST 2009 software (https://www.gene-quantification.de/rest-2009.html).
Results
Germination assays
To evaluate physiological and osmotic effects on soybean germination, experiments in distilled water, 50 μM ABA or −1 MPa PEG, and experiments of transfer from inhibitory germination conditions (50 μM ABA and −1 MPa PEG) to water were conducted.
Germination dynamics and water uptake were followed for soybean embryonic axes during 168 h of incubation in either water, ABA or PEG (Fig. 1). Soybean axes in distilled water started to germinate from 6 h of incubation, reaching 98 and 100%G at 12 and 24 h of incubation, respectively. Instead, germination did not occur in either 50 μM ABA or −1 MPa PEG during the 168 h of the experiment (Fig. 1). The initial water uptake (Phase I) was similar for axes incubated in water or ABA. This phase was complete by about 2 h of incubation, reaching Phase II with a mean of 6 μl H2O Ax−1 in both incubation media (inset Fig. 1). Phase II proceeded up to ~6 h of incubation in distilled water, after which water uptake progressively increased, coincidentally with the start of Phase III. Instead, axes incubated in 50 μM ABA remained in Phase II without starting Phase III during the time of the experiment (Fig. 1). When incubated in −1 MPa PEG, axes gained water more slowly during Phase I, reached Phase II later (~3 h of incubation) with less water content (5.58 μl Ax−1; inset Fig. 1) and, as in the case of ABA, they remained in Phase II until the end of the experiment (Fig. 1).
Germination (%) time-course (a) and water uptake (μl Ax−1) time-course (b) of soybean embryonic axes (Ax) incubated in distilled water (open triangles), 50 μM ABA (open circles) or −1 MPa PEG (asterisks) at 27 ± 1°C, in the dark. Each data point represents the mean ± SE for three replicates of ten axes. If not shown, SE was within the data point. The inset in (b) shows the first 24 h of incubation.

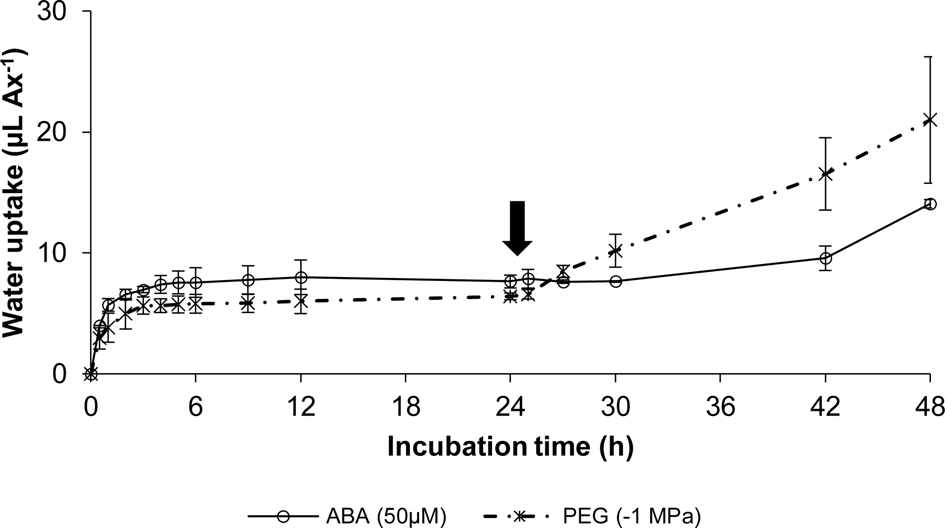
Germination dynamics (data not shown) and water uptake were also measured in axes that were first incubated for 24 h under inhibitory conditions (50 μM ABA or −1 MPa PEG) and then transferred to water for another 24 h (Fig. 2). Axes that did not germinate in any of the two first inhibitory media were still capable of germinating after its transfer to distilled water. However, while axes pre-incubated in ABA required at least 12 h to restart water uptake after transfer to distilled water, axes initially incubated in PEG needed only 3 h of incubation in distilled water after transfer to restart water uptake and germination (Fig. 2).
Water uptake (μl Ax−1) time-course of soybean embryonic axes (Ax) incubated during the first 24 h in 50 μM ABA (open circles), or −1 MPa PEG (asterisks) and subsequently transferred to distilled water and incubated 24 more hours at 27 ± 1°C, in the dark. Each data point represents the mean ± SE for three replicates of ten axes. If not shown, SE was within the data point. The arrow indicates the time of transfer to distilled water.
To further explore the role of ABA in the control of soybean embryonic axis germination, the time window of ABA responsiveness was assessed from water–ABA transfer experiments (Fig. 3). Germination dynamics (data not shown) and water uptake were measured in axes that were incubated in distilled water for 1–12 h before its transfer to 50 μM ABA, at 1-h intervals, continuing the incubation during the following 24 h. Water uptake was recorded from the beginning of the transfer, every 2 h until 12 h and then, at 24 h of ABA incubation (Fig. 3). The name assigned to each curve in Fig. 3 corresponds to the respective incubation times in distilled water before transfer to ABA. Axes directly incubated in 50 μM ABA (0 h curve; Fig. 3) corresponded to the control condition without previous incubation in water. These axes rapidly gained water, reaching Phase II and remaining there until the end of the experiment (Fig. 3). As expected for the axes pre-incubated in water, the longer the time of water incubation, the higher the water content of axes at the moment of transfer to ABA (Fig. 3). Axes pre-incubated in water for 1–6 h reached a similar water content to the control of ABA incubation (~6.5 μl) and stopped water uptake for the rest of the experiment (1–6 h curves; Fig. 3). Moreover, the germination of these axes was arrested by ABA and they remained in Phase II until the end of the experiment. In contrast, axes pre-incubated in water longer than 6 h (7–12 curves, Fig. 3) completed Phase II before transferring them to ABA. These axes continued water uptake and their germination was not arrested despite ABA presence.
Water uptake (μl Ax−1) time-course of soybean embryonic axes (Ax) incubated in distilled water (incubation times left of the ordinate axis), transferred every hour (from 1 to 12 h) to 50 μM ABA and incubated 24 more hours (incubation times right of the ordinate axis) at 27 ± 1°C, in the dark. Curve 0 h corresponded to a control of ABA incubation. Curves 1–12 h corresponded to the water incubation times of axes before the transfer to ABA. Each data point represents the mean ± SE for two replicates of ten axes. If not shown, SE was within the data point.

EZ identification
To identify the EZ, changes in shape and distance between successive marks in axes before and after germination were registered at different times during 24 h of incubation in distilled water (supplementary Video S1). This experiment allowed visualization of the zone where elongation preferentially occurred, defined as the EZ. It comprised the region localized approximately 2 mm under the plumular extreme and immediately above the radicle. A time-lapse video was also constructed to show the embryonic axes' growth in 50 μM ABA as the incubation time progressed (supplementary Video S2). Axes rapidly took water and swelled upon incubation in both water and ABA, reaching Phase II at around 2 h of incubation, when water uptake and axes enlargement stopped. From 6 h of incubation on, axes in water resumed water uptake and, from about 10 h onward they looked visibly elongated, preferentially in the EZ, whereas axes exposed to ABA remained in Phase II without experiencing either further water uptake or enlargement (supplementary Videos S1 and S2).
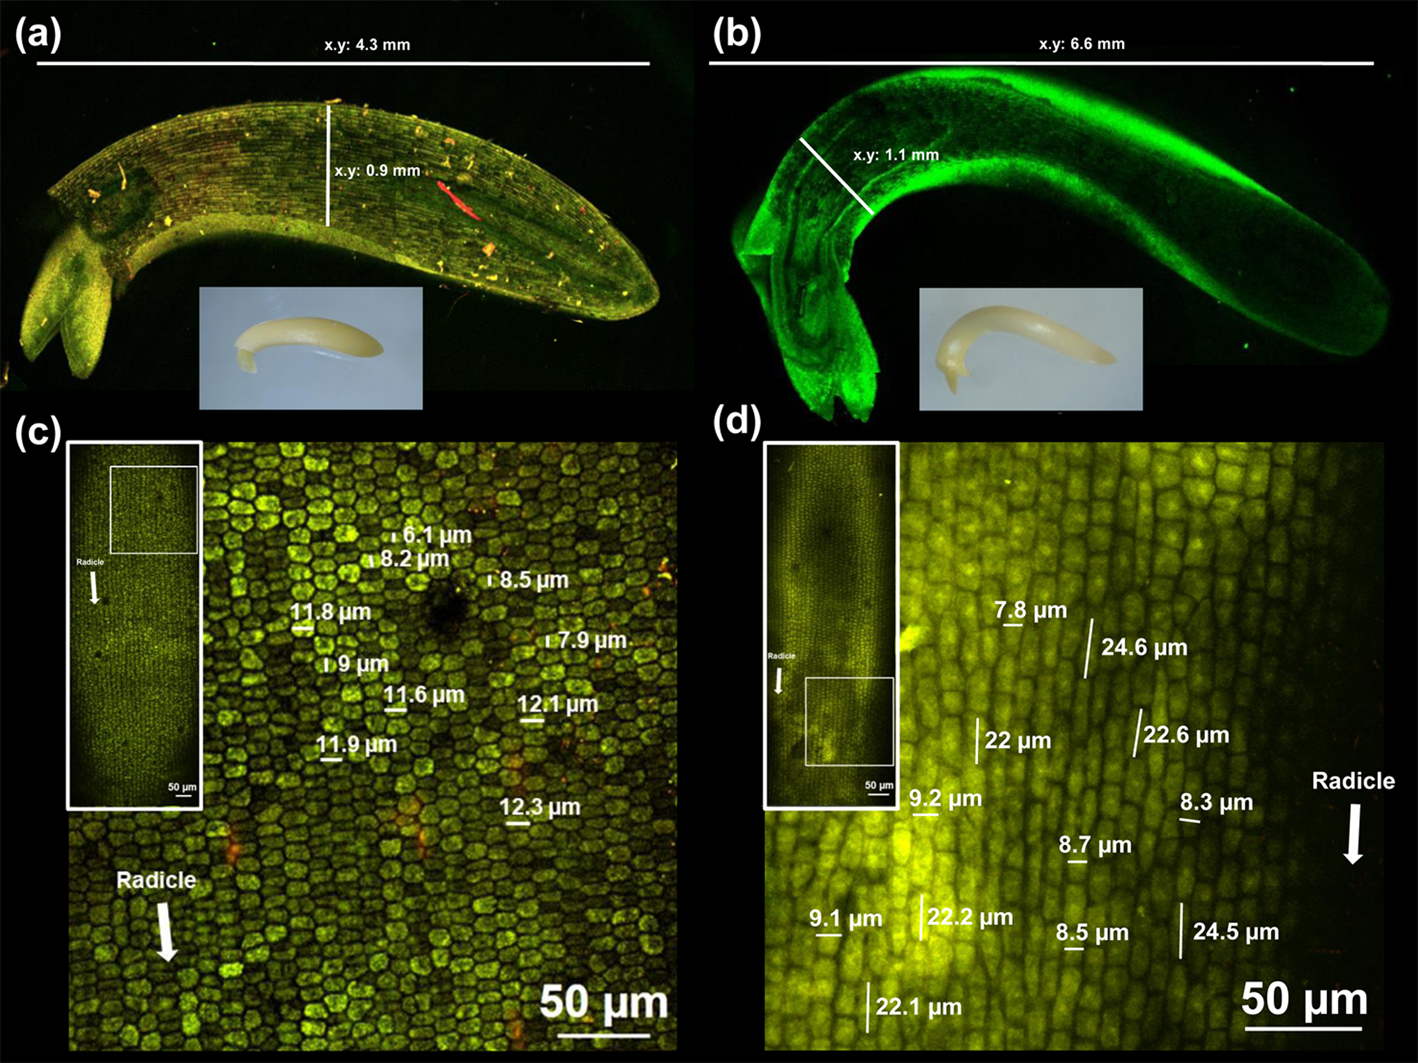
Moreover, analysis by in vivo non-destructive observations with confocal microscopy showed that the embryonic axes grew preferentially in longitude, with cells on the EZ increasing in length between two and three times as embryonic axes' growth progressed (Fig. 4 and supplementary Fig. S1).
Digital (bottom inset) and confocal microscopy images of soybean embryonic axes at (a) 0 h and (b) 12 h of incubation in distilled water at 27 ± 1°C, in the dark, using a 5× objective (numerical aperture 0.8) with 3× scanning zoom. Confocal microscopy images of cells from the EZ at (c) 0 h and (d) 12 h of incubation in distilled water using a 5× (left inset) and 20× objective (numerical aperture 0.8) with 3× scanning zoom. The images represent, at least, ten incubated axes. Other details are given in Materials and methods. Unfocused regions in the images are due to the irregular surface of the embryonic axes.
Expansin cDNA identification in the axis EZ
To screen for the presence of expansin cDNAs at the EZ tissue during soybean germination, four pairs of primers were utilized. Just one of them resulted in a single amplified product of ~900 bp (supplementary Fig. S2). Forward and reverse sequences of five replicates were analysed to assign a consensus expansin sequence. BLAST analysis showed strong sequence similarities to soybean expansins, being identical to EXP1 (NM_001250921.2; 100% of identity, 100% query cover; E-value 0). In a recent study, the gene encoding this EXP1 was identified as GmEXPA37 (Glyma17g37990) according to its position in chromosome 17 of the soybean genome, where most expansin genes have been mapped (Zhu et al., Reference Zhu, Wu, Song, Yin, Qin, Yan and Hu2014). The results of the phylogenetic tree for the 75 soybean expansin genes placed the amplified sequence in the branch where only Glyma17g37990 was located (supplementary Fig. S3). The alignment of that sequence with the genomic and coding sequences of Glyma17g37990 shows that it comprised almost the complete coding sequence with maximum homology (supplementary Fig. S2). Additionally, from the comparison among that sequence and Glyma17g37990, Glyma04g02380 and Glyma06g02420, all of them reported as segmental duplicated genes (Zhu et al., Reference Zhu, Wu, Song, Yin, Qin, Yan and Hu2014), it was confirmed a general high homology for all sequences but an absolute coincidence with Glyma17g37990 (supplementary Fig. S4). Then, we onward named the isolated sequence EXP1.
Expansin expression
Quantitative analyses were carried out by qPCR to explore the possible relationships among EXP1 expression and the physiological and osmotic controls of soybean embryonic axis germination. EXP1 expression levels significantly increased (1.9–2.7 times, P < 0.05) relative to those of dry mature control axes during 12 h of incubation in distilled water, from the third hour on and reaching the highest value at 7 h of incubation (Fig. 5). During that period, all analysed axes had completed Phases I and II of imbibition, appearing visibly elongated from 10 h on, and germination was almost complete at 12 h of incubation (Fig. 1).
Expression of EXP1 in the EZ of soybean embryonic axes relative to the dry mature axes (dotted line), and after various hours of incubation in 50 μM ABA (filled bars), distilled water (empty bars), or −1 MPa PEG (dashed bars), as determined by qPCR. Analyses were normalized to the reference gene Glyma05g37470. Error bars represent the means ± SD of two biological replicates by triplicate. *Significant difference (P < 0.05).
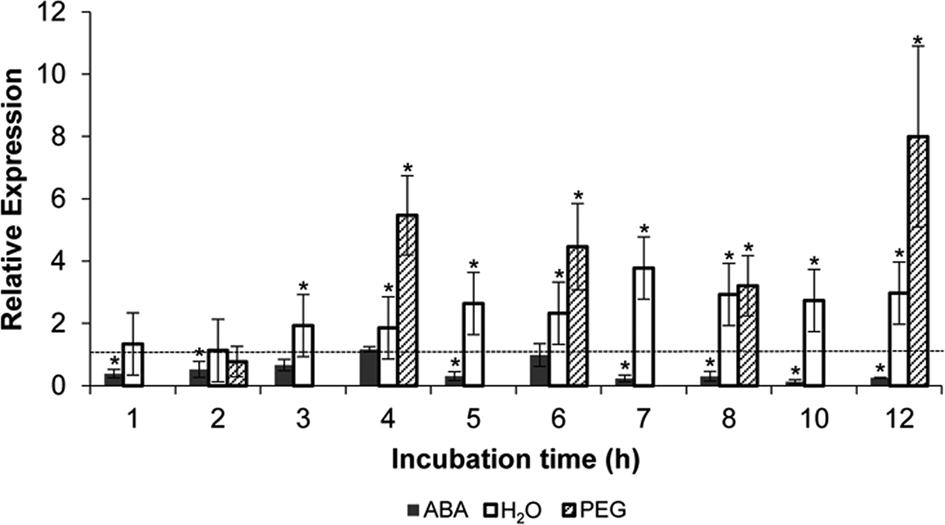
When qPCR analyses were performed in the EZ of dry mature soybean embryonic axes incubated in 50 μM ABA during 12 h, it was observed that the relative expression of EXP1 always decreased (ranging from 0.12 to 1.2) and was significantly down-regulated (P < 0.05) for most of the incubation times (Fig. 5). Similar analyses performed in the EZ of embryonic axes incubated in −1 MPa PEG during 12 h, where germination was also inhibited, showed instead that EXP1 levels were significantly up-regulated (ranging from 3.2 to 8.0 times; Fig. 5).
The time window of ABA responsiveness was also estimated using qPCR analysis (Fig. 6). EXP1 expression levels in the EZ at 6 h of incubation in 50 μM ABA after 6 or 12 h of previous water incubations, and normalized against the respective levels measured before ABA incubation, were significantly down-regulated by ABA only in axes previously incubated for 6 h in water (P < 0.05), in line with the time window of ABA action on embryonic axis' germination (Fig. 3).
Expression of EXP1 in the EZ of soybean embryonic axes at 6 h of incubation in 50 μM ABA after 6 or 12 h of previous incubation in water, relative to the respective levels before the transfer to ABA (dotted line), as determined by qPCR. Analyses were normalized to the reference gene Glyma05g37470. Error bars represent the means ± SD of two biological replicates by triplicate. *Significant difference (P < 0.05).

Discussion
In physiological terms, seed germination is an expansion process that does not include cell division or mobilization of the major storage reserves, both processes being regarded as post-germinative events. Accordingly, it has been argued that using embryonic axes isolated from whole seeds is more appropriate to study germination because of its main role in that process (Bewley et al., Reference Bewley, Bradford, Hilhorst and Nonogaki2013). Moreover, only a few cells of the embryonic axis (belonging to the EZ) actually take part in radicle emergence, with the remaining massive organs, such as storage tissues, and seed envelopes playing minor roles in germination per se, and eventually masking crucial events of this process (Bewley et al., Reference Bewley, Bradford, Hilhorst and Nonogaki2013). Consequently, in the present work, we studied the germination of soybean embryonic axes, which were removed from dry whole seeds before incubation, focusing the molecular analyses on the EZ (Fig. 4 and supplementary Fig. S1 and Video S1).
Under germination conditions in distilled water, axes rapidly elongated by following a characteristic triphasic imbibition pattern (Fig. 1). The three phases were better defined, shorter and faster than those for whole seeds (data not shown), basically because of the direct contact of isolated axes (free of the rest massive seed organs) with the incubation medium. Both 50 μM ABA and −1 MPa PEG inhibited axes germination by impairing the initiation of Phase III or, more strictly, the expansion process defining germination (Fig. 1). In ABA-treated axes, the dynamics of imbibition during Phases I and II were similar to those in distilled water, whereas in PEG-treated axes, they took up less water (inset Fig. 1). Moreover, when axes previously incubated under inhibitory conditions in 50 μM ABA or −1 MPa PEG for 24 h were subsequently transferred to water, germination was restored, although at different times (Fig. 2), thus confirming the reversible effect for both controllers and suggesting that different inhibitory mechanisms could be involved. ABA may be blocking some of the biomolecules responsible for cell wall loosening, whereas PEG may be limiting the availability of water required to complete germination, even though a possible molecular effect on cell wall remodelling could not be ruled out, such as reported for tomato seed germination (Chen and Bradford, Reference Chen and Bradford2000; Chen et al., Reference Chen, Dahal and Bradford2001). Regarding ABA, our results also showed that there exists a time window of ABA responsiveness, up to about the sixth hour of incubation in water, where ABA was still effective in arresting germination and after which germination progressed despite the ABA presence (Fig. 3). A similar time window has been demonstrated for seed germination in A. thaliana (Chiu et al., Reference Chiu, Pan, Zhao and Gazzarrini2016) and Sinapis alba L. (Schopfer et al., Reference Schopfer, Bajracharya and Plachy1979), and also for other ABA-mediated processes such as the vegetative growth following germination in A. thaliana (López-Molina et al., Reference López-Molina, Mongrand, McLachlin, Chait and Chua2002, Reference López-Molina, Mongrand and Chua2001).
Expansins have a primary role in cell wall remodelling during plant cell expansion processes. Their expression is correlated with the onset, increase and cessation of cell growth (Sampedro and Cosgrove, Reference Sampedro and Cosgrove2005). In this context, we focused on the expansins responsible for soybean germination. Moreover, since only the EZ of axes is involved in the expansion process during germination (Gimeno-Gilles et al., Reference Gimeno-Gilles, Lelièvre, Viau, Malik-Ghulam, Ricoult, Niebel, Leduc and Limami2009; Sliwinska et al., Reference Sliwinska, Bassel and Bewley2009), we used macroscopic and microscopic observations to define the EZ (supplementary Video S1; Fig. 4 and supplementary Fig. S1, respectively), which was dissected from axes to be used for molecular analysis. Our results indicated that the inhibitory germination conditions analysed in the present work particularly affected the expansion process taking place in the EZ (supplementary Fig. S1 and Video S2).
In silico studies for the PCR-amplified product in the EZ showed sequence identity with EXP1 (NM_001250921.2; Lee et al., Reference Lee, Ahn, Song, Choi and Lee2003). Although this gene (Glyma17g37990) was established to be segmentally duplicated with Glyma04g02380 and Glyma06g02420 (Zhu et al., Reference Zhu, Wu, Song, Yin, Qin, Yan and Hu2014), the comparison among these sequences and the amplified product only showed absolute coincidence with Glyma17g37990 (supplementary Figs. S2–S4), thus confirming that this is the expansin associated with soybean axes germination. Coincidentally, Bellieny-Rabelo et al. (Reference Bellieny-Rabelo, De Oliveira, Da Silva Ribeiro, Pessoa Costa, Oliveira and Venancio2016) and Sangi et al. (Reference Sangi, Santos, Alexandrino, Da Cunha, Coelho, Ribeiro, Lenz, Ballesteros, Hemerly, Venâncio, Oliveira and Grativol2019) confirmed the participation of Glyma17g37990 as the main expansin gene involved in germinating soybean axes. These results and the observation that expansins act in catalytic concentrations despite not having enzymatic activities (Sampedro and Cosgrove, Reference Sampedro and Cosgrove2005) could explain the absence of other expansins amplified by the remaining primers we employed. Either they were no germination-specific or they were very lowly expressed in the EZ tissue of germinated axes.
Additionally, the various expression patterns among the 75 genes belonging to the four soybean expansin subfamilies were associated with the differential distribution of cis-acting regulatory elements in the promoter regions of these genes. The four most abundant cis-elements corresponded to conserved motifs responsive to light, plant hormones, external environmental stresses, and circadian control. Recently, Xu et al. (Reference Xu, Lantzouni, Bruggink, Benjamins, Lanfermeijer, Denby, Schwechheimer and Bassel2020) identified transcription factors that bind to expansin promoters and DELLA gibberellin-response elements as part of a molecular network promoting A. thaliana seed germination. In particular, the cis-element related to gibberellin-responsiveness found in Glyma17g37990 (Zhu et al., Reference Zhu, Wu, Song, Yin, Qin, Yan and Hu2014) could explain the expression results of Bellieny-Rabelo et al. (Reference Bellieny-Rabelo, De Oliveira, Da Silva Ribeiro, Pessoa Costa, Oliveira and Venancio2016), which supported a key role of gibberellins in promoting soybean embryonic axis germination, antagonizing ABA effects. Moreover, in previous work, we found that EXP1 was present in the EZ before any incubation, indicating that this transcript belongs to the mRNA pool synthesized during seed development and stored in axes of dry mature seeds, and from which seed germination could be initially supported (Rajjou et al., Reference Rajjou, Gallardo, Debeaujon, Vandekerckhove, Job and Job2004; Montechiarini, Reference Montechiarini2018).
We also found that, following incubation in distilled water, EXP1 was expressed preferentially in the EZ compared with the extremes E (Montechiarini, Reference Montechiarini2018), increasing in abundance in that zone from the first hours of incubation relative to the initial level (Fig. 5). These results support the involvement of EXP1 in soybean axes germination, being actively synthesized during this process at the EZ. EXP1 expression increased gradually with incubation times, significantly from the third hour, and peaked at around the middle of germination completion (6–8 h of incubation, Fig. 5), as reported for other Fabaceae (Gimeno-Gilles et al., Reference Gimeno-Gilles, Lelièvre, Viau, Malik-Ghulam, Ricoult, Niebel, Leduc and Limami2009; Hernández-Nistal et al., Reference Hernández-Nistal, Martín, Esteban, Dopico and Labrador2010). Also, our results partially agree with those of Sangi et al. (Reference Sangi, Santos, Alexandrino, Da Cunha, Coelho, Ribeiro, Lenz, Ballesteros, Hemerly, Venâncio, Oliveira and Grativol2019), who have included expansins into the hierarchical cluster of the highly expressed cell wall-associated genes by describing a similar expression pattern during soybean germination. However, they reported that expansins were preferentially expressed after 12 h of incubation, and that expression of the Glyma17g37990 gene showed no significant changes during incubation. Two aspects could contribute to explain the differences between our results and theirs. First, Sangi et al. (Reference Sangi, Santos, Alexandrino, Da Cunha, Coelho, Ribeiro, Lenz, Ballesteros, Hemerly, Venâncio, Oliveira and Grativol2019) analysed the expression in axes from incubated whole soybean seeds, which complete germination in 24 h, whereas our measurements were carried out on isolated axes, which complete germination in just 12 h. Therefore, germination events and EXP1 expression could be taking place at different rates. Second, expression data before incubation showed great variability, and hence, a significant change of expression for Glyma17g37990 after incubation could have been underestimated by Sangi et al. (Reference Sangi, Santos, Alexandrino, Da Cunha, Coelho, Ribeiro, Lenz, Ballesteros, Hemerly, Venâncio, Oliveira and Grativol2019).
On the other hand, under inhibitory germination conditions in 50 μM ABA, EXP1 was down-regulated (Fig. 5). These results agree with previous studies in M. truncatula (Gimeno-Gilles et al., Reference Gimeno-Gilles, Lelièvre, Viau, Malik-Ghulam, Ricoult, Niebel, Leduc and Limami2009) and C. arientinum (Hernández-Nistal et al., Reference Hernández-Nistal, Martín, Esteban, Dopico and Labrador2010), supporting the hypothesis about the inhibitory role of ABA on soybean germination by controlling one of the first and most important steps of radicle enlargement during germination, cell expansion. Down-regulation of EXP1 levels in the EZ of ABA-treated axes (Fig. 5) could be, therefore, at least partially responsible for preventing the loosening and relaxation of the cell wall in the EZ cells, necessary for axes to take up more water and consequently, elongate. Interestingly, EXP1 expression correlated with germination results during the time window of ABA responsiveness (until 6 h of previous incubation in water), during which ABA suppressed EXP1 expression (Fig. 6) and water uptake (Fig. 3), blocking germination. Instead, neither EXP1 expression (Fig. 6) nor water uptake (Fig. 3) and germination were affected by ABA after 12 h of previous incubation in water. Chiu et al. (Reference Chiu, Pan, Zhao and Gazzarrini2016) demonstrated the existence of a time window of ABA action during A. thaliana seed germination, which was associated with proteasome activity and involved both proteins of gibberellin signalling (DELLA) and ABA signalling transcription factors (ABI3, ABI5 and FUS3), many of which were also found and described in soybean embryonic axes during germination (Bellieny-Rabelo et al., Reference Bellieny-Rabelo, De Oliveira, Da Silva Ribeiro, Pessoa Costa, Oliveira and Venancio2016). These positive regulators of ABA signalling, together with DELLA repressors of gibberellin signalling, may be responsible for inhibiting germination under unfavourable growth conditions, due to ABA-dependent inhibition of proteasome activity (Chiu et al., Reference Chiu, Pan, Zhao and Gazzarrini2016). These results and the evidences of gibberellin and ABA antagonistically controlling soybean embryonic axis germination (Bellieny-Rabelo et al., Reference Bellieny-Rabelo, De Oliveira, Da Silva Ribeiro, Pessoa Costa, Oliveira and Venancio2016) suggest that a similar mechanism might be working in the control of soybean germination. In addition, the results showed that ABA may not only have a transcriptional effect avoiding the novo synthesis of EXP1, but could also affect the accumulation of EXP1 transcripts at least until the first 6 h of water incubation (Fig. 6), thus suggesting a possible post-transcriptional control by ABA, as postulated by Chiu et al. (Reference Chiu, Pan, Zhao and Gazzarrini2016).
Contrary to what happened in the presence of ABA, and although germination was osmotically inhibited by a −1 MPa PEG solution (Fig. 1), EXP1 transcript levels were up-regulated by PEG, with expression being even higher than those in distilled water (Fig. 5). This result supports the hypothesis that ABA and PEG inhibit germination through different mechanisms. Also, after being transferred to distilled water, axes previously incubated in PEG recovered its germination capacity four times faster than those previously incubated in ABA (Fig. 2). In the first case, the EXP1 accumulated during incubation in PEG solution could guarantee the fast response after the transfer, whereas in ABA incubation medium, extra time may be required for reducing ABA at a level compatible with de novo EXP1 synthesis and, consequently, with germination. This delay in germination recovery might reflect the time required for reducing the axes ABA concentration, by leakage and/or catabolism, below its inhibitory threshold (Gosparini et al., Reference Gosparini, Busilacchi, Vernieri and Morandi2007) before germination-promoting transcriptional programmes are fully installed (Bellieny-Rabelo et al., Reference Bellieny-Rabelo, De Oliveira, Da Silva Ribeiro, Pessoa Costa, Oliveira and Venancio2016).
In C. arientinum seeds, Hernández-Nistal et al. (Reference Hernández-Nistal, Martín, Esteban, Dopico and Labrador2010) identified different expansin genes, which were similarly down-regulated when germination was delayed by either ABA or osmotic solutions of mannitol. During germination of tomato seeds, Chen et al. (Reference Chen, Dahal and Bradford2001) found that ABA did not affect the expression of two expansin genes (LeEXP8 and LeEXP10) for the first 24 h of incubation, but both decreased at longer incubation times. In −1 MPa PEG solution, LeEXP8 was blocked from the beginning of incubation, whereas LeEXP10 expression was similar to that in ABA. Thus, although the hormonal control by ABA may be similar among these species, the osmotic control seems not to be as easily predictable. High ABA levels constitute a clear signal for seeds not to germinate because the physiological conditions are not fulfilled. Low osmotic potentials represent the natural environment for developing seeds, and we have demonstrated its contribution to the inhibition of soybean seed precocious germination (Montechiarini, Reference Montechiarini2018). Moreover, in seeds which complete their development within a fleshy fruit such as tomato, low osmotic potential is proposed to play a more important role than ABA in avoiding vivipary (Berry and Bewley, Reference Berry and Bewley1992). Additionally, low osmolarity is a pre-germinative treatment normally used in seed priming, which enhances germination rates and uniformity of plantlets by accelerating seed germination after subsequent rehydration of primed seeds. Molecular studies in A. thaliana (Gallardo et al., Reference Gallardo, Job, Groot, Puype, Demol, Vandekerckhove and Job2001) and Brassica oleracea (Soeda et al., Reference Soeda, Konings, Vorst, van Houwelingen, Stoopen, Maliepaard, Kodde, Bino, Groot and van der Geest2005) showed that the majority of genes whose expression changes during germination are similarly altered during osmo-priming. A similar situation could be taking place with EXP1 induction in soybean axes during both water germination conditions and −1 MPa PEG, which prevented germination. Moreover, the increased EXP1 expression under PEG incubation (Fig. 5) suggests that it could be involved in the faster water uptake by axes and, consequently, for their complete germination in just 3 h after transfer to water when germination conditions were restored. It is not clear, in this context, if EXP1 was actually more highly expressed in PEG than in water, or if those EXP1 transcripts that were not used accumulated due to the expansion restriction.
In summary, we propose that EXP1 expressed in the EZ is involved in soybean axes germination, being induced during the early molecular events defining it. Under germination conditions, EXP1 expression was up-regulated in the EZ as germination progressed. Results of incubation in 50 μM ABA or −1 MPa PEG showed that, although germination was prevented in both cases, different molecular responses seem to be involved. The ABA inhibitory germination effect may be mediated by restriction of cell wall loosening that allows the higher water uptake at the beginning of Phase III, more precisely within a time window of ABA responsiveness until the sixth hour of water incubation. Since ABA is the most important natural regulator of seed germination, then its repressive effect by avoiding one of the initial steps defining germination on soybean appears logical. Regarding EXP1, its expression levels correlated with growth inhibition of embryonic axes during ABA treatments, and even into the time window of ABA responsiveness, with EXP1 being transcriptionally (and probably also post-transcriptionally) down-regulated by ABA. By contrast, when the availability of water is the main germination restriction, as it occurs in −1 MPa PEG, the high EXP1 levels accumulated could allow soybean seeds to be ready for rapid germination as soon as water availability is re-established. Our results provide a better understanding of the initial events occurring in the EZ during soybean germination and identify EXP1 as a candidate target of its control.
Supplementary material
To view supplementary material for this article, please visit : https://doi.org/10.1017/S0960258520000379
Acknowledgements
The authors gratefully acknowledge Dr. Juan José Pierella for his valuable assistance with EXP1 sequence analysis, Aldana Piccotto for technical support with time-lapse videos and Rodrigo Vena for technical support with microscopic observations.
Financial support
This work was supported by the Universidad Nacional de Rosario (AGR237 and AGR310) and the Consejo Nacional de Investigaciones Científicas y Técnicas (PUE 0043).