

Introduction
The first half of the 20th century was a continuous period of calamities and human losses for Ukraine: two World Wars, Civil War, the 1917 October Revolution, terror campaign, epidemics, and three famines (1921–1923, 1932–1933, and 1946–1947). Each of these social disasters deserves careful study.
Researching famines demands a specific approach because it begs the questions of why it happened and what did the government do to prevent it. In Ukrainian historiography and demographics specifically, the Holodomor of 1932–1933 is the famine that has been most researched. Although the number of publications number in the tens of thousands, this topic still attracts the attention of scholars. The two other famines have been less frequently investigated. Although they were not as devastating for Ukraine as the Holodomor, the causes of their emergence, the peculiarities of their course, and the consequences to which they led need to be studied and examined. The purpose of this study is to explore the preconditions, causes, and consequences of the 1921–1923 famine and compare it with the Holodomor.
Historiography of the 1921–1923 Famine
Domestic and foreign historiography of the problems of this famine encompasses the analysis of political and socio-economic factors of the famine. The problem of estimating population losses during the 1921–1923 famine, on the other hand, has received much less attention. While the estimation of Holodomor losses includes dozens of attempts, there are only about ten different estimates of 1921–1923 famine losses. One of the best approaches to estimating these losses is by Tomilin (Reference Tomilin1924, 13–34, 50–61). The publication is one of the most comprehensive sanitary and demographic surveys organized by the founders of Ukrainian social hygiene and medical demographics Marzeyev and Tomilin, conducted in 1923. The number of people killed by the 1921–1923 famine is based on three causes of death: “died of sickness,” “died of hunger,” or “died of infection.” If the results from the survey are extrapolated to the entire population of Soviet Ukraine, the direct population losses would amount to 700,000–800,000 people.
Several authors attempted to estimate morbidity and population losses of the 1921–1923 famine in Soviet Ukraine (Dramarets’kiy Reference Dramarets’kiy1997; Kirilenko Reference Kirilenko2015; Kulchytskiy and Movchan Reference Kulchytskyi and Movchan1993; Movchan Reference Movchan1985, Reference Movchan1991; Veselova, Marochko, and Movchan Reference Veselova, Marochko and Movchan2008). The estimates of population losses vary between 300,000 and one million. This wide range shows that the estimation of 1921–1923 famine losses needs further elaboration.
Russian historian Andris Kristkaln estimated in close to 5 million the losses in the 1921–1923 famine in former USSR territory (Kristkaln Reference Kristkaln1997). French demographer Sergey Adamets studied the sanitary-epidemiological situation in the former Soviet Union. He estimated 5.9 million losses for the whole Soviet Union, with 2.7 million due to epidemics and 3.2 million due to famine (Adamets Reference Adamets2003, 277). At that time, the population of Soviet Ukraine made up 19 percent of the population of the Soviet Union. If we apply this percentage of Adamets’ estimates to Ukraine, we have a total of 1.1 million losses, with 500,000 due to epidemics and 600,000 due to hunger.
Data and Methodology for Estimating Famine Losses
Estimation of population losses during social disasters in the former USSR, based on clearly defined demographic principles, is now a priority in historical and demographic research. It is based on the method of population reconstruction. This method allows one to disaggregate these losses by gender, age, and urban-rural areas by the national, oblast, and raion levels. It has been used to estimate Holodomor losses (Mesle and Vallin Reference Meslé and Vallin2012; Rudnytskyi et al. Reference Rudnytskyi, Levchuk, Wolowyna, Shevchuk and Kovbasiuk2015a; Rudnytskyi et al. Reference Rudnytskyi, Levchuk, Wolowyna, Shevchuk, Curran, Luciuk and Newby2015b; Levchuk et al. Reference Levchuk, Boriak, Wolowyna, Rudnits’kiy and Kovbasyuk2015; Wolowyna et al. Reference Wolowyna, Plokhy, Levchuk, Rudnytskyi, Kovbasiuk and Shevchuk2016). In order to make a valid comparative analysis, we need to apply it to estimate the 1921–1923 famine losses.
First, we must provide an exact definition of famine losses. Demographers define two types of losses: direct losses or excess deaths; and indirect losses or lost births. They are defined as the difference between the number of actual deaths during the famine period and the number of hypothetical deaths had there been no famine. The actual number of deaths is provided by the population reconstruction; estimation of the hypothetical number of deaths is based on interpolated crude death rates between before and after the famine. We will address here only direct losses and refer to them from now on as losses or excess deaths.
The population reconstruction needed for estimating losses of the 1921–1923 famine consists in the estimation of the yearly population dynamics between the 1920 and 1926 census years, such as population, births, deaths, and net migration. The following data were used for the population reconstruction: (1) 1920 and 1926 population censuses (CSA UkrSRR 1922, CSA USSR 1926, CSA USSR 1975, and CANER USSR) and the 1923 urban census (CSA USSR 1926 and CSA USSR 1975); (2) yearly birth and death registrations (CSASPAU); and (3) migration data (CANER USSR).
Before attempting the population reconstruction, it is important to evaluate the quality of the data and make appropriate adjustments. The 1920 census was corrected by applying the undercount factors estimated by Ukrainian demographer Khomenko (Reference Khomenko1924): 2–3 percent for urban and 5–7 percent for rural areas, depending on the gubernia. The 1926 census was adjusted applying to the civilian population the correction factors estimated by the Ukrainian demographer Korchak-Chepurkivskyi (Reference Korchak-Chepurkivskyi1928)—0.6 percent for urban and 0.9 percent for rural areas—and adding the estimated urban and rural armed forces (Rudnytskyi et al. Reference Rudnytskyi, Levchuk, Wolowyna, Shevchuk and Kovbasiuk2015a). The 1923 urban census was used to estimate more exactly the urban population on January 1, 1935.
Yearly registered birth and deaths were corrected for underregistration separately for the 1921–1923 famine years and the 1924–1926 period. For the famine years, births were adjusted by 10–20 percent and deaths by 25–50 percent, depending on the year, based on data from the 1923 epidemiological survey of the rural population (Tomilin Reference Tomilin1924). For the other years, births were adjusted by two percent for urban areas and three percent for rural areas; adjustments for deaths were ten and 15 percent, respectively (Korchak-Chepurkivskyi Reference Korchak-Chepurkivskyi1929; CSASPAU). Migration was estimated using the following data from the 1926 census: place of birth and duration of residence if not residing at place of birth.
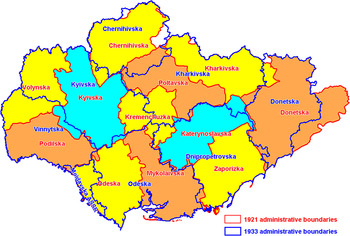
Estimation of 1921–1923 famine losses requires yearly population reconstruction for the 1920–1926 intercensal period, while estimation of Holodomor losses requires yearly population reconstruction for the 1926–1939 intercensal period. As the administrative structure of Soviet Ukraine was different during 1920–1926 than during 1926–1939, changing several times during both periods, it was necessary to select a common administrative structure for the 1921–1939 period encompassing both famines. The standard structure adopted for the Holodomor analysis was the administrative structure in 1932 of seven oblasts (Vinnytsia, Dnipropetrovsk, Kyiv, Donetsk, Odesa, Kharkiv, and Chernihiv) and the Moldovan ASSR. For comparative purposes, we also adopt the 1932 administrative structure for the estimation of 1921–1923 losses. All the yearly demographic parameters (population, births, deaths, and migration) of the 1921–1926 period were re-calculated to conform to this structure. This was done by comparing detailed maps for different years and constructing transition coefficients from the 1920 structure of 12 gubernias—Volyn, Podilla, Kyiv, Chernihiv, Odesa, Mykolaiv, Katerynoslav, Kremenchuk, Poltava, Kharkiv, Zaporizha, and Donetsk—to the eight regions (seven oblasts and the Moldova ASSR) in 1932. Figure 1 shows the correspondence between these two administrative structures.
Administrative structure of Ukraine in 1921 and 1933. Source: compiled by the authors.

The next step was to calculate the yearly population balances for the 1920–1926 period—consisting of yearly population, births, deaths, and net migration—for urban and rural areas of the eight 1932 regions. First, the adjusted 1920 census population was projected forward to January 1, 1921. Then, starting with this population, the January 1, 1922 population was obtained by adding the number of 1921 births, subtracting the number of 1921 deaths and adding the 1921 number of net migrants. A recurrent application of this formula gives the populations for successive years. The corresponding hypothetical populations for 1921–1923, assuming there had been no famine, were estimated based on linear interpolations of crude birth and death rates between 1897 and 1926. These two years were chosen assuming that they represent “normal” demographic conditions, such as not being affected by wars and the 1921–1923 famine. Direct losses for 1921–1923 are calculated as the difference between the numbers of reconstructed and hypothetical deaths.
A similar methodology was applied to estimate Holodomor losses. Data used were: (1) 1926, 1937, and 1939 censuses and 1931 urban count; (2) yearly birth and death registrations; (3) migration data; and (4) urban-rural reclassification. The 1937 census required minor adjustments, while the results of the 1939 census were falsified and required major adjustments.
Due to the severity of the Holodomor resulting in very high underregistration of births and deaths during the famine years, especially in 1933, a complex adjustment methodology was developed. The estimation of Holodomor losses is described in detail in Rudnytskyi et al. (Reference Rudnytskyi, Levchuk, Wolowyna, Shevchuk, Curran, Luciuk and Newby2015b) and Wolowyna (Reference Wolowyna, Plokhy, Levchuk, Rudnytskyi, Kovbasiuk and Shevchuk2016). A more detailed description of the data and methodology for both famines is presented in the Appendix of the online version of this article.
Discussion
Prerequisites, Causes, and Consequences of the 1921–1923 Famine
The famine of 1921–1923 in Ukraine was caused by an extreme drought and exacerbated by the economic ruin caused by seven years of war (World War I and the independence wars). However, the Ukrainian famine in the early 1920s was extremely destructive not only because of these objective reasons but also because of the policy of the central Russian government. When distributing scanty grain supplies, the Kremlin gave preference to the “red capitals” of Petrograd, Moscow, and the Volga region, neglecting the needs of starving peasants south of Ukraine. In order to justify taking grain from the productive central and northern provinces of Ukraine, the leadership of Soviet Ukraine was forbidden to admit that the situation in the southern oblasts wasn’t better than in the Volga region. International aid organizations started their work in the starving Volga region in August of 1921 and were permitted to work in the southern oblasts of Ukraine only in January 1922, after mass mortality had already begun there.
The general political and economic situation worsened in the Soviet Union in 1921. The spring weather conditions in the southern oblasts of Ukraine deteriorated, the success of the future harvest was imperiled, and the peasants did not want to give their crop to the state. Thus, the situation with grain procurement became catastrophic. The production tax for the harvest of 1921 was approved in the amount of 1.9 million tons.Footnote 1 The debt of 0.9 million tons from the harvest of 1920 was added to the 1921 tax, resulting in a total of 2.8 million tons (Zbirnyk zakoniv 1921). The grain procurement was unsatisfactory. For example, local authorities managed to send only 50,000 tons of grain to the “red capitals” from January to July 1921 (Kulchytskyi Reference Kulchytskyi1996, 192–195).
The Kremlin made its first attempts to export grain in autumn of 1922. At that time, about two million children were starving in the southern provinces of Ukraine, of whom only half benefited from charitable international organizations. As a result, the famine in Ukraine continued in the first half of 1923, while it ceased in the Volga region by the end of 1921 (Veselova, Marochko, and Movchan Reference Veselova, Marochko and Movchan2008).
A characteristic feature of the communist regime was the Kremlin policy of forced propagation of communist socialism. Using the revolutionary Marxism slogans of the Manifesto of the Communist Party (1848) by Karl Marx and Friedrich Engels, Bolshevik leaders made an attempt in 1918–1920 to concentrate private ownership as the means of production used by members of society into the hands of the state-commune, and thus supplement the political dictatorship established after the October Revolution of 1917 by an economic one. With the support of workers and peasants, they managed to expropriate the property of landlords, factory owners, and bankers. However, small producers and small farmers also did not fit into the society created by the Russian Communists. By commenting on their fate, Lenin emphasized: “The main issue of the revolution is now the struggle against these two latter classes (small producers and small farmers). In order to get rid of them, it is necessary to apply other methods than the struggle against big landowners and capitalists” (Lenin Reference Lenin1974). Hence, other methods had to be found to get rid of small producers and grain farmers.
The direct attack on the peasant’s means of production, as well as the Bolshevik attempt to abandon the “black redistribution” of private arable land, ended in failure.Footnote 2 In particular, the propagation of state farms and communes in Ukraine in 1919 caused a huge surge of peasant resistance, which affected mostly the peasant Red Army and led to the lightning-fast occupation of the Ukrainian Republic by Denikin’s army. Having defeated the communization of peasantry, the Bolsheviks applied the production tax policy, namely confiscation of products produced in agriculture, from 1919–1920. The production tax led to the collapse of the national economy.
In an attempt to overcome the economic crisis, in 1921 Lenin abandoned the idea of complete expropriation of food in 1921 and replaced it with a direct state distribution of material goods. For almost a decade, the new economic policy stopped the communist assault that was being carried out by force.
We now turn our attention to the description of the starvation caused by the drought in 1921. It should be noted that the number of drought-induced human victims increased due to the Kremlin’s policy and decreased due to the support given to the starving southern provinces of Ukraine with domestic resources and foreign assistance.
The drought of 1921 destroyed crops in several regions of commodity farming in Russia and Ukraine: South-eastern Ukraine, North Caucasus, and the Volga region. The Kremlin didn’t conceal this famine and even responded positively when international organizations offered food aid. Starting in August 20, 1921, a charitable action of the American Relief Administration (ARA) was launched in the Volga region. This organization was created to distribute the food that was imported to Europe after the United States entered WW I and remained unused after the combat operations ended. Later, the mission of Fjord Nansen and the Workers International Relief (WIR), created on the initiative of the Kremlin, joined the ARA.
Moscow did not give permission to spread information about the famine in the southern provinces of Ukraine, although it was no less real than in the Volga region. The information blockade about the famine in the southern provinces of Ukraine, combined with extensive information sharing about the famine in the Volga region, laid the foundation for the identification of the famine of 1921 with the Volga region. Meanwhile, the situation in Ukraine was much worse because even the food aid coming from other countries through the Black Sea ports was channeled to the Volga region. The ARA campaign unfolded in the Volga region in August 1921. Only in January 1922 was Kh. Rakovkyi, head of the Council of People’s Commissars of the Ukrainian SSR, allowed to seek help from international organizations.
Why did the central government in Moscow care for the suffering of the Volga peasants but surround Ukrainian peasants with an information blockade? Volga peasants were loyal and the Ukrainian ones actively opposed the authorities, same as they did in 1920. Under extreme conditions of starvation, the political activity of “kulaks banditry” in southern Ukraine died down.
On August 4, 1921, following instructions sent from Moscow, the Politburo of the Central Committee of the Communist Party (Bolshevik) of Ukraine adopted the resolution “on the campaign against famine,” which is self-explanatory: “Instruct the Province Committees to distinguish during the campaign between the call for the fight against famine in Russia and fighting crop failure in Ukraine, where assistance to areas affected by crop failure can be entirely provided by local provincial or raion resources” (Kulchytskyi Reference Kulchytskyi1993, 31). Grain procurement in the starving provinces of Ukraine continued as before. On August 12, the Council of Labor and Defense—under Lenin’s dictation—adopted a resolution on taking emergency measures in southern Ukraine when collecting the production tax. It consisted of bringing military units into raion and villages which resisted the representatives of People’s Commissariat of Food Industry. Those units had to “take the most decisive measures of coercion” when collecting the production tax (Kulchytskyi Reference Kulchytskyi1993, 32). The essence of the “most decisive measures” can be understood from the instructions to the Voznesensk raion special committee of November 15, 1921: “Take from 15 to 25 men as hostages of the kulaks and middle-class peasants in each volost. In the event that any village refuses to sign the agreement of collective responsibility or, if the agreement is signed but the production tax is not fulfilled within 48 hours, such villages will be declared enemies of the Soviet power. Half of the hostages should be sentenced up to the highest penalty—shooting, after which the next group will be taken. All grain, regardless of production tax, will be confiscated” (Kulchytskyi Reference Kulchytskyi1993, 51).
Functionaries in the Kremlin realized that famine suppressed the insurgents more effectively than punitive measures, thereby helping to cope with the “kulak banditry.” They confiscated the meagre food reserves even among the peasants of the Southern provinces.
The Central Committee for the Relief of Starvation was created both in Ukraine and Russia in July 1921. However, it did not help the starving Ukrainians—the number of which was increasing each month—but helped the Volga peasants instead. Volga peasants left the territories affected by the drought and walked to other regions (railways were paralyzed); about 439,000 refugees were granted asylum in Ukraine (Kulchytskyi Reference Kulchytskyi2013, 59).
Only when the insurgent movement in southern Ukraine was oppressed and mass mortality began in villages, the Bolshevik leadership recognized this region as a starving one and allowed international organizations to provide food aid to them. The aid lasted from March 1922 to June 1923 and saved hundreds of thousands of lives. The International Labor Relief provided 383,000 rations during this period, the Nansen Mission supplied 12.2 million rations, and ARA supplied 180.9 million rations (Fisher Reference Fisher1971; Kulchytskyi Reference Kulchytskyi1996).
In 1922, the number of cultivated hectares in Ukraine was 2.9 million less than the previous year. Huge shortages in sowing in the southern provinces were compensated, albeit not entirely, by the increase in sown areas in other provinces. But the Republic had to allocate more than 163.8 thousand tons of grain from the harvest of 1922 for export (AUCEC 1924). This was a small amount, but it could have quite a few starving people. However, the central government ordered the Ukrainian leaders to restart the export of grain interrupted by the war, in order to obtain foreign currency. Export of grain and supplies to Russia led to the famine lasting in Ukraine throughout 1922 and into early 1923.
The Scale and Geography of the Famine of 1921–1923
The poor 1921 harvest in southeastern Ukraine (steppe zone) resulted in a critical situation for both grain and fodder. The harvest was insufficient for the needs of the population in this part of Ukraine. Figure 2 shows the net amount of grain collected from the 1921 harvest, in terms of average amount of grain per person. An acceptable yearly consumption rate — including feeding domestic animals — was at least 327—410 kg per capita. This amount of grain was supposed to be enough to feed the people and farm animals until the next harvest, as well as pay the government tax.
Actual grain collected from the 1921 harvest in Ukraine by raion in kg. per rural person. Source: Gurevich 1922.

At that time, Ukraine was divided into 97 raions. In 22 raions, peasants had no grain left for personal consumption and had to survive on other food stuff. In ten raions, the net amount of grains was between 1 and 83 kg per person. In 23 raions, the net amount was between 84 and 165 kg per person. In 18 raions, the net amount was between 166 and 245 kg per person. In the remaining 24 raions, it was more than 246 kg per person. Thus, the situation in these 24 raions was not that critical, while in the 22 southeastern raions—with no grain collected—the situation was extremely critical (Gurevich Reference Gurevich1922, 30).
The famine in Ukraine covered an area of 170,700 square kilometers, which is 42.7% of the whole territory of Ukraine with 8.4 million inhabitants and 31.5% of the total population (Danilov Reference Danilov2001, 440–441).
The grain deficit in the gubernias with no harvest was close to 400 thousand tons; this deficit could have been covered by grain from Ukrainian gubernias with a relatively good harvest. This did not happen because the Soviet regime prioritized food supplies to industrial regions in Russia and famine areas of Lower Volga, not peasants in southern Ukraine. Also, 432 thousand tons of grain were shipped from Ukraine to Russia during 1921–1922 (Lazarovych and Lazarovych Reference Lazarovych and Lazarovych2012).
Lack of grain and other food supplies from the 1921 harvest resulted in starvation in autumn of 1921. The number of the starving was increasing steadily. By the beginning of May 1922, 3.7 million people were starving in five gubernias of Ukraine, about 35% of the total population of those gubernias. The number of people in need reached 6.6 million throughout Ukraine, 40% of them children (Lytvyn Reference Lytvyn2003). Government food assistance was provided to, at most, 7.5 percent of the starving people in Ukraine, while close to 80% of the starving population in the Russian Federation received food at government food distribution centers.
By August 1, 1922, 425,000 starving persons received food aid from the hunger fund in Ukraine and 1.8 million more received food assistance from foreign charitable organizations (Territory of Terror).
Sanitary and Epidemiological Situation
The extreme hunger situation was made even worse by catastrophic epidemiological, medical, and sanitary conditions in southern Ukraine. Malnutrition caused deficits in proteins, fats, carbohydrates, and vitamins, resulting in lower immunity and heightening vulnerability to disruptive external factors. Many deaths were due to diseases caused by malnutrition.
Between January and May 1922, about 300,000 persons got sick due to malnutrition in southern Ukraine. By august, this number increased to 500,000 (Kirilenko Reference Kirilenko2015, 131–132). Extreme hunger caused increased prevalence of infectious diseases and much higher mortality rates compared to normal times.
The sanitary and epidemiological situation was already unsatisfactory before the First World War and became worse during the war. Yet, there were no widespread epidemics in Ukraine before 1918. The influx of large numbers of refugees and war prisoners after the war produced a decrease in immunity among the population and provided a favorable environment for epidemics.
Nutritional deficits, unsanitary housing conditions, and the fight for survival during late 1910s worsened the sanitary and epidemiological situation. A flu epidemic caused more than one million deaths in 1918–1919. An epidemic of parasitic typhus infected more than three million persons in 1920, resulting in more than 300,000 deaths (Ul′yanov Reference Ul′yanov and Kahan1938, 67– 68).
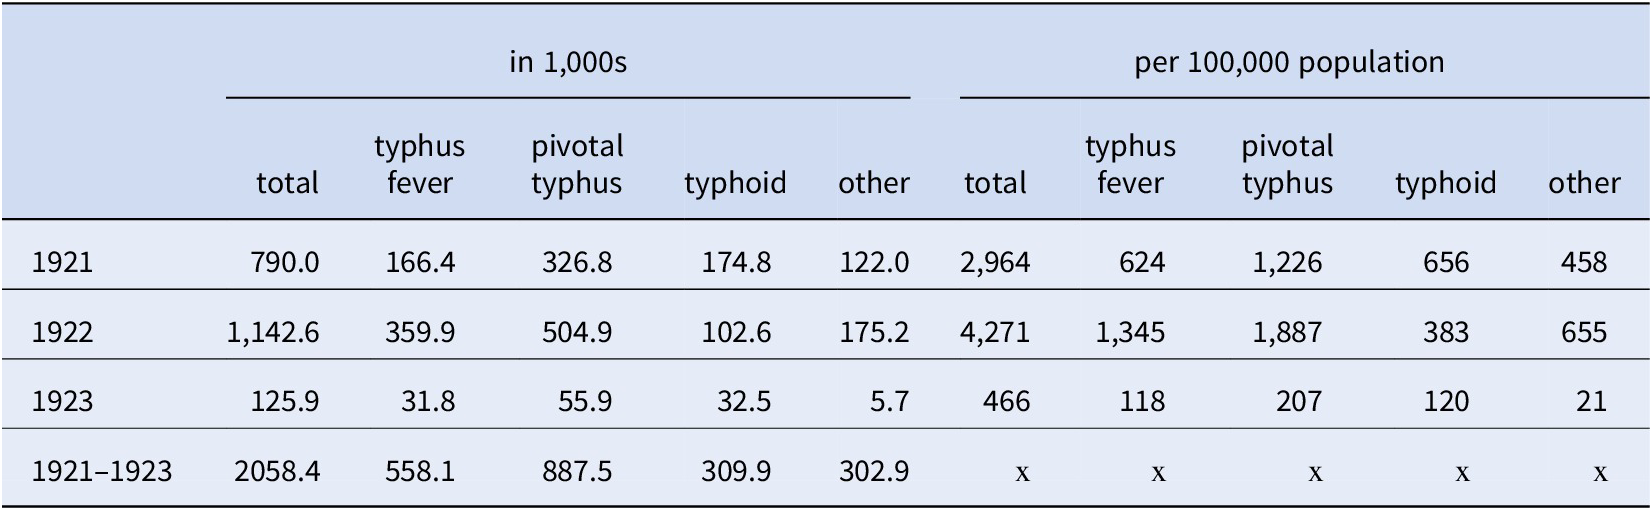
Thus, famine was among the main factors responsible for the catastrophic increase in mortality. Widespread epidemics of infectious diseases occurred during the famine years and three types of typhus were the most prevalent infectious disease from 1921–1923 (Table 1).
Yearly numbers of cases of infectious diseases, 1921–1923.

Source: PCH UkrSSR 1922, 846–848; PCH UkrSSR 1927; PCH UkrSSR 1929, 3–9; Tomilin Reference Tomilin1924, 13–34, 50–61; Ul′yanov Reference Ul′yanov and Kahan1938, 43–75.
If we add 72,100 cases of undefined typhus included in the category “other” to the three types of typhus, all types of typhus comprised 88.7 percent of all cases of infectious diseases during the 1921–1923 period. Dysentery and cholera were also prevalent, with 125,000 and 58,500 cases (or 6.1 and 2.8 percent) respectively.
Infectious diseases, together with war and famine, played a crucial role in increasing mortality rates and significantly influenced the number of direct losses during the 1921–1923 famine. These three factors increased the crude mortality rate by 50 percent between 1911–1913 and 1921–1923, from 23 deaths per thousand to 35 deaths per thousand.
Analysis of Results
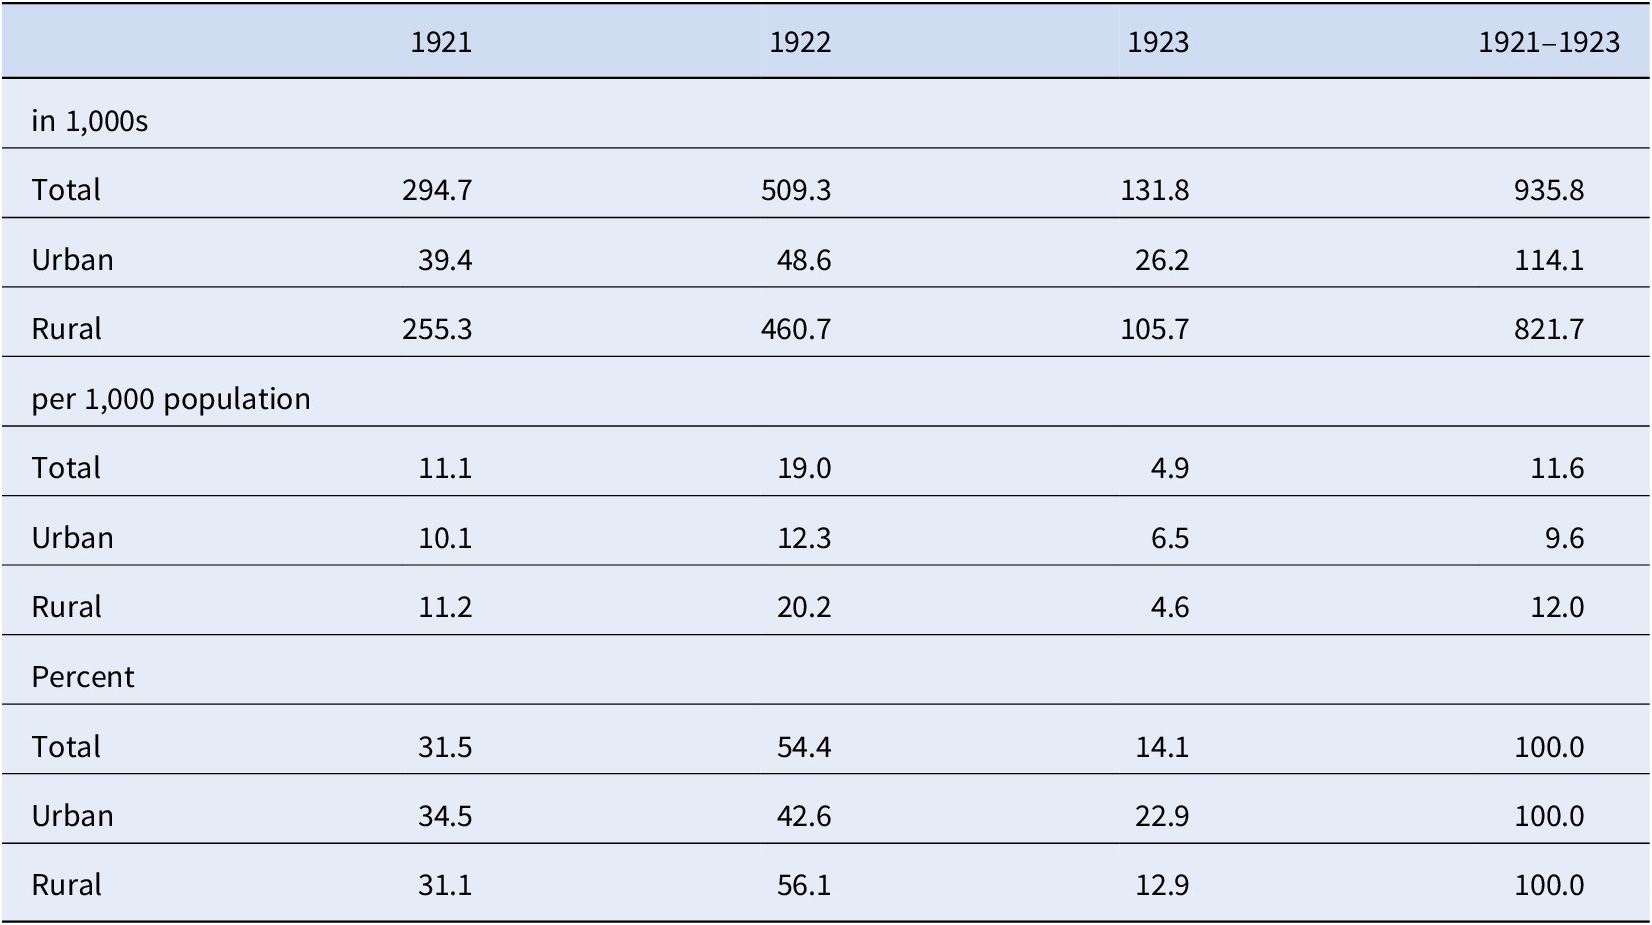
Losses for 1921–1923 are estimated around 935,800. They are unevenly distributed over the years with 54.4 percent in 1922, 31.5 percent in 1921, and 14.1 percent in 1923, the peak of the famine being in 1922 (Table 2).
Yearly losses by urban and rural areas: Ukraine, 1921–1923.

Source: Author's calculations.
Losses in rural areas were 821,700 (87.8 percent of the total number of losses) for the three-year period, while losses in urban areas were 114,100, 7.2 times smaller than the number of rural losses. Yearly rural-urban loss differentials varied from year to year. Losses in the peak 1922 year were 12.3 per 1,000 population in urban areas and 20.2 per 1,000 in rural areas. Relative losses (per 1,000 population) were higher in 1921 than in 1923 in both urban and rural areas: for urban areas, 10.1 in 1921 and 6.5 in 1923; for rural areas, 11.2 in 1921 and 4.6 in 1923. Thus, the distribution of losses in rural areas during 1921–1923 was characterized by earlier effects of the famine and a maximum concentration of excess mortality in 1922, while in cities the peak of starvation in 1922 were less distinct and the distribution of losses over the years was more even. This situation in cities is explained by the fact that food aid programs favored urban residents. In addition, a card system of food rations was introduced in many cities.
Male losses were higher than female losses in both absolute and relative terms. There were 555,900 male excess deaths and 379,900 female excess deaths during 1921–1923, or 59.4 and 40.6 percent of all losses, respectively. In relative terms, 1922 losses were 23.4 per 1,000 for males and 14.9 per 1,000 for females. There are at least two reasons for the higher male losses. First, there is the physiological property that males experience a higher energy consumption rate than females. Second, males are more engaged in physical labor with more intensive energy consumption. This makes them more vulnerable to the effects of malnutrition.
It is instructive to examine the monthly distribution of urban and rural relative losses in the peak year of 1922 (the methodology used for calculating monthly losses is described in Wolowyna Reference Wolowyna, Antonovych, Boriak, Gladun and Kulchytskyi2013). There was a significant increase in rural monthly relative losses during the first five months of 1922, from 14.1 per 1,000 in January to 30.4 per 1,000 in May, or 2.2 times increase. Then, numbers gradually decrease to a low of 10.4 per 1,000 in December (Figure 3). Another measure of this concentration is the fact that 66 percent of rural excess deaths occurred between March and August.
Monthly urban and rural losses per 1,000 population: Ukraine, 1922.Source: Author’s calculations.

The monthly pattern of urban relative losses is similar to the rural pattern but with some differences. First, the higher urban monthly losses were March and April with an almost stable rate of 19.5 per 1,000, while the rural rates had a steady increase during these months. Second, the monthly increase of relative mortality in urban areas occurred earlier than in rural areas. Urban excess deaths are concentrated in the February–July period (71.3 percent), compared to the rural Marth to August period (66 percent). The overall pattern of steady increases in excess deaths during the first half of the year and steady decreases during the second half of the year is related to the agricultural seasonal cycle, when the new harvest produces the necessary food to feed the population.
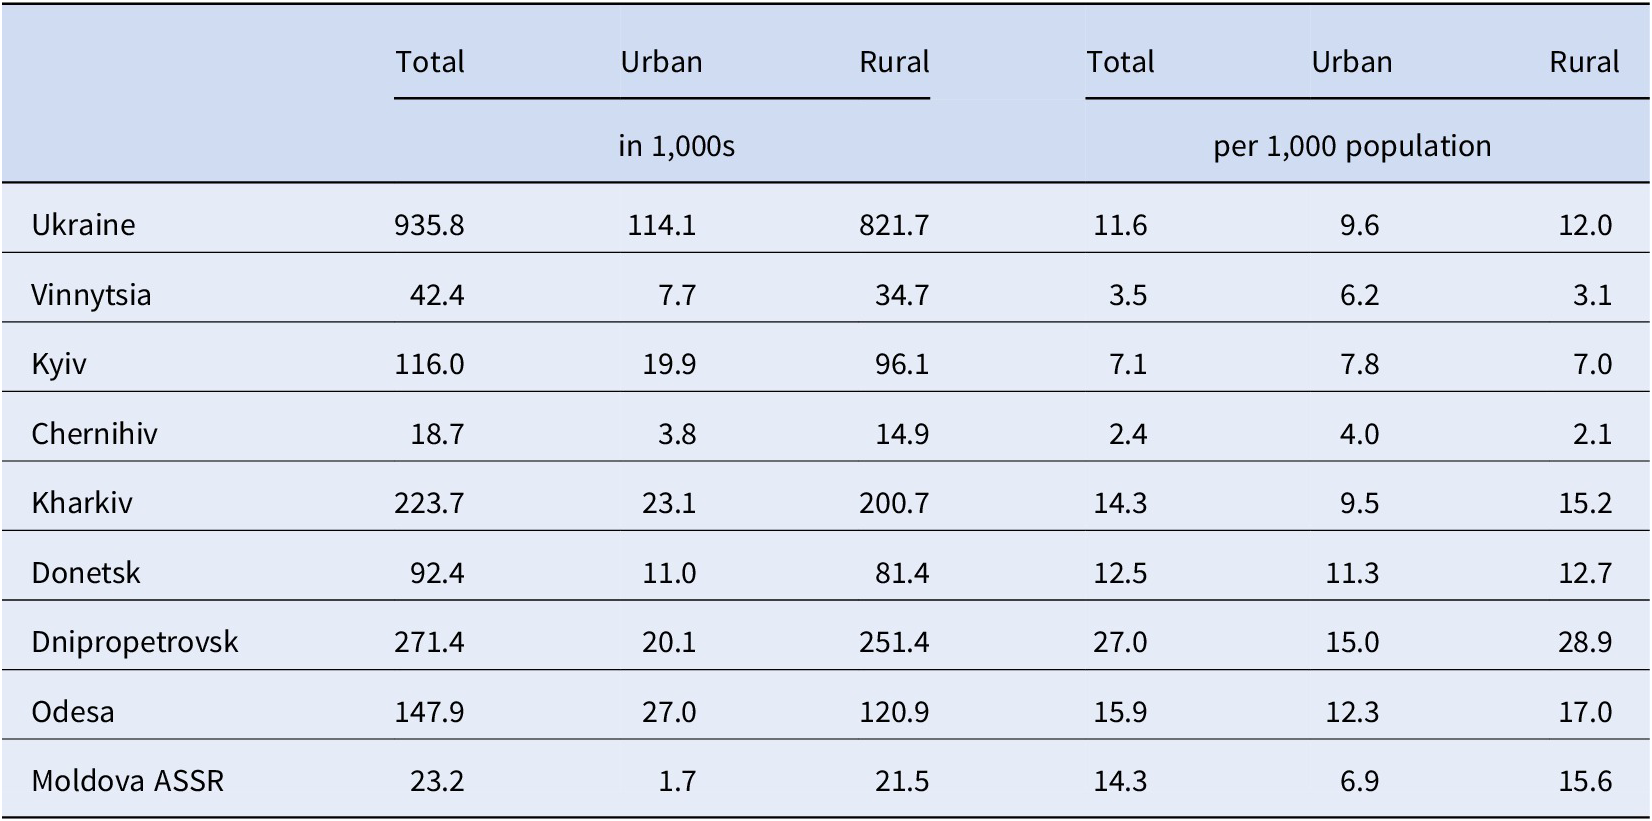
There are significant variations in the level of relative losses among oblasts. The largest total relative losses were in Dnipropetrovsk (27.0 per 1,000), Odesa (15.9 per 1,000), Moldavian ASSR (14.3 per 1,000), Kharkiv (14.3 per 1,000) and Donetsk oblasts (12.5 per 1,000). Excess deaths in Vinnytsia, Kyiv, and Chernihiv, in which the harvests were better, were significantly lower (Table 3).
Losses by oblasts and urban-rural populations: Ukraine, 1921–1923.

Source: Author’s calculations.
Rural losses for the 1921–1923 period make up 87.8 percent of all losses. Among oblasts, this varies between 79.7 percent in Chernihiv and 92.7 percent in the Moldova ASSR. This variation among oblasts is much larger in relative terms (losses per 1,000 population) and there is a distinct rural-urban pattern. Rural relative losses are higher than urban relative losses in the five oblasts with poor harvest (Kharkiv, Donetsk, Dnipropetrovsk, Odesa, and Moldova ASSR), while the opposite relationship holds for the three oblasts with fair harvest.
Taking the Donbas oblast as standard, for every 100 urban losses in Donetsk oblast, the number of rural losses in Donbas was 112. These relationships of rural losses in the three oblasts and Moldova ASSR with poor harvests were 138 in Odesa, 160 in Kharkiv, 193 in Dnipropetrovsk, and 226 in Moldova ASSR. For the other three oblasts, these relationships were 50 for Vinnytsia, 53 for Chernihiv, and 90 for Kyiv. Beside the harvest factor, there is another reason for these differences. Infectious diseases played a more important role in excess deaths in oblasts with a better harvest and were more prevalent in urban areas of these oblasts (Tables 4 and 5).
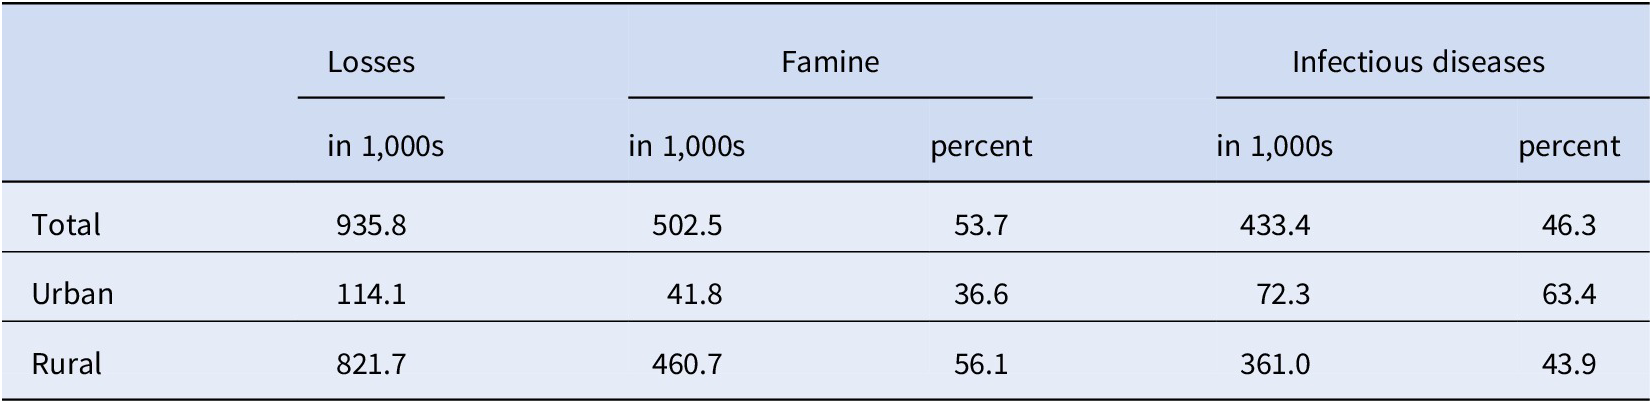
Number of losses by cause of death, famine or infectious diseases, by urban and rural areas: Ukraine, 1921–1923.

Source: Author’s calculations.
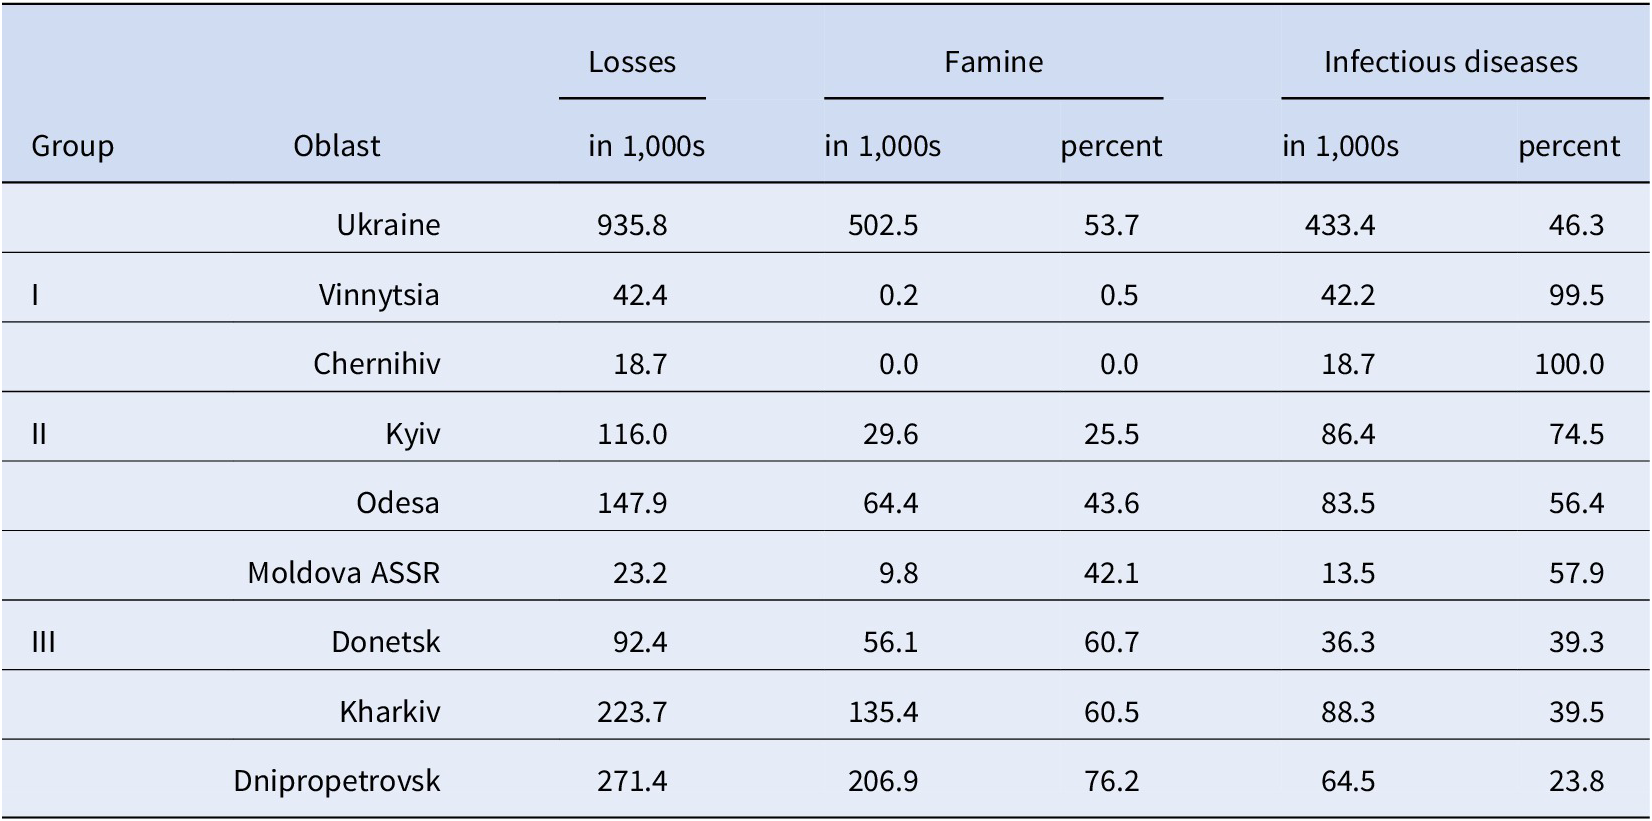
Losses due to famine and infectious diseases by oblast: Ukraine, 1921–1923.

Source: Author’s calculations.
In general, famine provides a link between wars and epidemics. War weakens the agricultural sector and this leads to famine and epidemics. These three factors have cumulative and separate effects on the demographic dynamics of a population. During the crisis period starting in early 1920, the famine in Ukraine had a specific structure: war, grain requisitions, then hunger and epidemics. Excess deaths during the 1921–1923 famine were caused by a combination of starvation and epidemics. Available data allows us to disaggregate total losses into caused by famine and by infectious diseases (Table 4).
Overall, the total number of 935,800 losses can be disaggregated into 502,100 (or 53.7 percent) caused by famine and 433,400 (or 46.3 percent) caused by infectious diseases. In urban areas 36.6 percent of all losses were caused by famine and 63.4 percent by infectious diseases; in rural areas the percentages are 56.1 and 43.9, respectively. In our opinion, the higher percent of excess deaths in urban areas than in rural areas is due the higher concentration of population in urban areas, facilitating the spread of infectious diseases.
Table 5 presents the distribution of losses due to famine and infectious diseases by oblasts.
The seven oblasts and the Moldova ASSR can be divided into three groups. The first group includes two oblasts (Vinnytsia and Chernihiv), where practically all excess deaths were caused by infectious diseases. The second group includes Kyiv and Odesa oblasts and the Moldova ASSR, where losses from infectious diseases varies between 56 percent and 75 percent. Losses in Kharkiv, Donetsk, and Dnipropetrovsk oblasts vary between 24.0 percent and 39.5 percent.
Excess deaths during the 1921–1923 famine were determined by hunger and infectious diseases, but hunger was the key factor in the extent and intensity of infectious diseases. Thus, we consider deaths by infectious diseases as an integral part of deaths caused by starvation.
Prerequisites, Causes, and Consequences of the Holodomor of 1932–1933
In the late 1920s, Stalin focused again his attention on the peasants. Forced collectivization of agriculture began in 1928—accompanied by the production tax—and lasted for three years. This policy exhausted productive labor in rural areas and led to the All-Union famine of 1932–1933. The mechanism of this famine was simple. Both peasants in collective farms and independent farmers reacted equally to the confiscatory nature of the production tax. They stopped being conscientious in their work. Indeed, there was no need to work hard as the state took all the harvest anyway, leaving the grain farmers starving. Every year the state received less grain in terms of procurement and therefore took an increasing portion of the harvest from the peasants. As a result, the famine spread in both rural and urban areas.
While the Kremlin’s procurement policy based on the grain production tax was the same in 1918–1920 and 1930–1932, the specific conditions of agriculture were considerably different during these periods. During the first period, the productive forces in rural areas were undermined by continuous wars on the territory of Ukraine from 1914 to 1920. Then, the southern oblasts of Ukraine were struck by the terrible drought of 1921. However, by the early 1930s, the agricultural situation was quite good. Productive forces in rural areas had been completely restored during the NEP (New Economic Policy) years and the weather conditions of 1930–1932 were more favorable than in the 1920s.
The mechanism of the All-Union famine of 1932–1933, including the 1932 famine in Ukraine was caused by three years of the production tax. But the Holodomor in Ukraine was the result of well-calculated and well-disguised actions of Stalin’s criminal administrators and had little to do with grain procurements.
While being identical in its mechanism to the All-Union hunger, the famine of 1932 in Ukraine still had its own distinctiveness. The grain procurement statistics show that in 1931 four regions of commodity farming (Central Black Earth Region, Northern Caucasus, Middle Volga, and Lower Volga Regions) gave 6,780 thousand tons of grain to the state, while Ukraine gave 6,491 thousand tons. In 1932, those four regions gave 5,734 thousand tons of grain, while the exhausted Ukraine gave only 3,584 thousand tons (Davies and Wheatcroft Reference Davies and Wheatcroft2004, 478). In 1932, the economic ruin of the Ukrainian villages became so evident that the state had to reduce the grain procurement plan significantly and make incredible efforts to implement it, denying the peasants a single grain.
In order to understand why Ukraine was charged with greater obligations on grain procurement than the Russian regions of commodity farming, we should recall the course of the sweeping collectivization in 1930–1932. There was fierce resistance to collectivization in Ukraine. In 1930, 4,098 peasant riots were registered in the Republic, 1,373 riots in the Central Black Earth Region, 1,061 riots in the North Caucasus, and 1,003 riots in the Lower Volga region (Danilov and Berelowitch Reference Danilov and Berelowitch1994). Grain requisitions became the weapon that was supposed to curb the rebels.
In a report of the chairman of the Ukrainian state security organs Stanislav Redens sent to the Secretary General of the Communist Party (Bolshevik) of Ukraine Stanislav Kosior on November 22, 1932, he stated that a forestry official Sosnovskyi told the peasants in the village of Vepryk of the Fastiv raion in Kyiv oblast: “The RSFSR is a completely different republic, peasants there have grain and the like, just as we had before, but Ukraine is so depleted, that we can’t do anything but run away” (Bogunov Reference Bogunov2007, 259). In early September 1932, a scientist of the All-Ukrainian Academy of Sciences Denysenko asked his colleague, who went to Moscow to work on archives, to tell their teacher Hrushevskyi the following: “Concerning the political situation, tell him that a real famine prevails in Ukraine, whole villages and raions are vanishing, and especially emphasize the terrible mortality among children. Explain to him that this is a policy aimed at breaking the Ukrainian nation completely as the only national force capable of serious resistance. Some will die, others will be scattered over the boundless expanses of Russia” (Bogunov Reference Bogunov2007, 291).
The terror by famine was tested in Ukraine in 1921. Bolshevik leaders realized that starving generated spontaneous and generalized protests by unorganized peasant masses, while absolute famine, namely the absence of any sources of food, reduced the village’s rebel potential to zero. Statistics of anti-Soviet uprisings show that the All-Union famine of 1932 caused protests mostly in Ukraine and North Caucasus. The Secret Political Department of the Joint State Political Directorate reported that in the first seven months of 1932, out of the 1,630 registered peasant uprisings in the whole USSR, there were 923 peasant uprisings in Ukraine and 173 uprisings in the Ukrainian-speaking Kuban region of North Caucasus. The number of uprisings was much smaller in Russian regions (Danilov Reference Danilov2001, 440–441). Stalin’s team tested all the elements of a punitive operation in some villages placed on “black boards” for failing to implement the grain procurement plan in November and December of 1932.
In order to stop the national economic collapse, which led to the famine of 1932–1933, Stalin gave up the production tax grain procurement in January 1933. He legalized the private ownership of the production by collective farms and on private lots (under the camouflage names of the collective-cooperative farms and personal property), and limited himself to a natural tax, which was made public before beginning the sowing. Thus, peasants had a vested interest in reducing the losses during cultivation, harvesting, and storage of grain crops because those losses accounted for the share of the crop that they could retain. This share could now be used freely, namely sold to the collective farm at prices regulated by terms of supply and demand. This change in the relations between urban and rural areas, straying from the main principles of the communist doctrine, brought the country out of collapse and persisted until the end of the collective-farm system. The concessions to the peasants in spring of 1933 were enshrined in the Model Article for the Agricultural Artel of 1935 (Danilov Reference Danilov2002).
At the same time, Stalin inflicted a preventive “destructive blow” on the peasants in January 1933, a term previously mentioned without an explanation at a joint meeting of the Politburo of the Central Committee and the Presidium of the Central Committee of the CPSU on November 27, 1932. The preventive blow on the Ukrainian peasantry consisted of the following: (1) confiscation of all food supplies of long-term storage in peasant farms under the guise of winter grain procurements; (2) blocking information about the situation peasants found themselves in after the confiscation of all food supplies; and (3) closing of borders to prevent the flight of starving peasants outside Ukraine and Kuban.
The purpose of this action was not to save starving peasants’ families from death. Actually, it was not designed to save everyone. Millions died, and the Kremlin achieved its goal by carrying out “education by starvation.” Ukraine ceased to present any danger to the authorities for a long time.
Analysis of Holodomor Losses
A detailed analysis of Holodomor losses has been described in several publications (Levchuk Reference Levchuk, Antonovych, Boriak, Gladun and Kulchytskyi2013; Levchuk, Boryak, and Wolowyna Reference Levchuk, Boriak, Wolowyna, Rudnits’kiy and Kovbasyuk2015, 84–112; Rudnytskyi et al. Reference Rudnytskyi, Levchuk, Wolowyna, Shevchuk and Kovbasiuk2015a; Rudnytskyi et al. Reference Rudnytskyi, Levchuk, Wolowyna, Shevchuk, Curran, Luciuk and Newby2015b; Wolowyna Reference Wolowyna, Antonovych, Boriak, Gladun and Kulchytskyi2013; Wolowyna et al. Reference Wolowyna, Plokhy, Levchuk, Rudnytskyi, Kovbasiuk and Shevchuk2016). These publications substantiated that the famine losses in Ukraine were not only in 1932–1933, but also in 1934. We shall present here only some highlights of their findings.
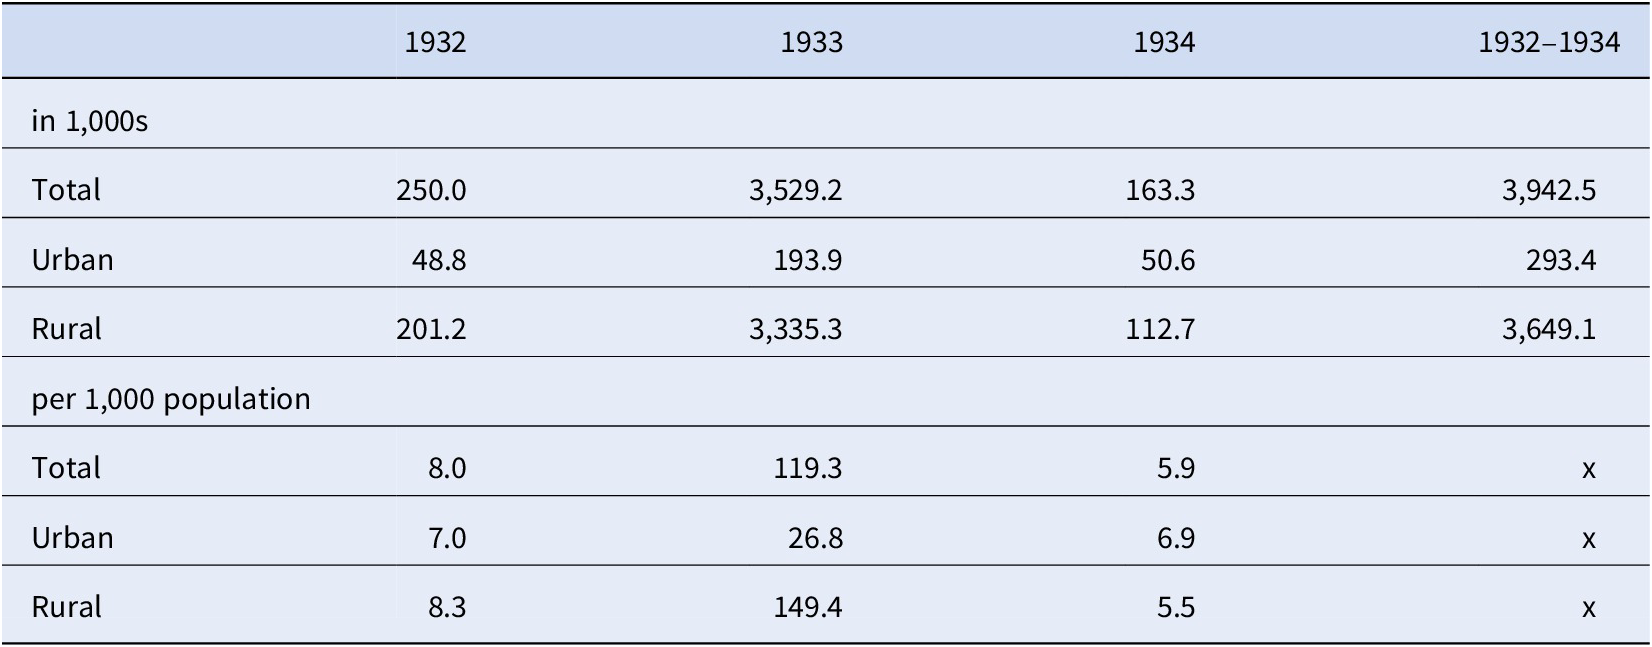
There were 3,942,500 direct losses of the 1932–1934 famine, with 89.5 percent of them in the 1933 peak year (Table 6). In that year, the relative number of losses was 119.3 per 1,000 population, with 26.8 in urban areas and 149.4 in rural areas.
Yearly absolute and relative losses for urban and rural populations, 1932–1934.

Source: Wolowyna et al. (Reference Wolowyna, Plokhy, Levchuk, Rudnytskyi, Kovbasiuk and Shevchuk2016).
92.6 percent of these losses occurred in rural areas; the excess of deaths in rural areas was 12.4 times higher than the corresponding absolute number of excess deaths in urban areas.
National averages of excess deaths hide large variations among the seven oblasts and the Moldova ASSR (Table 7). Rural 1933 relative losses vary between 77.3 per 1,000 population in Donetsk oblast and 222.0 in Kharkiv oblast. Relative losses in urban areas are significantly lower than losses in respective rural areas; they vary between 10.4 per 1,000 population in Donetsk and 46.7 in Kyiv oblasts.
Reasons for these variations are explained in Wolowyna et al. (Reference Wolowyna, Plokhy, Levchuk, Rudnytskyi, Kovbasiuk and Shevchuk2016). The main result is that, contrary to expectations, the highest losses are found in the forest-steppe oblasts of Kyiv and Kharkiv, not in the southern grain-producing oblasts of Odesa, Dnipropetrovsk, and Donetsk.
Comparative Analysis of the Famine of 1921–1923 and the Holodomor of 1932–1933
The famine of 1921–1923 and the Holodomor of 1932–1933 have common features and distinctions. During the Holodomor, there was an outright genocide against all social groups and strata of the population of the Ukrainian SSR. In those years and for a long period of time, the last hopes for the cultural and patriotic revival of Ukraine in the Soviet Union were destroyed. Ukraine lost not only an entire generation, but also many ideas that artists provided by their works. A large number of art pieces that could have made a significant contribution to the formation of the self-identity of the Ukrainian nation in the future and become its pride was destroyed and lost (Bilokin Reference Bilokin2016; Tsvilyuk Reference Tsvilyuk2004, Reference Tsvilyuk2008).
One common feature of these two famines is that they both had peak years, 1922 and 1933, with 54.4 and 89.5 percent of all losses in these years, respectively (Tables 2 and 6). However, the losses from the famine of the early 1920s were distributed over the years more evenly than during the Holodomor. The peak of the Holodomor in the countryside was the period from February to August 1933, due to the draconian measures of the Stalinist regime at the end of 1932 to early 1933 (confiscation of all food stocks and the ban of travel from Ukraine to other regions of the USSR in search of foods). The small amount of belated state food aid (in the form of a loan) provided to Ukraine in early 1933 could not prevent the mass mortality from hunger.
Another common feature of the two famines is that most losses occurred in rural areas. Respective rural and urban losses were 87.8 percent and 12.2 percent for the 1921–1923 famine and 92.6 percent and 7.4 percent for the Holodomor. Thus, the level of losses was significantly less in urban than in rural areas for both famines. One difference between the two famines is that yearly relative urban and rural losses were more uniformly distributed during the 1921–1923 famine than during the Holodomor’s years.
A very significant difference is that the intensity of relative losses was much higher during the Holodomor than the 1921–1923 famine. This difference is especially striking during the peak years (1933 and 1922), with 119.3 and 19.0 losses per 1,000 population, respectively.
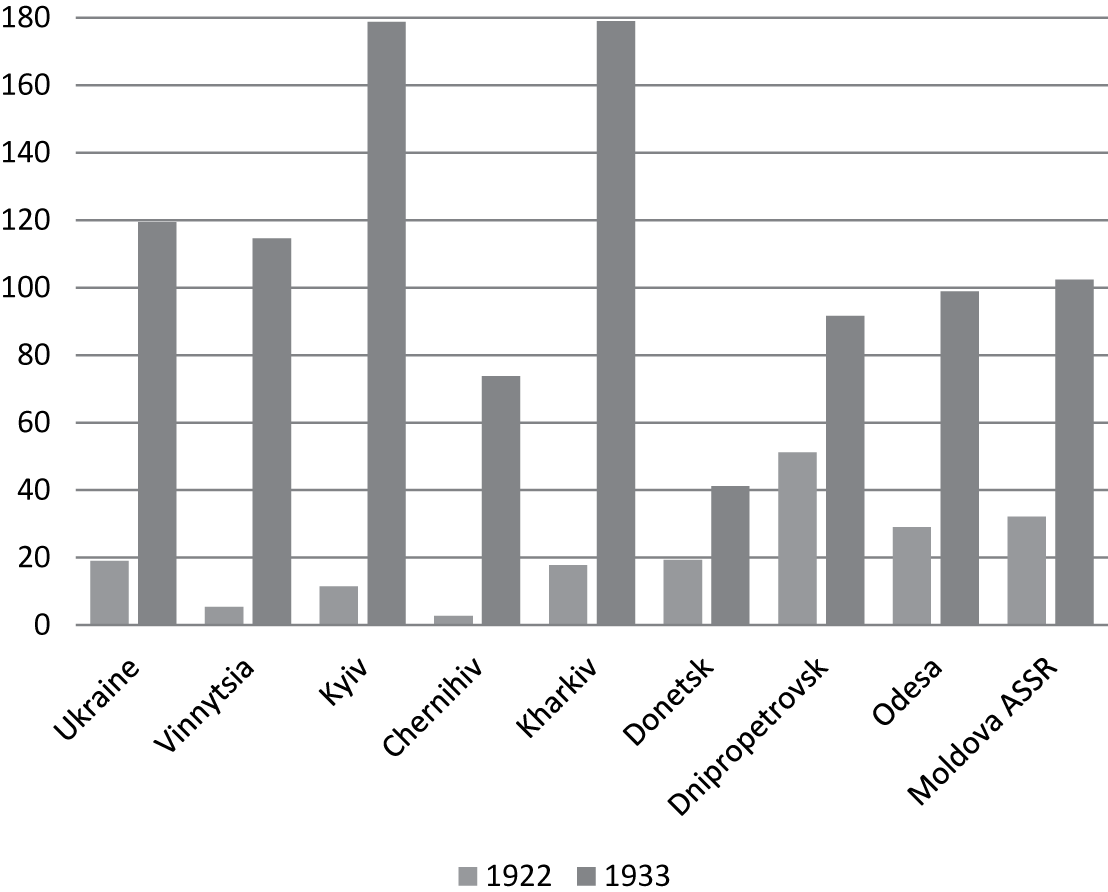
A second key difference between the two famines is the spatial distribution of losses in different oblasts of the country (Tables 3 and 7). While the most affected oblasts during the Holodomor were Kyiv, Kharkiv, and Vinnytsia oblasts, Dnipropetrovsk, Odesa, Kharkiv, and Donetsk oblasts had the highest losses during the 1921–1923 famine. Thus, eastern and southern steppe oblasts were more affected in 1921–1923, while northern and western forest-steppe oblasts that were not main grain producers suffered the most during 1932–1934. Figure 4 illustrates these oblast differences in losses for the peak years of 1922 and 1933.
Direct losses by oblast per 1,000 population in 1922 and 1933. Source: Wolowyna et al. (Reference Wolowyna, Plokhy, Levchuk, Rudnytskyi, Kovbasiuk and Shevchuk2016); author’s calculations.

Direct 1932-1934 famine losses by oblasts.

Source: Wolowyna et al. (Reference Wolowyna, Plokhy, Levchuk, Rudnytskyi, Kovbasiuk and Shevchuk2016).
Resistance to collectivization and repression tactics to extract more grain from peasants played a key role in the high level of losses of the forest-steppe oblasts during the Holodomor (Wolowyna et al. Reference Wolowyna, Plokhy, Levchuk, Rudnytskyi, Kovbasiuk and Shevchuk2016).
A third difference is related to the historical context of the two famines. The 1921–1923 famine took place after years of war. Drought and infectious diseases were key factors of the famine. Infectious diseases were the main cause of death in 46.3 percent of all excess deaths during 1921–1923. The Holodomor, on the other hand, took place in peacetime. There was an adequate level of food supplies and a much lower level of infectious diseases.
In 1921–1923, the government did not hide the famine and peasants received some food aid. The Soviet government acknowledged the gravity of the famine in only early 1933 and provided some amount of food aid to Soviet Ukraine, but it was too little and too late. In spite of this aid, excess deaths kept increasing at an extraordinary rate until June 1933 (Wolowyna et al. 2019). The 1932–1933 famine was officially denied until the last years of the USSR.
Conclusions
According to the French historian Alain Besançon, the twentieth century was a killing century (Besançon Reference Besançon2007, 115). The last century, especially the first half of it, was deadly to Ukraine. Its normal demographic development was repeatedly disrupted during the unprecedented series of demographic catastrophes caused by social crises. A catastrophic increase in mortality was observed during this period as a result of cumulative effects of wars, pandemics, mass terror, repressions, and the like. This mortality crisis lasted a total of 27 years, divided into five periods: 1905–1906, 1910, 1914–1923, 1932–1934, 1937–1947.
The famine of 1921–1923 and the Holodomor are especially notable in these series of events. They differ in geography and levels of losses, and have both similar and singular features. However, their causes and mechanisms are very similar. The main goal of the Soviet authorities during these two famines was to suppress the insurgent movement of Ukrainian peasants who did not accept the Bolshevik agrarian policy. Lenin introduced and put into action the technology of the terror by famine during 1921–1923, which was then applied by Stalin in 1932–1933 in a more brutal way. Direct demographic losses were 935,800 and 3,942,500 people, respectively.
The famine of 1921–1923 and the Holodomor of 1932–1933 had their own peculiarities: (1) the famine of 1921–1923 occurred after seven years of distresses caused by the war and revolutionary events, while the Holodomor occurred in peacetime; (2) steppe regions were the most affected by the famine of 1921–1923, while the Holodomor mostly affected the forest-steppe regions; (3) the intensity of the starvation in 1921–1923 was aggravated by the drought that hit the grain-growing southern Ukraine; (4) in both cases, the rural population suffered the most; (5) the famine of 1921–1923 had a powerful infectious diseases component (which caused almost half of the excess deaths), while during the Holodomor the level of infectious diseases was much lower, though some outbreaks were caused by the famine itself; (6) both famines had their distinct peak years: 1922 and 1933; (7) relative losses are much higher for the Holodomor than for the 1921–1923 famine; (8) peasants received some international food aid during the 1921–1923 famine, while during the Holodomor Stalin rejected foreign assistance and the internal food aid provided by the government was inadequate and distributed selectively.
After the famine of 1921–1923 Ukraine began to recover its demographic potential, but the Holodomor of 1932–1933 was devastating both for the consciousness of the people and for further demographic development of Ukraine.
Disclosure.
Authors have nothing to disclose.
Supplementary Materials
To view supplementary material for this article, please visit http://dx.doi.org/10.1017/nps.2019.81.