




1. Introduction
Recent years have witnessed a growing interest in the role of both positive and negative emotions in second language (L2) learning since the introduction of positive psychology in the field, which advocates a holistic understanding of learners’ full emotional repertoires (Fredrickson, Reference Fredrickson, Csikszentmihalyi and Csikszentmihalyi2006; MacIntyre & Gregersen, Reference MacIntyre and Gregersen2012). Among the emotions examined, foreign language classroom anxiety (FLCA) and foreign language enjoyment (FLE) have attracted substantial scholarly attention, as they are commonly experienced in L2 learning contexts and have been shown to significantly predict overall L2 performance (Dewaele et al., Reference Dewaele, Botes and Meftah2023a, Reference Dewaele, Saito and Halimi2023b; Li & Wei, Reference Li and Wei2023). FLCA is defined as “a distinct complex of self-perceptions, beliefs, feelings, and behaviors related to classroom language learning arising from the uniqueness of the language learning process” (Horwitz et al., Reference Horwitz, Horwitz and Cope1986, p. 128). As the positive counterpart of FLCA, FLE refers to the “enjoyment, fun, interest, and lack of boredom” (Dewaele & MacIntyre, Reference Dewaele and MacIntyre2014, p. 242) experienced specifically in the L2 environment, which occurs when learners’ psychological needs are met (Dewaele & MacIntyre, Reference Dewaele and MacIntyre2014).
FLCA and FLE can be viewed as related yet largely independent emotional constructs (Dewaele & MacIntyre, Reference Dewaele and MacIntyre2014). Theoretically, the three-dimensional taxonomy of achievement emotions proposed in control-value theory distinguishes achievement emotions in terms of activation (activating vs. deactivating), valence (positive vs. negative), and object focus (activity-related vs. outcome-related) (Pekrun, Reference Pekrun2006). Within this framework, FLCA and FLE are related in that they are both physiologically activating emotions; however, they differ in valence and object focus: FLE is a positive, activity-related emotion, whereas FLCA is a negative, outcome-related emotion (Li & Wei, Reference Li and Wei2023; Pekrun, Reference Pekrun2006). Empirically, FLCA and FLE are related within a broadly shared nomological network, as both constructs relate to well-established socio-biographical (e.g., gender) and psychological variables (e.g., motivation) in L2 learning (Li et al., Reference Li, Dewaele and Jiang2020). Nevertheless, prior research has demonstrated that FLCA and FLE differ in their antecedents (Jiang & Dewaele, Reference Jiang and Dewaele2019), their conceptual design and underlying factor structure (Li et al., Reference Li, Jiang and Dewaele2018), and their moderate negative correlations across three levels of situational specificity (i.e., trait-level in general L2 contexts, Li & Wei, Reference Li and Wei2023; trait-level in specific L2 skills, Li et al., Reference Li, Wei and Lu2023; and state-level in specific L2 tasks, Li, Reference Li2025).
FLCA and FLE frequently co-occur in L2 classrooms. Both qualitative and quantitative studies consistently show that students often experience high levels of both FLCA and FLE simultaneously (Dewaele et al., Reference Dewaele, Özdemir, Karci, Uysal, Özdemir and Balta2022; Li et al., Reference Li, Dewaele and Jiang2020). Thus, examining only their correlational association risks oversimplifying the range of emotional combinations that learners may experience (Botes et al., Reference Botes, Dewaele and Greiff2022a). Dewaele and MacIntyre (Reference Dewaele and MacIntyre2014) argued that FLCA and FLE are independent constructs rather than opposite ends of a single continuum and that the absence of one emotion does not imply a high level of the other emotion. Indeed, even anxious students may still find classroom tasks and activities enjoyable and may even reach a state of flow (Dewaele & MacIntyre, Reference Dewaele and MacIntyre2024; Dewaele et al., Reference Dewaele, Macintyre, Ahmed and Albakistani2025).
The predictive effects of emotions on academic achievement have been well theorized within both the broaden-and-build theory (Fredrickson, Reference Fredrickson, Csikszentmihalyi and Csikszentmihalyi2006) and the control-value theory (Pekrun, Reference Pekrun2006). According to the broaden-and-build theory, positive emotions reverse the deleterious effects of negative emotions, expand learners’ thought-action repertoire, and help build enduring psychological resources that support learning (Fredrickson, Reference Fredrickson, Csikszentmihalyi and Csikszentmihalyi2006). In the context of language learning, positive emotions broaden learners’ focus and facilitate deeper processing of linguistic input, whereas negative emotions narrow learners’ focus and impede the processing of new linguistic information (MacIntyre & Gregersen, Reference MacIntyre and Gregersen2012). Control-value theory posits that achievement emotions influence learning and achievement through their effects on learners’ cognitive and motivational mechanisms (Pekrun & Perry, Reference Pekrun, Perry, Pekrun and Linnenbrink-garcia2014). Importantly, control-value theory rejects the simplistic assumption that positive emotions invariably positively affect academic achievement and that negative emotions always negatively affect academic achievement. Rather, some emotions like anxiety can exert either facilitating or debilitating effects on achievement, depending on how they affect underlying cognitive and motivational mechanisms. These complex relationships underscore the need for a more nuanced understanding and empirical examinations of how emotions relate to achievement (Li & Wei, Reference Li and Wei2023).
Empirical evidence generally supports linear correlations between L2 emotions and self-perceived proficiency (SPP). Findings of meta-analyses have shown a small positive correlation between FLE and SPP (r = .27, k = 9, N = 4,556; Botes et al., Reference Botes, Dewaele and Greiff2022b) and a medium negative correlation between FLCA and SPP (r = −.47, k = 15, N = 3,185; Teimouri et al., Reference Teimouri, Goetze and Plonsky2019). Many studies have thus concluded that optimizing learners’ SPP requires enhancing FLE and reducing FLCA (Li, Reference Li2025; Li & Wei, Reference Li and Wei2023; Li et al., Reference Li, Wei and Lu2023). However, interventions that simply seek to minimize FLCA and maximize FLE may not fully capture the emotional complexity of the real foreign language classroom, where FLCA and FLE often co-occur, and their joint effects on SPP may be nonadditive (Botes et al., Reference Botes, Dewaele and Greiff2022a). Indeed, the full range of possible FLCA–FLE combinations is not necessarily represented in models that assume only linear effects on a third variable, such as SPP (Botes et al., Reference Botes, Dewaele and Greiff2022a). When examined in one model, the relative predictive effects of FLCA and FLE on SPP in L2 remain inconclusive. Some studies revealed that the positive effects of FLE outweighed the weak negative effects of FLCA on SPP (e.g., Li et al., Reference Li, Wei and Lu2023), whereas others reported that the negative effects of FLCA outweighed the weak positive effects of FLE on SPP (e.g., Li et al., Reference Li, Dewaele and Jiang2020). Together, these findings indicate that low FLCA does not necessarily co-occur with high SPP, nor does high FLE invariably associate with high SPP.
Shifting to a person-centered focus, different learners may exhibit different FLCA–FLE–achievement combinations. Li et al. (Reference Li, Dewaele and Jiang2020) identified three different patterns: high FLCA and high FLE, increase in FLCA and decrease in FLE, decrease in FLCA and increase in FLE. They found that learners who got a high score in an English test experienced enjoyment and anxiety simultaneously. Using latent profile analysis, Zhu et al. (Reference Zhu, Zhan and Yao2024) identified four profiles based on students’ enjoyment–anxiety patterns in the reading and writing components of a story continuation writing task and found that students who reported the highest levels of reading and writing enjoyment did not achieve significantly higher writing scores than the other groups. Taken together, these findings suggest that many FLCA–FLE combinations (e.g., equally high, equally low, or at completely opposite levels) are possible, and their predictive effects on SPP are quite complex and potentially nonlinear (Botes et al., Reference Botes, Dewaele and Greiff2022a; Zhu et al., Reference Zhu, Zhan and Yao2024). A more nuanced perspective is therefore needed to investigate how FLCA and FLE interact and jointly predict SPP (Botes et al., Reference Botes, Dewaele and Greiff2022a).
To capture this needed nuance, Botes et al. (Reference Botes, Dewaele and Greiff2022a) introduced polynomial regression with response surface analysis (PRRSA) into L2 research and used this method to achieve a three-dimensional representation of how different combinations of FLCA and FLE related to learners’ SPP. Their aim was to determine how SPP varies when FLCA and FLE are experienced at equally high or equally low levels (congruence) and when the two emotions occur at opposite intensities (incongruence). To this end, they recruited 1,039 foreign language learners from diverse linguistic backgrounds and age groups, all of whom completed an online questionnaire measuring FLCA, FLE, and SPP. The findings revealed that the relationships between emotions (i.e., FLCA and FLE) and SPP were complex and often nonlinear. Specifically, they found that when learners experienced FLCA and FLE at opposite levels (e.g., increasing FLE and declining FLCA), the relationship between emotions and SPP followed a linear pattern: higher FLE and lower FLCA were associated with higher SPP. However, when learners experienced the two emotions at the same intensities (e.g., equally high levels of both FLCA and FLE), the relationship between emotions and SPP became nonlinear. The response surface exhibited a convex pattern, indicating that extreme concurrent levels of FLE and FLCA predicted moderate to high SPP, with the negative effect of FLCA outweighing the positive effect of FLE when both were high. Based on these findings, Botes et al. (Reference Botes, Dewaele and Greiff2022a) argued that the relationship between emotions and language learning was not necessarily linear and that traditional linear methods (e.g., correlations and simple regressions) may obscure important patterns in foreign language learners’ emotions. They concluded that although positive emotions generally positively affected language learning, they could not fully counteract the detrimental effects of negative emotions (e.g., FLCA). Their study provides a novel and important perspective on the complex relationships between emotions and SPP in a large international sample and offers valuable insights into the applicability and potential of PRRSA for examining such intricate relationships in L2 learning.
Therefore, with a large sample of 1,078 Chinese English-as-a-foreign-language (EFL) learners androbust methodological design, our study is well-positioned to advance understanding of the complex relationships among FLCA, FLE, and SPP among Chinese EFL learners. By testing both the applicability of PRRSA and the generalizability of Botes et al.’s (Reference Botes, Dewaele and Greiff2022a) findings in the specific Chinese university EFL context, our study contributes valuable insights into the complex roles of emotions in L2 learning. Moreover, it deepens our understanding of how these intricate emotion–SPP relationships manifest in a specific cultural and educational context. Pedagogically, our study could inform targeted emotion-aware teaching strategies and learner support in Chinese EFL classrooms, aiming to promote students’ psychological well-being and enhance their L2 achievement.
2. Rationale and motivation for replication
The present replication study is primarily motivated by the growing scholarly interest in the complexity of emotions that language learners experience in L2 classrooms and the nonlinear predictive effects of emotions on L2 achievement (e.g., Zhu et al., Reference Zhu, Zhan and Yao2024). As MacIntyre and Gregersen (Reference MacIntyre and Gregersen2012) noted, the daily emotional schema of L2 learners is characterized by the coexistence of both positive and negative emotions, highlighting the importance of investigating how these emotions jointly unfold in L2 learning (Li & Wei, Reference Li and Wei2023).
We chose to replicate Botes et al.’s (Reference Botes, Dewaele and Greiff2022a) study for two reasons. The first reason concerns its theoretical significance. Botes et al.’s (Reference Botes, Dewaele and Greiff2022a) study has advanced our understanding of how positive and negative emotions interact and how these interactions jointly predict SPP among a broad and heterogeneous group of L2 learners. This study, published in The Modern Language Journal, demonstrates both linear and nonlinear emotion–SPP relationships, providing new insights into the complex effects of emotions on L2 learning. Therefore, this seminal study has encouraged a growing body of subsequent research to further examine the complex interplay of L2 emotions rather than treating them as isolated constructs (e.g., Fattahi et al., Reference Fattahi, Ebn-abbasi, Botes and Nushi2023; Gao, Reference Gao2024; Wang et al., Reference Wang, Wang and Yao2025).
The second reason lies in Botes et al.’s (Reference Botes, Dewaele and Greiff2022a) significant contribution to L2 emotion research through a novel and methodologically robust approach. This pioneering work demonstrates the value of PRRSA in investigating L2 emotions from a nonlinear, dynamic, and congruence-based perspective. To our knowledge, it was the first study in L2 research to apply PRRSA to examine three variables within a single model and capture their complex interactions simultaneously. In addition, the initial study has drawn increasing attention to the use of PRRSA in subsequent L2 research (e.g., Wang et al., Reference Wang, Wang and Yao2025; Xu & Feng, Reference Xu and Feng2026). Given the promise of this analytical approach for advancing L2 emotion research, we decided to replicate their analytic approach by examining the effects of FLCA–FLE (in)congruence on SPP among Chinese EFL learners, which is still an underexplored area. Such an endeavor is valuable because the combined effects of these emotions and achievement-related outcomes shed light on the mechanisms that underpin successful L2 learning (Li & Wei, Reference Li and Wei2023).
We chose to replicate Botes et al.’s (Reference Botes, Dewaele and Greiff2022a) study in a Chinese EFL context. Botes et al. (Reference Botes, Dewaele and Greiff2022a) called for context-specific investigations into whether the response surface patterns identified in their analysis can be replicated and generalized to a “specific target language, country, or age group” (p. 794). Considering that L2 emotions do not exist in isolation but interact with, and are subject to a range of individual differences (e.g., L1, L2, educational level, age) and contextual factors (e.g., country, cultural values, educational contexts) (Jiang & Dewaele, Reference Jiang and Dewaele2019; Li et al., Reference Li, Dewaele and Jiang2020; Li & Wei, Reference Li and Wei2023; MacIntyre, Reference MacIntyre, Gkonou, Daubney and Dewaele2017), the present replication study responds to Botes et al.’s call by exploring how FLCA and FLE jointly predict learners’ SPP among Chinese university-level EFL learners. The Chinese university-level EFL context is particularly meaningful for replication because China has the largest EFL learner population in the world and distinctive educational (e.g., highly exam-oriented university environments, Wu & Zhang, Reference Wu and Zhang2025) and sociocultural contexts (e.g., Confucian heritage cultural values) that have unique effects on L2 emotions in ways that differ from those observed in many other parts of the world (Dewaele & MacIntyre, Reference Dewaele and MacIntyre2014; Jiang & Dewaele, Reference Jiang and Dewaele2019; Li et al., Reference Li, Dewaele and Jiang2020). Therefore, studying Chinese university-level EFL learners not only addresses the need for context-specific replication but also provides an opportunity to examine how cultural and educational contexts may moderate emotion–SPP relationships.
In addition to replicating Botes et al.’s (Reference Botes, Dewaele and Greiff2022a) study, we extended their methodological approach to examine potential (in)congruence effects across the broader response surface. In the initial study, the response surface was interpreted primarily through the congruence and incongruence lines, which represent two theoretically meaningful trajectories within the model. The congruence line reflects situations in which the two emotions occur at identical levels, whereas the incongruence line captures cases in which they move in opposite directions. Examining these lines provides valuable insights into extreme forms of FLE–FLCA (in)congruence. In fact, learners’ emotional experiences in authentic L2 learning contexts often involve varying degrees of balance, with positive and negative emotions coexisting in different proportions. Considering the broader response surface may therefore provide additional insights into how a wider range of FLE–FLCA combinations relate to SPP. By complementing line-based interpretations with a broader surface perspective, the present study echoes Botes et al.’s (Reference Botes, Dewaele and Greiff2022a) call for future research to “address the myriad intricacies in the calculation and interpretation of the response surface model” (p. 794) by exploring whether the patterns observed along these lines also appear in other regions of the response surface. Such an approach could contribute theoretically by offering a more comprehensive picture of how FLE–FLCA combinations relate to SPP and methodologically by illustrating how response surface interpretations can be further developed in SLA research.
3. The present replication
Although Botes et al. (Reference Botes, Dewaele and Greiff2022a) did not explicitly state research questions (RQs), they identified two primary aims: first, “to examine how FLCA and FLE in concert influence SPP through a three-dimensional response surface model,” and second, “to introduce the method of PRRSA to the field of applied linguistics by applying this method to the aforementioned examination” (p. 785). Aligning with these aims and extending them to the Chinese university EFL context, the present study explicitly formulated three RQs. RQ1 and RQ2 correspond to the first aim by examining the joint effects of FLCA and FLE on SPP, while RQ3 reflects the methodological extension of the second aim by exploring potential (in)congruence effects.
RQ1: What are the distinctive linear predictive effects of FLCA and FLE on SPP when examined simultaneously in a single model?
RQ2: How do FLCA–FLE congruence and incongruence predict SPP?
RQ3: Is FLCA–FLE congruence or incongruence more beneficial in predicting higher levels of SPP?
4. Methodology
Following the replication framework proposed by Porte and McManus (Reference Porte and McManus2019), the present study is designed as a conceptual replication of Botes et al.’s (Reference Botes, Dewaele and Greiff2022a) research. We retained the core theoretical focus (i.e., examining the joint effects of FLCA and FLE on SPP) and analytical framework (i.e., using PRRSA) of the initial study. At the same time, several contextual and measurement adaptations were introduced. The main methodological differences between the two studies are summarized in Table 1.
Methodological differences between Botes et al. (Reference Botes, Dewaele and Greiff2022a) and the present replication

Table 1 Long description
Methodology is compared across two columns labeled, Initial study and Replication study, for participants, measures, collection, and analysis. Participants differed in L1 background, with a variety of languages in the initial study and Chinese in the replication study. L2 learning context was a variety of languages in the initial study and English as a foreign language in the replication study. Mean age was 24.04 with SD 8.01 in the initial study and 19.00 with SD 1.31 in the replication study, and education level was a variety of education levels versus undergraduates. Questionnaire language was English and Chinese in the initial study and Chinese in the replication study. Self perceived proficiency was any foreign language with 1 item on a 5 point scale in the initial study and English as a foreign language with 4 items on a 6 point scale in the replication study, and foreign language enjoyment used Botes et al. 2021 versus Li et al. 2018. Data collection tool was Googledocs in the initial study and Wenjuanxing in the replication study. Analysis software listed SPSS 25, the Excel macro for response surface analysis, and the RSA package in R for the initial study, and SPSS 29, Mplus 8.3, and the RSA package in R for the replication study. Statistical analysis in both studies included descriptive statistics, correlational analysis, reliability, multiple linear regression analysis, and polynomial regression with response surface analysis, with validity additionally listed for the replication study.
In this study, we judiciously adjusted two main elements: participants and measures. For the participants, whereas Botes et al. (Reference Botes, Dewaele and Greiff2022a) recruited participants spanning a wide age range, diverse education levels, and various L1s and L2s, the present study focused exclusively on university students aged 16–25 years who were L1 speakers of Chinese and EFL learners. Regarding the measures, following Botes et al.’s (Reference Botes, Dewaele and Greiff2022a) recommendation, we adopted a multi-item SPP scale previously validated by Sun and Pan (Reference Sun and Pan2026). In addition, since the Chinese version of the FLE scale used by Botes et al. (Reference Botes, Dewaele and Greiff2022a) was unavailable, we employed the widely used Chinese version of the FLE scale developed by Li et al. (Reference Li, Jiang and Dewaele2018). Although the two scales are not entirely identical, they share substantial conceptual overlap. In particular, 7 items in Li et al.’s 11-item scale correspond directly to the items in Botes et al.’s (Reference Botes, Dewaele and Greiff2021) 9-item FLE scale. Moreover, both scales adopt a three-factor structure and were adapted from the original FLE scale developed by Dewaele and MacIntyre (Reference Dewaele and MacIntyre2014). We chose Li et al.’s (Reference Li, Jiang and Dewaele2018) scale because it was developed and validated specifically in Chinese EFL contexts, which aligns with the context of the present study. The instructions for the scales were written in Chinese, instead of both English and Chinese, as in Botes et al. (Reference Botes, Dewaele and Greiff2022a).
Our procedures for data collection and analysis were nearly identical to those in the initial study. Additionally, we extended the analysis by conducting further validity checks and examining incongruence effects. The data, analysis code, and study materials are available at https://osf.io/dqj3r/overview?view_only=0beb2b32a8fd498894ea63bb58cc6f9c.
4.1. Sample size justification
To determine the minimum required sample size, we conducted an a priori power analysis using G*Power 3.1 (Faul et al., Reference Faul, Erdfelder, Buchner and Lang2009). The analysis focused on detecting the incremental explanatory power (∆R 2) of the hypothesized congruence effect beyond the main effects within a PRRSA framework (Schönbrodt et al., Reference Schönbrodt, Humberg and Nestler2018). We set the significance level at α = .05 and the desired statistical power at 1 − β = .80. Following Humberg et al. (Reference Humberg, Schönbrodt, Back and Nestler2022), we assumed a small-to-medium effect size for the incremental variance explained by the higher-order terms (i.e., quadratic and interaction terms) and, consistent with Schönbrodt et al. (Reference Schönbrodt, Humberg and Nestler2018), estimated ∆R 2 at .05. The analysis indicated a minimum required sample size of N = 212. To ensure robust parameter estimation and to account for potential unmodeled complexity, we followed Humberg et al.’s (Reference Humberg, Schönbrodt, Back and Nestler2022) conservative guidance and recruited a sample far exceeding the calculated minimum. The final sample consisted of 1,078 participants, which is approximately 5 times the required minimum.
4.2. Participants
This study involved 1,078 students from 45 universities in China. The participants comprised 39.2% male and 60.8% female students, aged 16–25 years (M = 19.00, SD = 1.31), with 16 participants not reporting their age. All participants were L1 Chinese speakers who began learning English as their L2 at an average age of 8.42 years (SD = 2.36), with 15 participants not providing this information. In terms of year of study, our participants included 752 freshmen (69.8%), 166 sophomores (15.4%), 109 juniors (10.1%), and 51 seniors (4.7%). Participants represented a wide range of disciplinary backgrounds, including engineering (29.3%), literature (21.4%), science (13.1%), economics (10.1%), management (7.4%), education (6.9%), medicine (4.2%), law (3.3%), agriculture (1.3%), history (1.3%), arts (1.3%), and philosophy (0.4%). This disciplinary diversity enhances the generalizability of the findings and provides a comprehensive view of EFL learning experiences across different academic domains.
4.3. Instruments
4.3.1. Self-perceived proficiency (SPP)
Following Botes et al.’s (Reference Botes, Dewaele and Greiff2022a) recommendation, the present study used a multi-item scale to measure learners’ SPP in English listening, writing, reading, and speaking. Participants were asked to indicate their level of English proficiency on a scale ranging from 1 (least proficient) to 6 (very proficient). We used this 6-point scale for measuring SPP to provide participants with a slightly finer-grained response option, allowing for more nuanced self-assessment across the four language skills. In this study, the scale has shown good reliability (α = .900). To facilitate direct comparison with Botes et al. (Reference Botes, Dewaele and Greiff2022a), who used a 5-point scale, we converted the 6-point scores to a 5-point scale using the following formula: 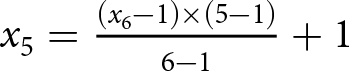 ${x_5} = \frac{{\left( {{x_6} - 1} \right) \times \left( {5 - 1} \right)}}{{6 - 1}} + 1$, where x 6 and x 5 represent scores on the initial and converted scales, respectively.
4.3.2. Short-form foreign language classroom anxiety scale (S-FLCAS)
We used the 8-item S-FLCAS developed by MacIntyre (Reference MacIntyre1992), a shortened version of the original 33-item scale by Horwitz et al. (Reference Horwitz, Horwitz and Cope1986) and recently validated in Botes et al. (Reference Botes, Van der Westhuizen, Dewaele, MacIntyre and Greiff2022c). The Chinese version has been validated by Sun and Shi (Reference Sun and Shi2026), which has shown satisfactory reliability and validity. One sample item was “It embarrasses me to volunteer answers in my English class.” Items are scored on a 5-point Likert scale ranging from 1 (strongly disagree) to 5 (strongly agree). The scale has shown satisfactory reliability (α = .932) and an acceptable fit to a single-factor model: χ 2/df = 200.597/20, comparative fit index (CFI) = .934, Tucker–Lewis index (TLI) = .907, root mean square error of approximation (RMSEA) [90% CI] = .092 [.080, .103], and standardized root mean square residual (SRMR) = .040.
4.3.3. The Chinese foreign language enjoyment scale (CFLES)
We used the CFLES developed by Li et al. (Reference Li, Jiang and Dewaele2018) to assess FLE. This 11-item scale consists of three subscales: FLE–Private (5 items, e.g., “I enjoy English learning”), FLE–Atmosphere (3 items, e.g., “We form a tight group”), and FLE–Teacher (3 items, e.g., “The English teacher is supportive”). The items were rated on a 5-point Likert scale ranging from 1 (strongly disagree) to 5 (strongly agree). The scale has shown satisfactory reliability (α = .941) and good validity (χ 2/df = 217.311/41, CFI = .964, TLI = .952, RMSEA [90% CI] = .063 [.055, .072], and SRMR = .038).
4.4. Data collection and ethics
Data were collected between December 27, 2023, and January 20, 2024, following the same procedures as those described in Botes et al. (Reference Botes, Dewaele and Greiff2022a). The questionnaire survey was administered via the online platform Wenjuanxing (https://www.wjx.cn/), and participation invitations were distributed through QQ group chats, a widely used social media and messaging platform in China. Ethical approval was obtained from the first author’s previous university. Informed consent was obtained from all participants after they were provided with detailed information regarding the nature, purpose, and duration of the study, their unconditional right to decline or withdraw participation, the rewards provided upon completion, and the assurance of data anonymity in all research procedures.
4.5. Data analysis
For the preliminary analyses, descriptive statistics, reliability coefficients, and bivariate correlations were computed using SPSS 29. Confirmatory factor analyses were conducted in Mplus 8.3 (Muthén & Muthén, Reference Muthén and Muthén2017) with robust maximum likelihood estimation to assess construct validity. Model fit was evaluated based on conventional criteria: CFI ≥ .90, TLI ≥ .90, and SRMR ≤ .08 (Kline, Reference Kline2023). In terms of RMSEA, values above .10 indicate a poor fit, values between .08 and .10 indicate a mediocre fit, and values below .08 indicate a good fit (MacCallum et al., Reference MacCallum, Browne and Sugawara1996).
To address RQ1, following Botes et al. (Reference Botes, Dewaele and Greiff2022a), we conducted a multiple linear regression analysis using SPSS 29 to examine the respective linear predictive effects of FLCA and FLE on SPP.
To address RQ2, we followed Botes et al. (Reference Botes, Dewaele and Greiff2022a) and performed PRRSA using SPSS 29 and the RSA package (Schönbrodt & Humberg, Reference Schönbrodt and Humberg2023) in R 4.4.3 (R Core Team, 2025). First, unstandardized scores of FLCA and FLE were centered around the scale midpoint (i.e., 3) to facilitate interpretation (Edwards, Reference Edwards1994), which resulted in two centered predictors: FLCA (X) and FLE (Y), both ranging from −2 to +2 on a 5-point Likert scale. Second, three additional predictors were calculated: the squared centered FLCA (X2), the interaction between FLCA and FLE (XY), and the squared centered FLE (Y2). Third, the outcome variable SPP (Z) was regressed on the linear (X, Y), interaction (XY), and quadratic (X2, Y2) terms according to the following equation:
 \begin{equation*}{\text{Z = }}{b_{\text{0}}}{\text{ + }}{b_{\text{1}}}{\text{X + }}{b_{\text{2}}}{\text{Y + }}{b_{\text{3}}}{{\text{X}}^{\text{2}}}{\text{ + }}{b_{\text{4}}}{\text{XY + }}{b_{\text{5}}}{{\text{Y}}^{\text{2}}}{\text{ + }}\varepsilon \end{equation*}
The resulting unstandardized regression coefficients (b 1–b 5) were subsequently used to calculate surface test values (a 1–a 4), which capture the slope and curvature of the response surface along the line of congruence (LOC; X = Y) and the line of incongruence (LOIC; X = −Y). Three-dimensional response surface plots were then generated.
When interpreting the results for RQ2, we primarily examined how SPP varied along the LOC and LOIC based on the surface test values (a 1–a 4). Specifically, the slope along the LOC (a 1 = b 1 + b 2) indicates whether the outcome (Z) increases or decreases as both predictors (X and Y) rise together, while the curvature along the LOC (a 2 = b 3 + b 4 + b 5) indicates whether this relationship is linear or nonlinear (e.g., convex or concave). The slope along the LOIC (a 3 = b 1 − b 2) indicates how the outcome changes when one predictor increases while the other decreases, and the curvature along the LOIC (a 4 = b 3 − b 4 + b 5) reveals whether this incongruent relationship is linear or nonlinear.
To address RQ3, we further calculated the intercept (p10) and slope (p11) of the first principal axis (FPA) and the intercept (p20) and slope (p21) of the second principal axis (SPA). The FPA of a dome-shaped surface is the line with minimal downward curvature, and the FPA of a saddle-shaped surface is the line with the maximal upward curvature (Edwards, Reference Edwards, Drasgow and Schmitt2002). The SPA is orthogonal to the FPA. We used p10, p11, p20, and p21 to examine whether the principal axes of the response surface aligned with the LOC or LOIC (Humberg et al., Reference Humberg, Nestler and Back2019).
After identifying whether the principal axes aligned with the (in)congruence lines, we interpreted the corresponding (in)congruence effects by integrating these results with the surface test values (a 1–a 4). Importantly, as Humberg et al. (Reference Humberg, Nestler and Back2019) noted, none of the surface test values should be interpreted in isolation, as each reflects only a single coefficient from one specific line on the surface. A congruence effect in a broad sense is supported when the RSA parameters meet the following conditions: (1) p10 ≈ 0 (i.e., p10 is not significantly different from 0), (2) p11 ≈ 1 (i.e., the confidence interval of p11 includes 1), (3) a 4 < 0, and (4) a 3 ≈ 0, which indicates that the FPA aligns with the LOC and the outcome variable increases when the two predictors are more congruent. A reverse congruence effect in a broad sense (i.e., the SPA aligns with the LOC and the outcome variable decreases when predictors are more congruent) is supported when the conditions shift to (1) p20 ≈ 0, (2) p21 ≈ 1, (3) a 4 > 0, and (4) a 3 ≈ 0. An incongruence effect (i.e., the FPA aligns with the LOIC and the outcome variable increases when predictors are more incongruent) can be inferred when (1) p10 ≈ 0, (2) p11 ≈ −1, (3) a 2 < 0, and (4) a 1 ≈ 0. A reverse incongruence effect (i.e., the SPA aligns with the LOIC and the outcome variable decreases when predictors are more incongruent) can be inferred when (1) p20 ≈ 0, (2) p21 ≈ −1, (3) a 2 > 0, and (4) a 1 ≈ 0.
5. Results
5.1. Results of preliminary analyses
Following Botes et al. (Reference Botes, Dewaele and Greiff2022a), we conducted the descriptive statistics for all three variables (see Table 2). Overall, the data showed moderate levels of FLCA (M = 3.336, SD = 0.948) and FLE (M = 3.554, SD = 0.868), as well as comparatively low levels of SPP (M = 2.801, SD = 0.835).
Descriptive statistics

Table 2 Long description
Descriptive statistics are reported for three variables using columns labeled M, SD, Max, Min, Kurtosis, and Skewness. For foreign language classroom anxiety, M is 3.336, SD is 0.948, Max is 5.00, Min is 1.00, Kurtosis is 0.050, and Skewness is negative 0.498. For foreign language enjoyment, M is 3.554, SD is 0.868, Max is 5.00, Min is 1.00, Kurtosis is 0.191, and Skewness is negative 0.322. For self-perceived proficiency, M is 2.801, SD is 0.835, Max is 5.00, Min is 1.00, Kurtosis is 0.334, and Skewness is 0.195. Across all three variables, the maximum is 5.00 and the minimum is 1.00. Skewness is negative for classroom anxiety and enjoyment, and positive for self-perceived proficiency.
In their study, Botes et al. (Reference Botes, Dewaele and Greiff2022a) confirmed that their data met several requirements outlined by Humberg et al. (Reference Humberg, Nestler and Back2019), including: (a) a sufficient representation of participants with differing FLCA and FLE scores (higher, lower, or equal), (b) acceptable multicollinearity between FLCA and FLE, (c) reliable measurement instruments, and (d) adequate statistical power. Following their approach, we performed the same preliminary checks to ensure that our dataset satisfied the assumptions necessary for conducting PRRSA.
We first standardized both FLCA and FLE scores to examine discrepancies between the two predictors. The difference between the standardized scores was used to categorize participants whose FLCA score was at least half a standard deviation above or below their FLE score (Shanock et al., Reference Shanock, Baran, Gentry, Pattison and Heggestad2010). Accordingly, participants were classified into three groups: FLCA higher than FLE, FLCA equal to FLE, and FLCA lower than FLE, within half a standard deviation. As shown in Table 3, a sufficient degree of discrepancy was observed across the predictor pairs, justifying the use of PRRSA.
Discrepancy pairs of independent variables within half a standard deviation

Table 3 Long description
Percentages are reported for three pair categories comparing FLCA and FLE. The category “FLCA higher than FLE” is 25 percent. The category “FLCA approximately equal to FLE” is 41 percent. The category “FLCA lower than FLE” is 34 percent. The highest percentage is for “FLCA approximately equal to FLE”, and the lowest is for “FLCA higher than FLE”.
Note: FLCA = foreign language classroom anxiety; FLE = foreign language enjoyment.
We then examined multicollinearity between FLCA and FLE by computing zero-order correlation coefficients and the variance inflation factor (VIF). As shown in Table 4, all variables were significantly correlated. FLCA showed a negative correlation with SPP with a small-to-medium effect size (r = −.327, p < .001), whereas FLE was positively correlated with SPP with a medium effect size (r = .418, p < .001; Plonsky & Oswald, Reference Plonsky and Oswald2014). The negative association between FLCA and FLE, with a small effect size (r = −.274, p < .001), indicated low multicollinearity between the two predictors. In addition, the VIF value of 1.081 (see Table 5) was well below the threshold of concern, satisfying the collinearity requirement for further analysis (Humberg et al., Reference Humberg, Nestler and Back2019).
Correlation and reliability coefficients

Table 4 Long description
Three variables are listed with pairwise correlation coefficients and a reliability column labeled alpha. Foreign language classroom anxiety has an alpha of .932. Foreign language enjoyment has a correlation of –.274 with foreign language classroom anxiety and an alpha of .941. Self-perceived proficiency has a correlation of –.327 with foreign language classroom anxiety, a correlation of .418 with foreign language enjoyment, and an alpha of .900.
Note: ***p < .001.
Distinctive predictive effects of FLCA and FLE on SPP (N = 1,078)

Table 5 Long description
Regression results are reported for outcome SPP with predictors FLCA and FLE, including fit index, coefficients, 95 percent confidence intervals, and collinearity statistics. Model fit shows R2 of 0.224 and F with 2 and 1075 degrees of freedom of 154.889 with three asterisks. For predictor FLCA, B is –0.203, standard error 0.025, beta –0.230, and t –8.245 with three asterisks; the 95 percent confidence interval for B runs from –0.251 to –0.155. For FLCA, tolerance is 0.925 and VIF is 1.081. For predictor FLE, B is 0.341, standard error 0.027, beta 0.355, and t 12.699 with three asterisks; the 95 percent confidence interval for B runs from 0.289 to 0.394. For FLE, tolerance is 0.925 and VIF is 1.081.
Note: SPP = self-perceived proficiency; FLCA = foreign language classroom anxiety; FLE = foreign language enjoyment.
*** p < .001.
To assess measurement reliability, we calculated internal consistency using Cronbach’s α. As shown in Table 4, all scales demonstrated satisfactory reliability (i.e., α values were approximately .900 or higher), meeting the third assumption.
Finally, the sample size (N = 1,078) was well above the minimum required (N = 212) to ensure adequate statistical power. As all requirements were met, we proceeded with the main analyses.
5.2. Independent predictive effects of FLCA and FLE on SPP
Following Botes et al. (Reference Botes, Dewaele and Greiff2022a), we conducted a multiple linear regression analysis to examine the unique contributions of FLCA and FLE to SPP. As shown in Table 5, the overall regression model was statistically significant, F(2, 1075) = 154.889, R 2 = .224, p < .001. Specifically, FLCA negatively predicted SPP (B = −.203, 95% CI [−.251, −.155], β = −.230, p < .001), whereas FLE positively predicted SPP (B = .341, 95% CI [.289, .394], β = .355, p < .001).
5.3. Joint predictive effects of FLCA and FLE on SPP
We used the PRRSA to examine the relations between FLCA–FLE (in)congruence and SPP. The overall polynomial regression model with SPP as the outcome variable was statistically significant, F(5, 1072) = 66.92, R 2 = .238, p < .001. The estimated coefficients (b 1–b 5) are summarized in Table 6.
Polynomial regression results of FLCA and FLE on SPP

Table 6 Long description
Polynomial regression coefficients are reported for b0 through b5 and derived terms a1 through a4, with columns for Description, Estimate, SE, 95% CI lower and upper, beta, and p. The intercept b0 estimate is 2.672 with SE.034, 95% CI 2.605 to 2.738, beta 3.201, and p less than .001 with three asterisks. FLCA centered b1 has estimate –0.300, SE.034, 95% CI –0.367 to –0.234, beta –0.341, and p less than .001 with three asterisks. FLE centered b2 has estimate 0.247, SE.036, 95% CI 0.177 to 0.318, beta 0.257, and p less than .001 with three asterisks. FLCA squared b3 has estimate 0.045, SE.022, 95% CI 0.002 to 0.088, beta 0.065, and p.042 with one asterisk; FLCA times FLE b4 has estimate 0.105, SE.025, 95% CI 0.056 to 0.154, beta 0.164, and p less than .001 with three asterisks; FLE squared b5 has estimate 0.049, SE.024, 95% CI 0.003 to 0.095, beta 0.076, and p .038 with one asterisk. Derived term a1, described as b1 plus b2, has estimate –0.053, SE.059, 95% CI –0.169 to 0.063, and p .372, with no beta shown. Derived term a2, described as b3 plus b4 plus b5, has estimate 0.199, SE.045, 95% CI 0.110 to 0.287, and p less than .001 with three asterisks, with no beta shown. Derived term a3, described as b1 minus b2, has estimate –0.548, SE.037, 95% CI –0.621 to –0.475, and p less than .001 with three asterisks, with no beta shown. Derived term a4, described as b3 minus b4 plus b5, has estimate –0.012, SE.026, 95% CI –0.062 to 0.039, and p.654, with no beta shown.
Note: FLCA = foreign language classroom anxiety; FLE = foreign language enjoyment.
* p < .05.
*** p < .001.
As shown in Table 6, FLCA had a significant negative effect on SPP (b 1 = −.300, 95% CI [−.367, −.234], p < .001), whereas FLE had a significant positive effect (b 2 = .247, 95% CI [.177, .318], p < .001). Both quadratic terms FLCA2 (b 3 = .045, 95% CI [.002, .088], p = .042) and FLE2 (b 5 = .049, 95% CI [.003, .095], p = .038) were significant, indicating that the effects of both emotions were nonlinear. Importantly, the interaction between FLCA and FLE was also significant (b 4 = .105, 95% CI [.056, .154], p < .001), suggesting that the relationship between one emotion and SPP depends on the level of the other. Taken together, these findings demonstrate that FLCA and FLE contribute to SPP both independently and interactively.
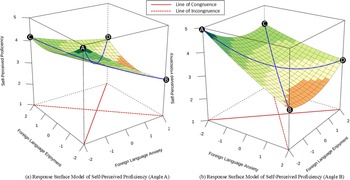
Given the significance of the regression model, we proceeded with the RSA to obtain a more nuanced understanding of these relationships. The surface test values (a 1–a 4) were derived from the regression coefficients (see Table 6). Based on these parameters, we constructed the response surface model of Chinese EFL learners’ SPP (see Figure 1a and b, which display two viewing angles of the same surface).
The response surface model of Chinese EFL learners’ self-perceived English proficiency.

Figure 1 Long description
Two three-dimensional response surface plots display the same model from two different viewing angles. Both plots share identical axis structure. The x-axis is labeled Foreign Language Anxiety, ranging from minus 2 to 2 in increments of 1, with no unit stated. The y-axis is labeled Foreign Language Mindset, ranging from minus 2 to 2 in increments of 1, with no unit stated. The z-axis is labeled Self-Perceived Proficiency, ranging from 1 to 5 in increments of 1, with no unit stated. The surface rises toward higher self-perceived proficiency values where foreign language mindset values are high and foreign language anxiety values are low. The surface descends toward lower self-perceived proficiency values where foreign language anxiety is high and foreign language mindset is low. A solid red line labeled Line of Congruence runs diagonally across the surface where foreign language anxiety and foreign language mindset values are equal. A second red line labeled Line of Incongruence runs perpendicular to the congruence line, crossing the surface where anxiety and mindset values are at opposite extremes. A dashed red line marks the baseline reference across the surface. Black markers are placed at notable corner positions of the surface, corresponding to the extreme combinations of the two predictor axes and at an interior point near the center of the design space. The first viewing angle emphasizes the descent of the surface along the anxiety axis. The second viewing angle highlights the rise of the surface along the mindset axis. Both panels show the same underlying surface model and are labeled as Angle A and Angle B respectively beneath each plot.
The projection of LOC on the response surface was interpreted through its slope and curvature (a 1 and a 2). The slope was nonsignificant (a 1 = −.053, 95% CI [−.169, .063], p = .372), while the curvature was significantly positive (a 2 = .199, 95% CI [.110, .287], p < .001), revealing a nonlinear (U-shaped) relationship along the LOC (see the curvilinear line AD of the response surface model in Figure 1). This indicates that SPP was the lowest when both FLE and FLCA were at moderate levels, but increased when both emotions simultaneously increased or decreased.
The projection of LOIC on the response surface exhibited a significant negative slope (a 3 = −.548, 95% CI [−.621, −.475], p < .001), indicating that SPP was lowest when learners experienced high FLCA and low FLE (see Point B in Figure 1). As FLE increased and FLCA decreased along this line, SPP rose steadily. The curvature of this line was nonsignificant (a 4 = −.012, 95% CI [−.062, .039], p = .654), suggesting a largely linear pattern of change between Points B and C, where increasing enjoyment and decreasing anxiety were associated with higher SPP.
5.4. The potential (in)congruence effect of the response surface
The results of the principal axis analysis showed that the intercept of the SPA was not significantly different from 0 (p20 = .207, 95% CI [−.874, 1.288], p = .707) and the slope was not significantly different from −1 (p21 = −.961, 95% CI [−1.620, −.301]). These results indicated that the SPA was approximately aligned with the LOIC. Together with the surface test parameters (a 1 ≈ 0 and a 2 > 0), this pattern suggests a reverse incongruence effect in a broad sense, characterized by an overall decrease in SPP when FLCA and FLE are more incongruent. As illustrated in Figure 1, the response surface is generally symmetric around the LOIC, and SPP values tend to decline as FLCA and FLE move toward this line, which indicates that a greater incongruence between the two emotions generally predicts lower SPP. The combination of the highest FLCA and the lowest FLE is associated with the lowest SPP.
6. Discussion
As a conceptual replication of Botes et al. (Reference Botes, Dewaele and Greiff2022a), the present study investigated the joint effects of FLCA and FLE on SPP among Chinese EFL learners using PRRSA. In the following discussion, we examine both the similarities and differences between the two studies and provide theoretical and methodological implications as well as suggestions for future replication research.
RQ1: What are the distinctive linear predictive effects of FLCA and FLE on SPP when examined simultaneously in a single model?
Our findings partially align with Botes et al.’s (Reference Botes, Dewaele and Greiff2022a) findings regarding linear, individual predictive effects of FLCA and FLE on SPP. Specifically, we also found a significant negative predictive effect of FLCA on SPP, as reported in Botes et al. (Reference Botes, Dewaele and Greiff2022a). This finding is also consistent with a large body of empirical research that reported a negative relationship between FLCA and SPP in Chinese EFL contexts (e.g., Li et al., Reference Li, Dewaele and Jiang2020; Li & Wei, Reference Li and Wei2023). This consistent negative effect echoes the control-value theory (Pekrun, Reference Pekrun2006) in that anxiety can trigger task-irrelevant thinking and diminished focus, which is harmful to learners’ academic achievement.
We also noted some differences between Botes et al.’s (Reference Botes, Dewaele and Greiff2022a) findings and ours. The first difference is that we found a weaker negative effect of FLCA on SPP (β = −.230) compared to their results (β = −.285). Two possible reasons may help explain this difference. First, our study was conducted in a high-stakes, exam-oriented Chinese EFL context, where students tend to experience a high level of anxiety (Jiang & Dewaele, Reference Jiang and Dewaele2019; Wu & Zhang, Reference Wu and Zhang2025). According to the control-value theory, anxiety can both undermine attention and motivation and simultaneously motivate learners to exert extra effort to avoid failure (Li & Wei, Reference Li and Wei2023; Pekrun, Reference Pekrun2006). Thus, in the Chinese EFL context, where effort and achievement are highly valued, the positive, effort-driven effect of anxiety on SPP may be stronger than in other contexts. As a result, the detrimental effect of FLCA on SPP may be partially offset by its positive effect, resulting in a relatively weaker negative association in our sample than in Botes et al. (Reference Botes, Dewaele and Greiff2022a). Second, differences in participants’ L2 across samples may influence the strength of the negative relationship between FLCA and SPP. The negative relationship between FLCA and L2 achievement is weaker among learners of English than among learners of other L2s, according to Teimouri et al.’s (Reference Teimouri, Goetze and Plonsky2019) meta-analysis. Given that English is the most researched L2 and that many methodological advances and pedagogical interventions have been optimized within EFL contexts, EFL learners may benefit from more supportive, informative, and effective instructional environments (Teimouri et al., Reference Teimouri, Goetze and Plonsky2019). Moreover, the international status of English and the widespread presence of English in people’s daily lives may increase learners’ familiarity with the language (Teimouri et al., Reference Teimouri, Goetze and Plonsky2019). Thus, supportive instruction and increased language familiarity may result in a less negative effect of FLCA on SPP in our study than in the initial study.
The second difference lies in the predictive effect of FLE on SPP. In the present study, FLE moderately positively predicted SPP. However, in Botes et al.’s (Reference Botes, Dewaele and Greiff2022a) study, the predictive effect of FLE on SPP was not significant. Two possible reasons may account for this difference. First, age differences across samples may play a role. Younger learners tend to show a stronger association between FLE and self-perceived achievement than older learners, according to Botes et al.’s (Reference Botes, Dewaele and Greiff2022b) meta-analysis. Our participants were much younger (M age = 19.00) than those in Botes et al. (Reference Botes, Dewaele and Greiff2022a) (M age = 24.04). Thus, FLE was a significant predictor of SPP in our study but not in theirs. Second, the stronger effect of FLE on SPP in our study may be linked to the unique role that teachers play in Chinese EFL classrooms. In the Chinese EFL context, teachers typically hold a more central and authoritative position and exert a stronger emotional influence on learners compared with many European contexts, where teachers are often described as “conductors” rather than figures of unquestioned authority (Li et al., Reference Li, Jiang and Dewaele2018; Wu & Zhang, Reference Wu and Zhang2025). Because teacher-related enjoyment constitutes a substantial component of FLE, this important role that teachers play in Chinese EFL classrooms may intensify the extent to which FLE predicts learners’ SPP, resulting in a stronger predictive effect in our study than in the initial study.
The third difference involves the relative strength of the predictive effects of FLE and FLCA on SPP. In the present study, the strength of the predictive effect of FLE (β = .355) outweighed that of FLCA (β = −.230). However, in Botes et al.’s (Reference Botes, Dewaele and Greiff2022a) study, the strength of the predictive effect of FLCA (β = −.285) outweighed that of FLE (β = .025). One possible explanation for this discrepancy may relate to the differing levels of achievement across the two samples (our sample: M spp = 2.80; their sample: M spp = 3.73). Prior research suggests that the effects of emotions on SPP are moderated by learners’ achievement levels (Li et al., Reference Li, Dewaele and Jiang2020). To be specific, the relative strength of FLCA over FLE grows stronger as learners’ achievement level increases (Li et al., Reference Li, Dewaele and Jiang2020). Therefore, the lower overall achievement level in our sample likely amplified the effect of FLE, whereas the higher achievement level in Botes et al.’s sample may have strengthened the influence of FLCA.
RQ2: How do FLCA–FLE congruence and incongruence predict SPP?
When examining the effects of FLCA–FLE congruence and incongruence on SPP, our study shares similar findings with those of Botes et al. (Reference Botes, Dewaele and Greiff2022a). That is, we found a significant quadratic effect of FLE and an interaction between FLCA and FLE in the polynomial regression model. These findings indicate that the effect of FLE on SPP is nonlinear and that the effect of one emotion on SPP depends on the level of the other. Our findings support findings of Botes et al. (Reference Botes, Dewaele and Greiff2022a) and other empirical studies by revealing that the effect of emotion on L2 learning is not necessarily linear and that the emotions that learners experience are complex, interdependent, and capable of jointly exerting nuanced effects on L2 achievement (Li, Reference Li2025; Li et al., Reference Li, Dewaele and Jiang2020; Li & Wei, Reference Li and Wei2023; Zhu et al., Reference Zhu, Zhan and Yao2024). However, what is different from Botes et al. (Reference Botes, Dewaele and Greiff2022a) is that we found a significant quadratic effect of FLCA, whereas their study reported a nonsignificant effect. Our findings echo Horwitz (Reference Horwitz, Gkonou, Daubney and Dewaele2017) in that the relationship between FLCA and achievement is nonlinear rather than linear. The significant nonlinear effects of FLCA on SPP may be attributed to the unique L2 learning contexts of China, as we discussed earlier.
Moving to the response surface model, similar to Botes et al. (Reference Botes, Dewaele and Greiff2022a), we found that along the LOIC, the slope was strongly negative and the curvature was nonsignificant. This finding suggests a linear decline in SPP when FLCA increased and FLE decreased. This consistent finding across samples underscores the theoretical significance of incongruent emotions: high FLCA paired with low FLE is detrimental to how learners perceive their L2 proficiency (Li et al., Reference Li, Dewaele and Jiang2020; Li & Wei, Reference Li and Wei2023; Teimouri et al., Reference Teimouri, Goetze and Plonsky2019). Building on these consistent findings, we tentatively argue that the detrimental effect of high FLCA and low FLE on learners’ SPP is potentially generalizable across learning contexts.
Turning to the LOC, we found differences between Botes et al.’s (Reference Botes, Dewaele and Greiff2022a) findings and ours. Along the LOC, Botes et al. (Reference Botes, Dewaele and Greiff2022a) identified a negative slope and convex curvature, indicating that SPP decreased as FLCA and FLE increased together and that learners with low FLCA and low FLE showed the highest SPP. In contrast, the slope of the LOC in our study was nonsignificant, suggesting no consistent linear increase or decrease in SPP when both emotions rose in tandem. More importantly, the significant positive curvature indicated a U-shaped pattern: SPP was lower when both FLCA and FLE were at moderate levels than when emotions were both high or both low.
Drawing on both control-value theory and the broaden-and-build theory, we interpret the U-shaped pattern observed along the LOC through the lens of activation-based complementary functioning. According to the control-value theory, anxiety and enjoyment differ in valence and focus, yet both are activating emotions (Pekrun, Reference Pekrun2006). Building on this shared activation dimension, we propose that the complementary functioning between FLCA and FLE depends on activation thresholds that delineate two distinct emotional regimes. In a low-activation regime, low FLCA complements low FLE by minimizing cognitive interference, thereby supporting higher SPP (Pekrun, Reference Pekrun2006). In a high-activation regime, high FLE can complement high FLCA by providing the motivational and attentional resources needed to offset the negative effects of FLCA (Fredrickson, Reference Fredrickson, Csikszentmihalyi and Csikszentmihalyi2006). By contrast, when both emotions are at moderate levels, neither threshold is reached: learners may experience enough FLCA to interfere with performance, but not enough FLE to counteract the negative effect of FLCA on SPP. This mid-range state may result in lower SPP. This threshold-based interpretation implies that the relative strength of the negative effects of FLCA and of the positive effects of FLE may vary across activation regimes.
RQ3: Is FLCA–FLE congruence or incongruence more beneficial in predicting higher levels of SPP?
We also observed a difference between Botes et al.’s (Reference Botes, Dewaele and Greiff2022a) findings and ours in the (in)congruence effect. In the present study, we observed a reverse incongruence effect in a broad sense: SPP decreased as the incongruence between FLCA and FLE increased, with the lowest SPP occurring when FLCA was high and FLE was low. This pattern is supported by the alignment of the principal axis with the LOIC and the symmetric response surface around the LOIC in our dataset. In other words, emotional incongruence between FLCA and FLE generally predicted lower SPP for Chinese university EFL learners. By contrast, in Botes et al.’s (Reference Botes, Dewaele and Greiff2022a) international sample, proximity to the LOIC was not generally associated with lower SPP. That is, greater FLCA–FLE incongruence did not generally predict lower SPP. Graphically, visual inspection of their Figure 2 shows that the “valley” is shifted and skewed, and their principal axis parameters suggest deviation from the LOIC (a 5 = b 3 − b 5 = −.092 ≉ 0; Schönbrodt et al., Reference Schönbrodt, Humberg and Nestler2018). One possible explanation is that, in Chinese university EFL classrooms, teachers tend to play a central role and classroom structures are relatively uniform (Wu & Zhang, Reference Wu and Zhang2025). Such homogeneity may render the way FLCA and FLE interact more consistent across learners, leading to a globally symmetric pattern of the incongruence effect on the entire response surface. By contrast, in internationally diverse samples, classroom environments, teacher roles, and learner characteristics may vary widely, resulting in more variable FLCA–FLE combinations and less symmetrical patterns.
Botes et al.’s (Reference Botes, Dewaele and Greiff2022a) response surface model of self-perceived foreign language proficiency.

Figure 2 Long description
The image consists of two 3D surface plots labeled as Angle A and Angle B, depicting the response surface model of self-perceived proficiency. Both plots have three axes: Foreign Language Anxiety, Foreign Language Enjoyment and Self-Perceived Proficiency. The axes are marked with numerical values ranging from negative to positive. The surface in each plot is colored to indicate different levels of proficiency, with lines of congruence and incongruence drawn across the surfaces. In Angle A, the surface shows a valley-like structure with a peak at lower anxiety and higher enjoyment. In Angle B, the surface is more symmetrical, with a peak at similar conditions. Both plots illustrate how variations in anxiety and enjoyment affect self-perceived proficiency, with congruence lines indicating balanced states and incongruence lines showing deviations.
Since the incongruence effect was not a focus of Botes et al. (Reference Botes, Dewaele and Greiff2022a), our analysis extends their study by providing clear evidence of a reverse incongruence effect. These findings suggest that, for Chinese EFL learners, FLCA–FLE congruence is generally more beneficial for SPP than FLCA–FLE incongruence, and this effect appears stronger than in Botes et al.’s (Reference Botes, Dewaele and Greiff2022a) international sample. Indeed, L2 learners usually experience both positive and negative emotions even in the same learning task (Gregersen et al., Reference Gregersen, MacIntyre, Olsen, Gkonou, Daubney and Dewaele2017). As discussed earlier, the facilitating role of FLCA in SPP may be more relevant in Chinese L2 contexts where effort and attainment value are especially valued on one hand, and the positive effects of FLE may provide a buffer against negative emotions on the other (Li et al., Reference Li, Wei and Lu2023), resulting in the positive effect of FLE–FLCA congruence on SPP.
7. Future replication research
Several limitations of the present study and suggestions for future replication research warrant attention. First, our study was limited to a single educational level (i.e., university students), one learning context (i.e., the Chinese learning context), one L1 background (i.e., L1 Chinese), and one target language (i.e., L2 English). Future replication research could therefore examine the generalizability of our findings to broader populations. For example, researchers could replicate the design with primary, middle, or high school students to assess whether younger learners exhibit similar FLCA–FLE–SPP relationships. Replications in diverse learning contexts (e.g., European) would help uncover whether the geometry of the response surface is culturally contingent. Moreover, including learners with different L1 backgrounds (e.g., L1 Japanese) or examining other target languages (e.g., L2 Spanish) would allow researchers to test whether typological distance or language-specific learning demands moderate the observed effects.
Second, the emotions and SPP examined in this study were conceptualized at the trait level and treated as skill-general. Future replications could adopt multi-level measurement designs to capture varying degrees of situational specificity (Li, Reference Li2025). For instance, researchers could assess task-specific anxiety and enjoyment during tightly controlled activities (e.g., retelling tasks) to determine whether congruence effects differ across task types or cognitive load. Similarly, skill-specific measures of SPP (e.g., speaking) could clarify whether the positive impact of FLCA–FLE congruence is skill-specific.
Finally, because our replication study was cross-sectional, future replication research could consider employing longitudinal designs to capture the temporal and dynamic nature of FLCA, FLE, SPP, and their interaction in one model. Longitudinal designs with multiple assessment waves (e.g., weekly or biweekly measurements across a semester) would allow researchers to test whether emotional congruence predicts changes in SPP over time.
8. Conclusion
This conceptual replication study confirmed the key findings of Botes et al. (Reference Botes, Dewaele and Greiff2022a) and further extended them in the specific context of Chinese EFL learners. To our knowledge, this study constitutes the first replication in the field of L2 emotion research. By conceptually engaging with and extending Botes et al. (Reference Botes, Dewaele and Greiff2022a), our study supports the development of an evidence-based replication approach in L2 emotion research, where replication studies remain relatively rare. In addition, our study demonstrates the methodological value and applicability of PRRSA for modeling the complex interaction of L2 emotions. We conclude with a call for future research to replicate and extend existing L2 emotion research across diverse contexts to strengthen theoretical generalizability and uncover context-specific findings.
Acknowledgements
We would like to thank all the students who participated in this study. We are also grateful to the editor and anonymous reviewers for their constructive comments, which helped improve the manuscript.
Competing interests
The authors declared that they have no conflicts of interest.
Author contribution statement
W. S.: Conceptualization, methodology, software, investigation, formal analysis, writing – original draft; F. P.: Conceptualization, supervision, funding acquisition, writing – review and editing.
Wei Sun is a PhD candidate at the School of Foreign Languages, Huazhong University of Science and Technology, P.R. China. His research interests include the psychology of language learning and teaching and individual differences in foreign language learning. His recent publications have appeared in Social Sciences Citation Index SSCI-indexed journals, including System, Applied Linguistics Review, Journal of Language, Identity, and Education, International Journal of Applied Linguistics, among others. Email: weis@hust.edu.cn.
Fan Pan is a Professor of Applied Linguistics at the School of Foreign Languages, Huazhong University of Science and Technology, P.R. China. Her research interests include corpus linguistics, second language acquisition, and academic writing. Her publications have appeared in SSCI-indexed journals such as System, Journal of English for Academic Purposes, Journal of Second Language Writing, International Journal of Corpus Linguistics, Journal of Quantitative Linguistics, Text & Talk, among others. Email: panfan@hust.edu.cn.



 Open access

