A new concept of quality has been created due to a growing interest in the characteristics of food by consumers. This concept includes traditional attributes related to nutritive value, flavour, aroma or colour, as well as new indicators for animal products on ethical issues such as animal welfare and environmental impact of production systems (Luykx & van Ruth, Reference Luykx and van Ruth2008). The review of Martin et al. (Reference Martin, Cornu, Kondjoyan, Ferlay, Verdier-Metz, Pradel and Berdagué2005) in cattle shows the effort to find components that allow associating the milk composition with feeding cattle and prove the traceability and authentication of milk according to its origin or production system. The ability to demonstrate the feeding system used in livestock is an important element which could determine the choice of the consumer (Valenti et al. Reference Valenti, Martin, Andueza, Leroux, Labonne, Lahalle, Larroque, Brunschwig, Lecomte, Brochard and Ferlay2013). Diet influences the content of many molecules in milk: terpenes, phytanic acid, pristanic acid, skatole, antioxidants, fatty acids, etc. proposed as markers of production system (Wood et al. Reference Wood, Richardson, Nute, Fisher, Campo, Kasapidou, Sheard and Enser2003). Fatty acid profile of milk fat can be useful to prove the product origin and guarantee its quality. The inclusion in the diet of fresh forage, conserved forage or concentrates as the main ingredient can be distinguished based on the CLA isomers profile (Butler et al. Reference Butler, Collomb, Rehberger, Sanderson, Eyre and Leifert2009). Diets rich in fresh forage produce milk with more unsaturated fatty acids (Morales-Almaráz et al. Reference Morales-Almaráz, de la Roza-Delgado, González, Soldado, Rodríguez, Peláez and Vicente2011). While maize silage contains a high concentration of linoleic acid, which affects the milk composition with an increase in this fatty acid (Walker et al. Reference Walker, Dunshea and Doyle2004), cows fed hay based diets produce milk rich in linolenic acid (Shingfield et al. Reference Shingfield, Bonnet and Scollan2013). This is related to the transfer of specific compounds from feeds to milk and the formation of specific compounds by rumen microflora due to the diet effect. For that reason, milk fat fraction is a source of suitable biomarkers for the verification of grass feeding.
Pastured-based farming systems remain widely distributed in the European countries like France, Germany, the Netherlands or Ireland among others (Borreani et al. Reference Borreani, Coppa, Revello-Chion, Comino, Giaccone, Ferlay and Tabacco2013), and are oriented towards maximum milk yield per hectare (Knaus, Reference Knaus2016). However, in some regions the dairy industry has moved towards consistent year-round indoor feeding of cows, emphasising a high-input/high-output system that maximises annual milk production per cow (Knaus, Reference Knaus2016). The use of concentrates in dairy cow diets has increased in the last decades and the area available for grassland and forage crops has also changed. In the Netherlands, the area of land with maize forage has increased from nil in 1950 to 230 000 ha at the moment (Van Dijk et al. Reference Van Dijk, Schukking and Van der Berg2015), mainly due to converting grassland into maize. Nowadays, the dairy production has a large dependence of Usable Agricultural Area (UAA) destined to maize culture, with high dry matter yield potential per hectare, due to good soil fertility and favourable climate conditions. As a consequence, many of the dairy farms have specialised in maize silage production, representing up to 90% of the total roughage in lactating cow diets in Italy (Borreani et al. Reference Borreani, Coppa, Revello-Chion, Comino, Giaccone, Ferlay and Tabacco2013). A sample of 2% of a total of 2446 dairy farms was randomly selected and surveyed in the same region of this study (Jiménez-Calderón et al. Reference Jiménez-Calderón, Santiago, Martínez-Fernández and Vicente2015). Results from this survey showed that the best criteria to define dairy farms was the use of grazing and no grazing, and within the no grazing farms, the surface of UAA used for maize culture: less than 20, about 50 and more than 75% of UAA. However, ingredients of the dairy cows’ diet vary considerably throughout the year, because of the annual dynamic change of forage production, annual rotation of maize-Italian ryegrass and variation of nutrient requirements according to the physiological state of the animal. So, the crop area cannot always be associated directly with the ration.
The available scientific literature has reported the relationship between milk fatty acid profile and diet composition for controlled conditions or for tests taking place on the farm (Shingfield et al. Reference Shingfield, Bonnet and Scollan2013). However, these studies have mainly focused on the comparisons between extreme diets, between organic and conventional dairy production or between different geographical regions. For this reason, the aims of this study were to identify the different feeding systems actually used for dairy cows, and to explore the possibility of identify the feeding system using the analysis of milk composition and fatty acid profiles of milk fat considering the variability of feeds over a year.
Material and methods
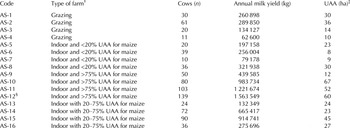
Sixteen dairy farms were selected based on the four production systems defined from surveys previously conducted in a sample of over 2% of bovine dairy farms that had quota in 2013 (Jiménez-Calderón et al. Reference Jiménez-Calderón, Santiago, Martínez-Fernández and Vicente2015). Each production system was represented by four farms. Table 1 provides a detailed description of the selected dairy farms. All farms were monitored during 1 year, with quarterly visits between summer 2014 and spring 2015. One dairy farm decided not to continue working in the study after performing the first sampling period, so the work does not include its results. At each visit, a survey was conducted about number of lactating animals, fresh feed offered, ingredient composition and milk production. The pasture intake of cows in grazing farms was estimated by subtracting from the theoretical daily dry matter (DM) intake, the DM supplied in the stall according to the information submitted by the farmer. The equation used for predicting DM intake of lactating Holstein cows was based on NRC (2001). This equation considers four per cent fat corrected milk (kg/d), body weight (kg) and week of lactation. In our study was applied an average body weight of 620 kg and cows in the middle of lactation.
Characteristics of the dairy farms monitored quarterly since summer 2014 to spring 2015

† Classification according Jiménez-Calderón et al. (Reference Jiménez-Calderón, Santiago, Martínez-Fernández and Vicente2015).
‡ UAA: Usable Agricultural Area.
§ The AS-12 farm decided not to continue working in the study after the first sampling.
One sample of freshly made ration was taken along the feeders from each farm and visit. As well, samples of each ingredient of the ration (i.e. silages, hay, straw, concentrates, etc.) were taken. In the grazing farms, pasture was sampled by cutting 1 kg of grass with a hand mower to a height of 6 cm from four different areas randomly chosen in the grazing plot. Milk samples were taken from the bulk tank, after stirring, with an even number of milkings. All samples were kept refrigerated and analysed immediately upon arrival at the laboratory. Total mixed ration and forage samples were dried (60 °C, 24 h) and milled (0·75 mm); concentrate samples were milled through a 1 mm screen. Feed samples were analysed for dry matter (DM), organic matter (OM), crude protein (CP) and neutral detergent fibre (NDF) by near infra-red spectroscopy (FOSS NIRSystem 5000, Silver Spring, MD, USA) through specific prediction equations developed by Animal nutrition laboratory of SERIDA, accredited by UNE-EN-ISO/IEC 17025 (Ref. No LE/930). Milk samples were analysed for fat, protein, lactose, solid non-fat and urea contents (MilkoScan FT 6000). The fatty acid (FA) proportion of milk fat was analysed according to standard methods ISO14156:2001/IDF172 for lipids extraction and ISO15885:2002/IDF184 for determination of the FA by GC-FID. The trans isomers trans6 18 : 1 and trans9 18 : 1 could not be separated during analysis, so theses isomers were pooled and referred to as trans6 + trans9 18 : 1.
Statistical analysis was performed using the R statistical package (R Core Team, 2014). A cluster analysis, with the ingredients in each farm and sampling period, was conducted in order to define the characteristics of feeding systems actually used. The squared Euclidean distance was used to calculate the sample similarities. The results of nutritive value of diets, milk performance and milk composition were analysed by ANOVA using identified feeding system and sampling period as main factors. When there were significant differences among feeding systems, the Duncan test was performed to compare differences between means for groups with different sizes. Finally, multivariate principal component analysis (PCA) with the milk composition and the milk FA profile were performed to find the causes of data set variability.
Results
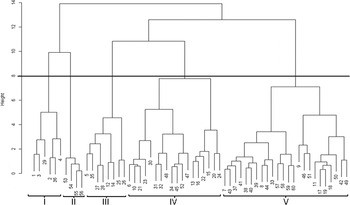
In each visit, the farmers provided information about individual dietary ingredients and amounts offered. The cluster analysis identified the different feeding systems actually used according to dry matter intake of ingredients in the 60 rations considered. The dendrogram generated (Fig. 1) shows the possibilities for different groups of rations that can be done according to the cuts at different heights arbitrarily chosen, indicating the similarity as a discriminating threshold to define the homogenous clusters. For discriminating feeding systems, the height of cut considered allowed to establish five cluster, then the feeding system identified were: (I) grazing; (II) maize silage; (III) grass silage; (IV) dry forage; and (V) concentrate. Two feeding systems (dry forage and concentrate), could have been subdivided into two each according to their maize silage content, but further analyses in milk yield and composition revealed that there were no differences between these subgroups. In consequence, these subgroups were not considered further.
Dendrogram of cluster analysis showing similarities among feeding systems. Category numbers mean code of ration. The line represents the threshold similarity value arbitrarily chosen for discriminating the homogenous clusters: I: Grazing; II: Maize silage; III: Grass silage IV: Dry forage; V: Concentrate.

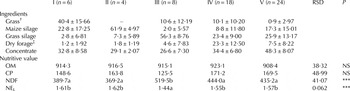
Table 2 shows the ingredient composition of rations in each identified feeding system, as well as the average nutritive value considering the 60 rations obtained after 1 year of monitoring fifteen dairy farms. The nutritive value meets the nutritive requirements of dairy cows. The average of crude protein was 162 g/kg DM, with no differences among feeding systems. The net energy for lactation was lower in system III than the others feeding systems (1·44 vs 1·57 Mcal/kg DM; P < 0·001).
Ingredient composition (%DM basis, average ± sd), nutritive value (g/kg DM) and net energy of lactation content (Mcal/kg DM) of each feeding systems identified

I, Grazing; II, Maize silage; III, Grass silage; IV, Dry forage; V, Concentrate.
n, Number of rations.
† Pasture or zero-grazing.
‡ Hays of grass, vetch-oat or lucerne, straw, etc.
OM, organic matter; CP, crude protein; NDF, neutral detergent fibre; NEL, net energy of lactation.
RSD, residual standard deviation.
a,bValues in the same row with different letters differ significantly. NS P > 0·05; ***P < 0·001.
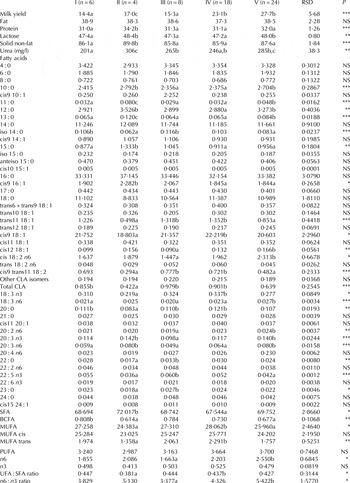
Table 3 shows daily milk production, milk composition and fatty acid profile according to feeding system. The greatest milk production was in the maize silage feeding system (37·0 l/d; P < 0·001), while the lowest milk production were in the grazing and grass silage feeding systems (14·4 and 15·3 l/d respectively). The others showed intermediate values. Furthermore, maize silage had the highest proportion of protein, solid non-fat and urea (34·2 g/l, 89·8 g/l and 306 mg/l, respectively, P < 0·001) than the other feeding systems. Both maize silage and concentrate systems had higher proportion of lactose than other systems (P < 0·01). There were no differences in fat proportion among feeding systems, however some differences were found in fatty acid profile. The maize silage system had the highest proportion of saturated fatty acids (72·02 g/100 gFA), showing statistical differences with dry forage system (67·54 g/100 gFA; P < 0·05), specially due to high proportions of fatty acids as 10 : 0, 11 : 0, 12 : 0, 13 : 0 and 15 : 0. The branched-chain fatty acid concentration was greater (P < 0·01) in grazing than maize silage or concentrate. The iso 14 : 0 concentration was higher in grazing and grass silage than maize or concentrate (P < 0·001). The proportion of monounsaturated fatty acid of maize silage (24·38 g/100 gFA) and concentrate (25·96 g/100 gFA) systems were lower (P < 0·05) than dry forage system (28·06 g/100 gFA), because the maize silage had lower (P < 0·05) concentration of cis9 18 : 1 and, with concentrate system, lower (P < 0·001) proportion of trans11 18 : 1. Although there were no differences in total polyunsaturated fatty acid proportion among feeding systems, the ratio between unsaturated and saturated fatty acid was lower with maize silage system than dry forage system (P < 0·05). The total CLA proportion was lower (P < 0·01) in maize silage than in others apart from concentrate, and the concentrations of cis9 trans11 CLA were lower in both maize silage and concentrate. The proportion of 18 : 3 n3 was lower in maize silage than dry forage (P < 0·05), and 18 : 3 n6 was greater (P < 0·001) in concentrate system than other systems apart from maize silage. Finally, the ratio of n6-to-n3 was greater in concentrate system than grass silage system.
Milk production (l/d), composition (g/l) and fatty acid profile (g/100 gFA) according to feeding system identified

I, Grazing; II, Maize silage; III, Grass silage; IV, Dry forage; V, Concentrate.
n, Number of rations.
SFA, saturated fatty acids; BCFA, branched-chain fatty acids; MUFA, monounsaturated fatty acids; PUFA, polyunsaturated fatty acids; UFA: unsaturated fatty acids.
RSD, residual standard deviation.
a,b,cValues in the same row with different letters differ significantly. NS P > 0·05; *P < 0·05; **P < 0·01); ***P < 0·001.
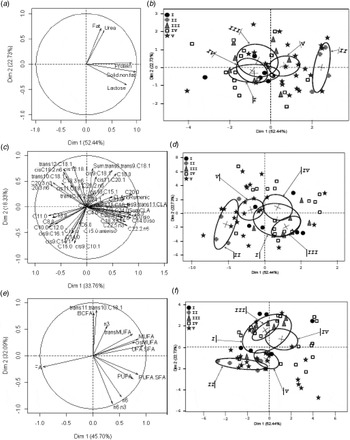
The multivariate PCA including fat, protein, lactose, urea, and solid non-fat of milk is shown in Fig. 2a. The three principal components explained up to 91·3% of the variability among groups. The first component explained 52·4% of the total variability, and the second component explained 22·7%. The projection of the milk composition variables on the planes defined by the main components showed that the solid non-fat, protein and lactose proportions had high positive correlations in component one (r = 0·98, r = 0·90, r = 0·80 respectively), while fat and urea showed high correlations in component two (r = 0·71 and r = 0·67 respectively). The third component explained 16·2% of the variability among groups, and had correlations of r = 0·63 and r = −0·63 with fat and urea respectively. When the standardised data on the principal components are combined into a confidence ellipse around the feeding systems, with a confidence level of 95%, the system II differs from the other groups (Fig. 2b). Although the centroid of the standardised data of the concentrate system is differentiated from grazing, grass silage and dry forage, its confidence ellipse partially overlaps with them. The fatty acid profile can explain up to 61·2% of the variability observed among groups with the three principal components (PC1 = 33·8; PC2 = 18·3; PC3 = 9·1%). In the projection of fatty acids on components one and two (52·1% of variance explained; Fig. 2c), high negative correlations were observed for the saturated fatty acids 8 : 0 (r = −0·61); 10 : 0 (r = −0·72); 11 : 0 (r = −0·74); 12 : 0 (r = −0·74) and 13 : 0 (r = −0·66) in both components and in the same direction. In addition, the 20 : 3 n3 and 20 : 3 n6 showed a negative correlation with the second component (r = −0·65 and r = −0·70, respectively). Figure 2d shows the normalised data grouped with a confidence interval of 95% on the principal components according to the feeding system. Maize silage, with the highest proportion of saturated fatty acids, differs from other feeding systems. Similarly to the chemical composition of milk, the centroid of the standardised data of the concentrate system is differentiated from the grazing, grass silage and dry forage, however once again the confidence ellipse partially overlaps with them. In order to simplify the analysis and to improve prediction if possible, multivariate PCA with the total saturated, monounsaturated, polyunsaturated and unsaturated fatty acid, n3 and n6 fatty acids, as well as the ratios between them were made (Fig. 2e). The results can explain up to 93·5% of the variability observed among groups (PC1 = 45·7; PC2 = 32·1; PC3 = 15·7%). High negative correlation between component one and saturated fatty acids was observed (r = −0·95), and positive correlation with monounsaturated and polyunsaturated fatty acids (r = 0·85 and r = 0·76, respectively). Furthermore, the unsaturated-to-saturated ratio and polyunsaturated-to-saturated ratios had positive correlation with component one (r = 0·85 and r = 0·76, respectively). The component two had high negative correlation with n6 fatty acids (r = −0·78) and with the n6-to-n3 ratio (r = −0·90). The standardised data on the principal components combined into a confidence ellipse at level of 95% is showed in Fig. 2f. Similar as described above, maize silage differs from other feeding systems, and the confidence ellipse of the concentrate system partially overlaps with the grazing, grass silage and dry forage systems.
Biplots of the Principal Component Analysis (PCA) ordination performed for the feeding systems identified. (a) for composition of milk; (b) confidence ellipses around the feeding systems according to composition of milk; (c) for fatty acid profile of milk; (d) confidence ellipse around the feeding systems according to fatty acid profile; (e) sum and ratios of milk fatty acids; and (f) confidence ellipse around the feeding systems according to sum and ratios of milk fatty acids.

Discussion
The monitored farms in this work can be considered as representative of Spanish Atlantic Arc dairy farms, which represent around 60% of total Spanish milk production and around 80% of total dairy cows. More specifically, the Principality of Asturias produces around 10% of total Spanish milk production. The monitored farms grouped around 1·5% of the Spanish Atlantic Arc milk production. The average milk yield of farms was 9500 l/cow and 16 600 l/ha. These values are included in the range reported for farming systems in Europe (McCarthy et al. Reference McCarthy, Delaby, Pierce, Journot and Horan2011). The classification criteria of dairy farms based on the use of grazing and the proportion of UAA to grow maize (Jiménez-Calderón et al. Reference Jiménez-Calderón, Santiago, Martínez-Fernández and Vicente2015) does not take into account the fluctuations in the feed throughout the year, because herds rarely keep the same ration all-year round. In our study, only two dairy farms maintained the same ingredients throughout the year, although with different proportion among periods. Therefore, the cluster analysis allowed the classification of feeding systems taking into account the variation of the ingredients making up the rations in each sampling. Several options to establish clusters were performed. As the number of clusters was increased, the similarity within groups also increased, because further analysis on the composition of milk, comparing possible subgroups did not provide differences (data not shown). The different proportions of grass silage in the dry forage system and maize silage in the concentrate system did not provide additional information. For this reason, five clusters were chosen to differentiate the feeding systems actually employed.
The studied systems exhibited great variation in milk composition and milk fatty acid profiles. That was expected, especially in milk of grazing cows. However, differences in the proportion of milk fat had not previously been observed among feeding systems (Kay et al. Reference Kay, Roche, Kolver, Thomson and Baumgard2005), while some authors have found significant increases in the percentage of fat in housed dairy cows than in grazing cows (Morales-Almaráz et al. Reference Morales-Almaráz, de la Roza-Delgado, González, Soldado, Rodríguez, Peláez and Vicente2011; Capuano et al. Reference Capuano, Van der Veer, Boerrigter-Eenling, Elgersma, Rademaker, Sterian and Van Ruth2014; Mitani et al. Reference Mitani, Kobayashi, Ueda and Kondo2016). This lack of difference could be due to the similar forage-to-concentrate ratio among the non-concentrate systems. Probably extreme systems are needed to show variation in milk fat. The milk fat depression in grazing cows could be caused by low fibre intake (Sutton, Reference Sutton1989). However, Slots et al. (Reference Slots, Butler, Leifert, Kristensen, Skibsted and Nielsen2009) reported higher concentration of fat in extensive dairy farms than in intensive dairy farms. The work of these authors may have a breed effect, since while animals in intensive farms were Holstein cows, the extensive herds were crossbred Holstein-Jersey. Borreani et al. (Reference Borreani, Coppa, Revello-Chion, Comino, Giaccone, Ferlay and Tabacco2013) monitored five different feeding strategies in twenty dairy farms, and reported no differences in the milk fat content for high proportion of concentrate strategy (30·5% of concentrate) and grass strategy (15·2%). Both strategies had different NDF content. However, in our study, the grazing system provides 32·8% of concentrate, while concentrate system provides 48·3%, but both with similar NDF proportion. The concentrations of protein and urea were higher in the maize silage system, which was based on a high level of maize silage and concentrates (62 and 29% respectively). This could have increased the intake of metabolisable energy as well as the rate of microbial protein synthesis and the concentration of propionate in the rumen, and it would result in an increase in milk protein (Sutton, Reference Sutton1989). The urea nitrogen elevation in milk could be caused by high degradable protein intake from the concentrate or a mismatch of crude protein and easily digestible carbohydrate intake (Bargo et al. Reference Bargo, Muller, Delahoy and Cassidy2002). The concentration of lactose in milk shows little variation in healthy cows and is rarely influenced by feeding. The increase in the proportion of lactose has been associated with increases in the energy supplied in the diet (Argamentería et al. Reference Argamentería, Vicente, Martínez-Fernández, Cueto and Roza-Delgado2006). Westreicher-Kristen et al. (Reference Westreicher-Kristen, Kaiser, Steingass and Rodehutscord2014) indicate that protein supplements seem to have a significant influence on the concentration of lactose in milk. Liu et al. (Reference Liu, Schingoethe and Stegeman2000) found high lactose content associated with a low lysine in blood, and hypothesised that if the lysine is not properly balanced in the diet and is not sufficient for the synthesis of milk protein, this causes an excess of other amino acids used for gluconeogenesis. The possible excess of amino acids results in deamination of unused amino acids, urea synthesis in the liver and increased milk urea excretion. However, Nousiainen et al. (Reference Nousiainen, Schingfield and Huhtanen2004) indicate that protein intake has more impact on the urea in milk than amino acids absorbed but not used for the synthesis of milk protein.
Variations in the fatty acid profile were found due to feeding systems, especially well-defined for the maize silage system. This included the highest proportions of 16 : 0, 14 : 0 and 12 : 0, well known for their inverse relationship with human health, by producing high concentrations in plasma of cholesterol and low density lipoprotein. As well as, this system showed the lowest proportions of 18 : 0 and 18 : 3 n3, in agreement with others (Slots et al. Reference Slots, Butler, Leifert, Kristensen, Skibsted and Nielsen2009). That results in the lowest unsaturated-to-saturated ratio and the greatest n6-to-n3 ratio, all contributing to a poorer fatty acid profile for human health in this system. Both the maize silage and concentrate systems showed the lowest concentrations of cis9 trans11 18 : 2 and trans11 18 : 1, as described by Griinari & Bauman (Reference Griinari, Bauman, Sejrsen, Hvelplund and Nielsen2006). The high level of 18 : 2 n6 in milk from the concentrate system seems to be caused by a low forage-to-concentrate ratio, because lipids of cereals are mainly constituted by 18 : 2 n6, whereas the fat of pasture and grass silage are dominated by 18 : 3 n3 (Hernández-Ortega et al. Reference Hernández-Ortega, Martínez-Fernández, Soldado, González, Arriaga-Jordán, Argamentería, de la Roza-Delgado and Vicente2014). A low forage-to-concentrate ratio could produce a fatty acid profile more saturated and a lack of short- and medium-chain fatty acid for the synthesis of unsaturated fatty acids, as appears to happen with the concentrate system (52% forage). This could also be seen in the maize silage system; maize silage provides around 30% of concentrate and 70% of forage (Martínez-Fernández et al. Reference Martínez-Fernández, Argamntería and Roza Delgado2014) due to its starch and plant cell wall contents. Thus, the actual percentage of forage in this system would be reduced approximately from 71% to around 50%, which is equivalent to the forage-to-concentrate ratio for the concentrate system. The other feeding systems identified offer fresh forage, as grazing or zero-grazing, and showed, in general, high proportions of 18 : 0, cis9 18 : 1, trans11 18 : 1 and cis9 trans11 18 : 2, and high unsaturated-to-saturated and low n6-to-n3 ratios. That could be explained by the forage proportion in the cow diet in these systems. The ruminal fermentation of forages provides precursors of unsaturated fatty acids, such as acetate (Bargo et al. Reference Bargo, Muller, Delahoy and Cassidy2002). The n6-to-n3 ratio was <4 in the grazing and grass silage systems, which is closer to recommendations for human nutrition (Simopoulos, Reference Simopoulos2002). The contents of CLA in milk from the grazing, grass silage and dry forage systems, and trans11 18 : 1 in grass silage and dry forage, were high compared with the other systems which can be explained by the intake of pasture in these systems. Herbage is a rich source of polyunsaturated fatty acids, especially of 18 : 3 (Elgersma et al. Reference Elgersma, Tamminga and Ellen2006). A high content of polyunsaturated fatty acids in rumen could affect the biohydrogenation of 18 : 2 n6 (Troegeler-Meynadier et al. Reference Troegeler-Meynadier, Bret-Bennis and Enjalbert2006) and, therefore, could also affect the presence of intermediate products in milk, with higher contents of trans11 18 : 1, cis9 trans11 18 : 2 and 18 : 3 n3 in milk. Elevated cis9 trans11 18 : 2 and trans11 18 : 1 contents in milk under grazing-based management had been reported (Morales-Almaráz et al. Reference Morales-Almaráz, de la Roza-Delgado, González, Soldado, Rodríguez, Peláez and Vicente2011), as a result of a greater input of 18 : 3. The greater concentration of cis9 trans11 18 : 2 in milk from the grass silage and dry forage systems, linked with the greater values of trans11 18 : 1 are in agreement with Borreani et al. (Reference Borreani, Coppa, Revello-Chion, Comino, Giaccone, Ferlay and Tabacco2013), indicating the relationship between the substrate (trans11 18 : 1) desaturated to cis9 trans11 18 : 2 in the mammary gland by Δ9-desaturase. Due to the metabolic pathways involved, high values of trans11 18 : 1 are evident in the grazing system, maintaining a ratio with cis9 trans11 18 : 2 between 2 to 2·5, as indicated by Elgersma et al. (Reference Elgersma, Tamminga and Ellen2006). The high proportion of branched-chain fatty acids in the grazing system agrees with results reported by Borreani et al. (Reference Borreani, Coppa, Revello-Chion, Comino, Giaccone, Ferlay and Tabacco2013) when describe a feeding system based on fresh herbage. These authors explain it by the greater proportion of roughage and lower proportion of concentrate, because fibre-rich diets could favour rumen cellulolytic bacteria, whose membrane lipids are the major source of branched-chain fatty acids in milk (Vlaeminck et al. Reference Vlaeminck, Fievez, Cabrita, Fonseca and Dewhurst2006). Consequently, the maize silage and concentrate systems had the lower proportion of branched-chain fatty acids in milk because those systems would have the greater proportion of starch, so could favour rumen amilolytic bacteria at the expense of cellulolytic bacteria.
The principal component analysis distinguishes the maize silage system from other feeding systems, both from the milk composition and milk fatty acid profile. Similarities with other studies were found, with negative correlations of saturated fatty acids between 8 and 16 carbons with 18 : 0 and cis9 18 : 1 (Larsen et al. Reference Larsen, Andersen, Kaufmann and Wiking2014). Średnicka-Tober et al. (Reference Średnicka-Tober, Barański, Seal, Sanderson, Benbrook, Steinshamn, Gromadzka-Ostrowska, Rembiałkowska, Skwarło-Sońta, Eyre, Cozzi, Larsen, Jordon, Niggli, Sakowski, Calder, Burdge, Sotiraki, Stefanakis, Stergiadis, Yolcu, Chatzidimitriou, Butler, Stewart and Leifert2016) found positive association between maize silage and saturated fatty acids in a meta-analysis of 196 papers. PCA is capable of distinguishing the maize silage system from the others, but an unequivocal discrimination was not possible among the other feeding systems because of their similarity in milk fatty acid profile. The 16 : 0, cis9 16 : 1, 18 : 0 and cis9 18 : 1 have been categorised as fatty acids to discriminate grazing milk because they were distributed in two clear normal distributions between grazing or confinement seasons (Mitani et al. Reference Mitani, Kobayashi, Ueda and Kondo2016). These fatty acids are the dominant fatty acids in milk; thereby have a greater power in the discrimination analysis than trans11 18 : 1 and cis9 trans11 18 : 2. The content of latter fatty acids and the 18 : 3 n3 have previously been the focus of study, because are functional fatty acids and are doubled during the grazing season (Slots et al. Reference Slots, Butler, Leifert, Kristensen, Skibsted and Nielsen2009; Capuano et al. Reference Capuano, Van der Veer, Boerrigter-Eenling, Elgersma, Rademaker, Sterian and Van Ruth2014), although they could not distinguish between grazing seasons. The milk fatty acid profile varies to a great extent according to herbage characteristics, diet formulation, season, altitude, method of herbage conservation (hay or silage), botanical composition, phenological stage, etc. (Capuano et al. Reference Capuano, Van der Veer, Boerrigter-Eenling, Elgersma, Rademaker, Sterian and Van Ruth2014). In our study, grazing supplies around 40% of fresh forage, and grass silage and dry forage systems supply 10%, and this did not allow differentiation clearly from one to another. Therefore, to distinguish the grazing milk, dairy farmers need a high dependency on pasture, and need to avoid supplying excess supplementary feeds.
In conclusion, the milk from dairy cows managed under a feeding system based on maize silage could be distinguished from the rest of feeding systems due to the high concentrations of protein, lactose, solid non-fat and urea in milk, and the high proportions of saturated fatty acids and low concentration of 18 : 0, trans11 18 : 1, cis9 18 : 1 and 18 : 3. The concentrate system partially overlapped with the grazing, grass silage and dry forage systems. The latter systems had the highest concentrations of 18 : 0, cis9 18 : 1, trans11 18 : 1 and 18 : 3, but we could not distinguish between them in our conditions.
Authors express their gratitude to dairy farmers who participated in this study. Also, our thanks are given to staff of Animal nutrition laboratory (SERIDA) for laboratory support, as well as T. Dagnac from INGACAL-CIAM for fatty acids analysis and LILA Asturias for milk analysis. Work supported by Project INIA RTA2012-00065-C05-01 cofinanced by ERDF funds. J.D. Jiménez-Calderón is the recipient of an INIA Predoctoral Fellowship.