INTRODUCTION
Total potato crop production has been increasing rapidly in the last three decades; 364 million tonnes (t) are produced worldwide (FAO 2014). Potato is one of the most important crops in Spain. Approximately 2·1 million tonnes is produced on 73 900 ha area, an average productivity of c. 30 t/ha (FAO 2014). In addition, potato has high water requirements, c. 6500 m3/ha in the area analysed.
Water stress in potato crops has a negative effect on cell expansion (Shock et al. Reference Shock, Feibert and Saunders1998), reducing leaf area. Several studies have shown that limited soil water availability at different growth stages causes decreases in plant growth, number of tubers, tuber size, and tuber yield and quality (Yuan et al. Reference Yuan, Nishiyama and Kang2003; Onder et al. Reference Onder, Caliskan, Onder and Caliskan2005).
Photorespiration in potatoes, a C3 plant, causes a decrease in photosynthetic efficiency, especially under high temperatures when stomatal function is affected by increased transpiration. In these circumstances, the stomata close to prevent water deficit in the plant (Sun et al. Reference Sun, Yang, Wang and Ort2009).
The photosynthetically active radiation (PARa) absorbed by a plant depends on the ability of the individual plant or the canopy to intercept incident radiation. This is linked to the phenological stage of development and plant morphology, in particular the leaf angle distribution and leaf area index (LAI) of the plant canopy (Gosse et al. Reference Gosse, Varlet-Grancher, Bonhomme, Chartier, Allirand and Lemaire1986; Rahman et al. Reference Rahman, Stanley, Lamb and Trotter2014). The LAI and green canopy cover (GCC) are parameters related to growth, photosynthesis, transpiration, interception of radiation and energy balance (Kucharik et al. Reference Kucharik, Norman and Gower1998), with effects on environmental and crop relationships. Nevertheless, few studies have analysed the relationships of LAI with GCC.
Generally, in the absence of water deficit, increases in dry matter accumulation may be attributable to increased absorption of incident PAR or to improved conversion of absorbed PAR into dry matter (Sinclair & Muchow Reference Sinclair and Muchow1999). According to Monteith (Reference Monteith1977), predicting the amount of total dry matter (TDM) produced by crops is important for crop yield modelling. Changes in biomass production can be due to differences in the ability of a crop to convert solar radiation (SR) into biomass.
The aim of the current research was to analyse the effect of four water irrigation treatments on radiation use efficiency (RUE) and its relationships with LAI, GCC and TDM for potato (Solanum tuberosum L.) cv. Agria.
MATERIALS AND METHODS
Experimental design
The field experiment was conducted during the 2011 and 2012 growing seasons in an experimental plot irrigated with a centre pivot system in Aguas Nuevas, Albacete, Spain (38°55′ N; 1°55′O; 696 m a.s.l.). The soil is classified as Torriorthents (USDA 2006), with loamy texture and medium depth (>600 mm).
The local climate is classified as Warm Mediterranean (Papadakis Reference Papadakis1960), characterized by a warm thermal regime. The lowest average monthly temperature is in January (3·8 °C), and the hottest period is between June and August (monthly averages 21·5–24·4 °C). Average annual rainfall is c. 360 mm, ranging from 4·1 (July) to 46·1 mm (October) per month. The accumulated annual reference evapotranspiration (ETo) is c. 1296 mm. During the irrigation seasons, the maximum temperature was higher in 2012 (40·7 °C) than in 2011 (34·8 °C). The average monthly net radiation ranged from a low of 7·0 MJ/m (December) to a high of 29·0 MJ/m (July).
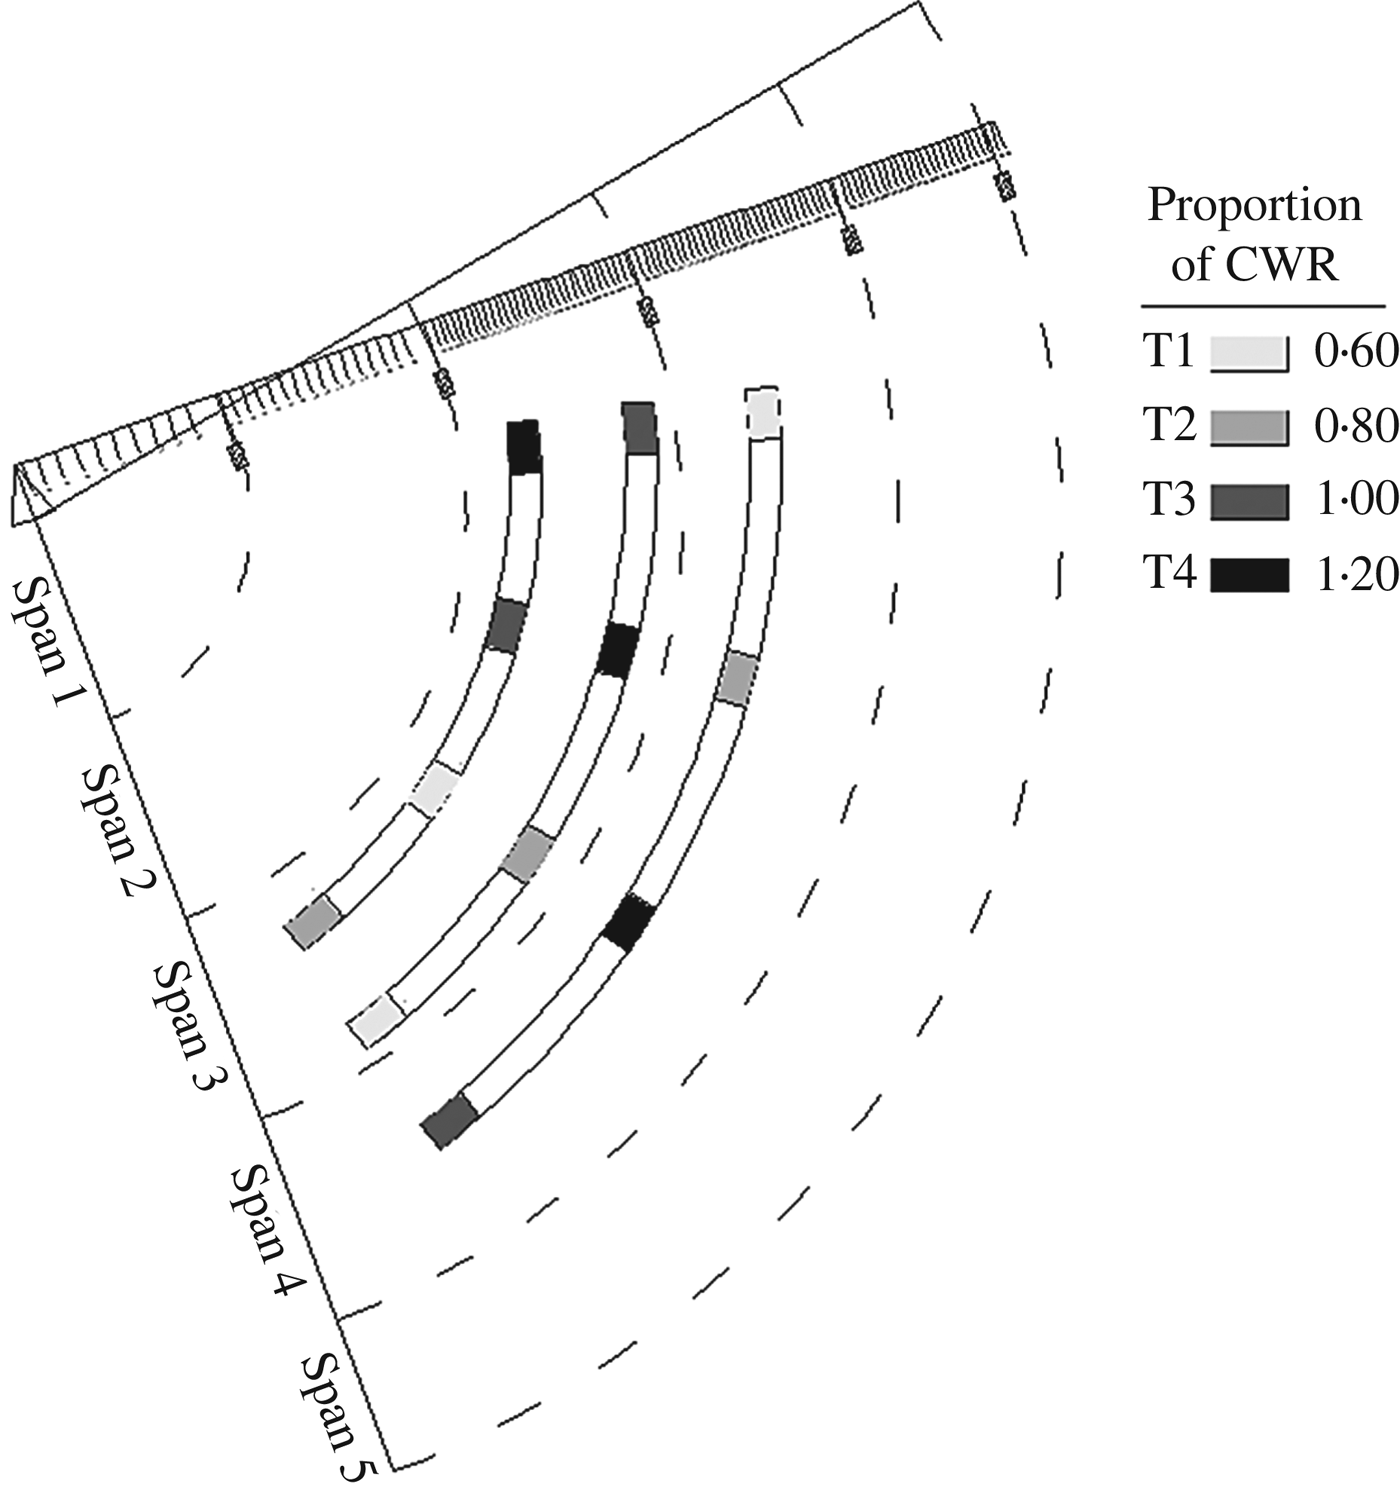
The experimental plot covered one quarter (4·9 ha) of the total area (18·4 ha). The irrigation system had five spans, each with sprinklers equipped with pressure regulators set to an output pressure of 140 kPa. The lateral pipe was 168·3 mm in diameter. The design flow rate was 86·4 m3/h with a system capacity of 1·3 litres/s/ha. Rotating Spray Plate Sprinklers (Rotator®, manufactured by Nelson Irrigation Co, Walla Walla, Washington, USA) were installed at a height of 1·4 m on all spans. The experimental design included 12 treatment plots, spatially distributed between the third and fourth spans. Each treatment plot was 6 m wide and 10 m long (60 m2) (Fig. 1). The pivot irrigation system was equipped with electric valves controlled by one irrigation programmer per span. During the irrigation of a quarter-circle, valves opened and closed in the different spans to perform the different irrigation treatments. Using data from an agrometeorological station located 150 m from the plot, reference ETo was calculated on a daily basis with the Penman–Monteith semi-empirical model (Allen et al. Reference Allen, Pereira, Raes and Smith1998). Irrigation was scheduled using a simplified water balance method within the root zone, according to the methods of the Food and Agriculture Organization (FAO) methodology (Pereira & Allen Reference Pereira, Allen, van Lier, Pereira and Steiner1999).
Experimental quarter section of the centre pivot, showing the location of the 12 experimental plots and irrigation treatments. CWR, crop water requirements.

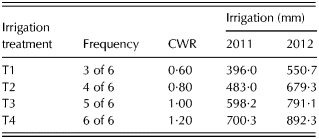
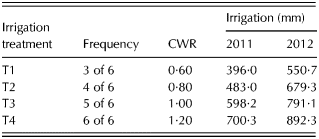
The experimental design of the pivot irrigation system was useful to create differences in irrigation frequency, resulting in four irrigation treatments with 0·60, 0·80, 1·00 and 1·20 of crop water requirements (CWR). The irrigation frequency was based on six centre pivot paths, applying the same dose in a given period of time. Irrigating in five of the six scheduled irrigation events (for a period of time) resulted in complete satisfaction of the CWR in that period, as determined using FAO Penman–Monteith procedures (Allen et al. Reference Allen, Pereira, Raes and Smith1998; Pereira & Allen Reference Pereira, Allen, van Lier, Pereira and Steiner1999). The average amount of water applied to each treatment is shown in Table 1. Irrigation began on 07 April (27 days after emergence (DAE)) in 2011 and 03 April (17 DAE) in 2012 and ended on 5 August (112 DAE) in 2011 and 30 August (119 DAE) in 2012.
Sample irrigation scheduling in the four treatments and per cent satisfaction of crop water requirements (CWR)
Control of water application
The total water applied (irrigation plus effective precipitation) during the experiment (25 irrigation events) was evaluated following the methodology described in Merriam et al. (Reference Merriam, Shearer, Burt and Jensen1980) and Heermann (Reference Heermann1990), as well as International ANSI/ASABE Standards S436·1 (ANSI/ASABE Standards 2001) and ISO-11545 (ISO 2001). The coefficient of uniformity (CU) ranged from 88 to 92% in 2011 and 81 to 93% in 2012. The average accumulated CU for the two seasons studied was 91 ± 4·2%. In addition, the uniformity of distribution (UD) was 82–86% in 2011 and 80–91% in 2012.
Crop data
Potato tubers were planted 35 cm deep on 9 March 2011 and 17 March 2012. Plant density did not differ significantly among treatments in either year, ranging from 5·1 to 6·2 plants/m2 in 2011 and 5·7 to 6·1 plants/m2 in 2012. Pre-emergence weed control was accomplished with metribuzin (70%) at a dose of 0·6 kg/ha. Disease control was conducted with two treatments of Tiametoxane (25%) and Metalaxil-M (80%) + Folpet (40%) at the onset of flowering and of the tuber stage, and at the end of the flowering stage. Plots were fertilized with a 8–15–15 (N–P–K) fertilizer (800 kg/ha).
To determine the dry matter content in the laboratory during crop development, crop sampling was conducted every 10–15 days. At each sampling, two plants were collected at random from each experimental plot (60 m2). The crop growth development and phenological stage of the selected plants was representative of the other plants in each experimental plot, so with three repetitions per irrigation treatment and 12 experimental plots it is believed that this number of plants was sufficiently representative. In the laboratory, the dry matter content of leaves, aerial and underground stems, roots and tubers was determined, and the leaf area was determined from an automated infrared imaging system, LI-COR-3100C (LI-COR Inc., Lincoln, NE, USA). The LAI was then computed from leaf area and plant density.
Sampling began on 23 May (38 DAE) in 2011 and 18 May (17 DAE) in 2012 and ended on 5 August (112 DAE) in 2011 and 30 August (119 DAE) in 2012. Yield was determined for each irrigation treatment after manual harvesting of 18 m2 from the centre of the experimental plot (60 m2). Harvesting dates were 8 August (120 DAE) in 2011 and 5 September (125 DAE) in 2012.
Radiation absorption
The balance for the calculation of absorbed PARa is defined in Eqn (1) (Varlet-Grancher et al. Reference Varlet-Grancher, Gosse, Chartier, Sinoquet, Bonhomme and Allirand1989; Dong & Wu Reference Dong and Wu2012; Guillén-Climent et al. Reference Guillén-Climent, Zarco-Tejada and Villalobos2014):
 $${\rm PAR}_{\rm a} \, = \,({\rm PAR}_{\rm o} + {\rm PAR}_{\rm s} )-({\rm PAR}_{\rm g} + {\rm PAR}_{\rm t} )$$
where PARa is PAR absorbed by the crop (μmol/m2/s) and the subscripts refer to: o, above the canopy; s, reflected by the soil below the canopy; g, reflected by the canopy, including radiation reflected by the soil but not absorbed prior to reaching the top of the canopy and t, transmitted through the canopy to the soil surface.
To determine radiation absorption during the crop growth stages, plants were sampled and data collected six times in 2011 and nine times in 2012, coinciding with the sampling of dry matter content. Measurements were taken using a SunScan™ canopy analysis system (Delta-T Devices Ltd., Cambridge, UK), according to the methods of Gallo & Daughtry (Reference Gallo and Daughtry1986), Varlet-Grancher et al. (Reference Varlet-Grancher, Gosse, Chartier, Sinoquet, Bonhomme and Allirand1989) and Hall et al. (Reference Hall, Connor and Sadras1995) for sensor placement. Sampling was carried out five times in each of the 12 experimental plots on days with <0·20 cloud cover at solar noon (±1 h). The light absorbed by the canopy (ε a) was expressed as a ratio of incident PAR flux (ε a = PARa/PARo).
Cumulative absorbed photosynthetically active radiation (PARac) was estimated by calculating the product of daily ε a and daily incident photosynthetically active radiation (PARoi). The PARoi was calculated from total SR using the equation PARoi = 0·48 SR, with PARoi and SR expressed in MJ/m2/day (Szeicz Reference Szeicz1974; Varlet-Grancher et al. Reference Varlet-Grancher, Bonhomme, Chartier and Artis1982). Daily total SR was measured with a Campbell Scientific radiometer (300–2800 nm) and an automatic data logger (Campbell Scientific, Logan, UT, USA) at the agroclimatic station in the study area.
The extinction coefficient (K) was determined by the correlation between daily values of ε a and LAI (Varlet-Grancher et al. Reference Varlet-Grancher, Gosse, Chartier, Sinoquet, Bonhomme and Allirand1989). Finally, RUE (g/MJ) was estimated from the relationship between the accumulated TDM content (g/m2) and accumulated PAR absorbed (MJ/m2) (RUE = TDMac/PARac).
Determination of green canopy cover with an unmanned aerial vehicle
A microdrone md-400 (Microdrones, Inc., Kreuztal, Germany) was used to determine GCC. This vertical take-off and landing quadracopter aircraft employs four rotors or propellers on vertical shafts mounted in one level on the frame (Córcoles et al. Reference Córcoles, Ortega, Hernández and Moreno2013; Ballesteros et al. Reference Ballesteros, Ortega, Hernández and Moreno2014a). A global positioning system (GPS) on the aircraft reports its location and approximate geo-referencing data for the pictures.
Aerial photographs were taken with a conventional digital compact camera (PENTAX™, Golden, CO, USA) with an integrated zoom lens and 12 MP resolution. This device has internal memory (21 Mb) and a secure digital memory card.
The flights were scheduled by phenological stage and coincided with sampling days for the analysis of crop growth, if the environmental conditions were favourable (wind speed of 5 m/s or less). In 2011, eight flights were conducted (five during crop development and three during senescence). However, in 2012, it was only possible to conduct five flights (three during crop development and two during senescence) because of high wind speeds on some sampling days. Flight altitude was c. 40 m, which meant a ground sample distance of 0·015 m. The sidelap was 40%, and overlap was 60%. The overlap ensures proper photogrammetry alignment. The products of the photogrammetric processing were the ortho-image and the point cloud used to create the Digital Surface Model.
Green canopy cover was computed using LAIC software (Córcoles et al. Reference Córcoles, Ortega, Hernández and Moreno2013; Ballesteros et al. Reference Ballesteros, Ortega, Hernández and Moreno2014a). The process started with image acquisition with the unmanned aerial vehicle (UAV) described above, followed by image production performed with Photoscan software (Agisof PhotoScan©, RU). After the ortho-image was obtained, a cluster analysis of the Red–Green–Blue levels of the image was conducted to group the pixels into vegetation (green above ground part of the crop) and non-vegetation portions, i.e., the soil, shadows, stones, etc.
RESULTS
Measured values of leaf area index and total dry matter
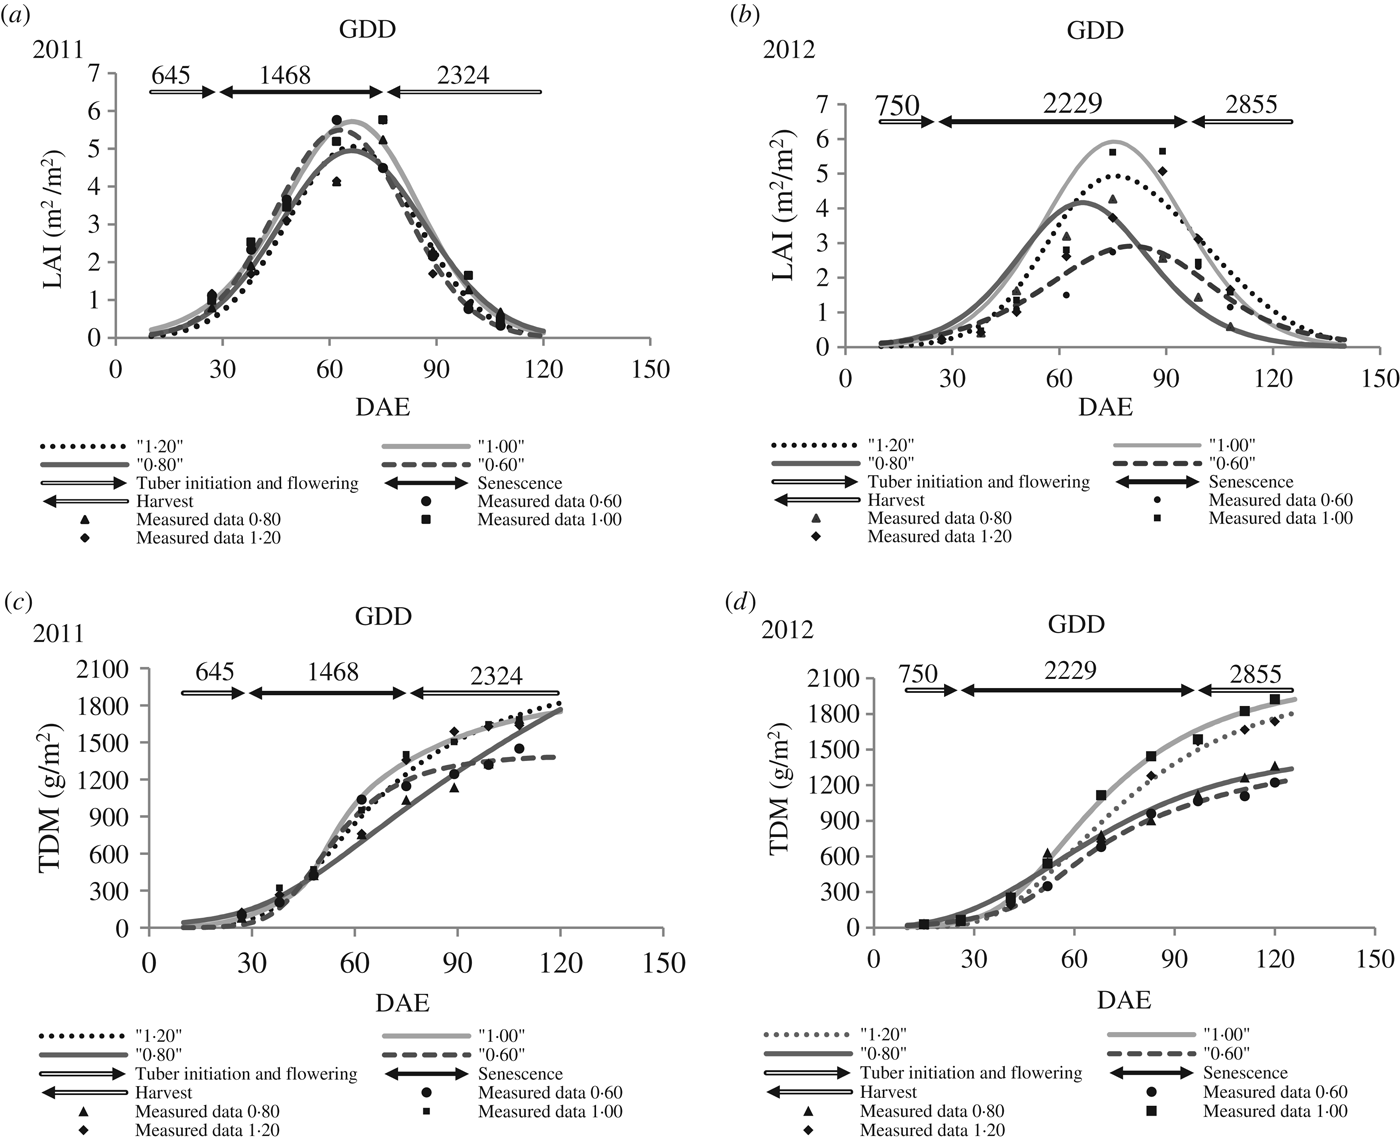
The progression of LAI during each irrigation season was estimated from a quadratic expo-polynomial model. This model produced the best fit between the simulated and observed data (R 2 = 0·95 ± 0·042); differences among the 12 study plots were statistically significant (P < 0·05). In 2011, the different irrigation treatments had no effect on the progression of LAI during the growing cycle (Fig. 2(a)). Maximum LAI for the 1·20, 1·00 and 0·80 irrigation treatments occurred at 75 DAE (end of flowering and onset of senescence with 1446 growing degree days (GDD)); maximum LAI value occurred earlier (at 62 DAE with 1163 GDD) in the 0·60 irrigation treatment. Maximum LAI did not differ significantly among the irrigation treatments, ranging from 5·2 to 5·7 m2/m2. In 2012, from 41 DAE (at flowering and tuberization, with 1042 GDD) to crop maturity, there were significant differences in LAI among treatments. Plants in the deficit irrigation treatments (0·60 and 0·80) reached maximum LAI earlier (2·7 and 4·3 m2/m2 at 68 DAE and 1613 GDD) than in the 1·00 and 1·20 treatments (5·1 and 5·7 m2/m2 at 83 DAE and 1941 GDD) (Fig. 2(b)).
Average leaf area index (LAI, m2/m2) by treatment in (a) 2011 and (b) 2012, and average cumulative total dry matter (TDM, g/m2) by treatment in (c) 2011 and (d) 2012.
The Gompertz model was used to describe the progression of TDM over time for both irrigation seasons. The Gompertz model is based on a sigmoid function that describes an asymptotic response of the dependent variable (weight) to time (independent variable). The goodness-of-fit was high for this model (R 2 = 0·99 ± 0·010), and the parameters were highly significant. In 2011, the change in TDM differed among treatments at the onset of senescence. At the end of the crop cycle (at 108 DAE with 2145 GDD), the 0·60 irrigation treatment differed significantly (P < 0·01) from the other treatments (Fig. 2(c)). In this treatment, TDM reached a maximum of 1451·5 g/m2, 14% lower than in the other treatments.
During the 2012 irrigation season, the 0·60 irrigation treatment started diverging from the other irrigation treatments towards the end of flowering (52 DAE with 1267 GDD) (Fig. 2(d)). At 68 DAE (with 1614 GDD), the 0·80 irrigation treatment formed a statistically independent group. Later, at 83 DAE (1942 GDD), two statistically significant groups were identified (the 0·60–0·80 and 1·00–1·20 irrigation treatments) that persisted until the end of the crop cycle (Fig. 2(d)).
Measured values of green canopy cover
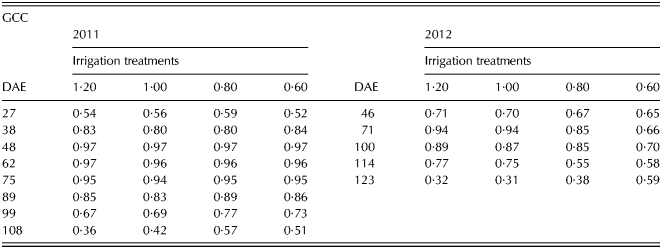
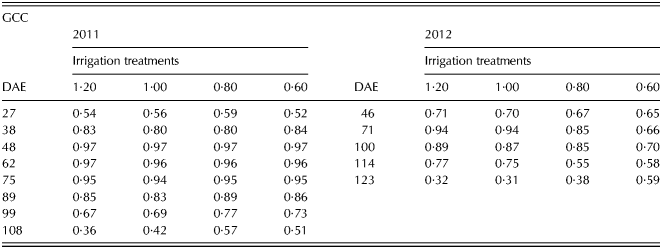
In 2011, maximum GCC was very similar for all the irrigation treatments that were tested at the same time. Thus, at 48 DAE, plants in all treatments reached 0·97 of total ground cover. At the end of the irrigation season, the deficit treatments (0·60 and 0·80 irrigation treatments) had a higher proportion of ground cover (0·51 and 0·57, respectively) than the other irrigation treatments (0·37 and 0·43 in the 1·20 and 1·00 treatments, respectively) (Table 2).
Green canopy cover (GCC; proportion) for potato crop in 2011 and 2012
DAE, days after emergence.
During the 2012 irrigation season, the 1·20, 1·00 and 0·80 treatments exhibited maximum GCC at 71 DAE; the maximum occurred later (100 DAE) in the 0·60 treatment. This outcome can be explained by the high temperatures (day and night) in the second year (75 days with temperatures above 30 °C were recorded in 2012, compared with 45 days in 2011).
Table 3 shows a significant decrease (P < 0·001) in the maximum GCC values as the water deficit increased. In addition, a significant linear and quadratic response was indicated. The GCC values showed a mean significantly lower (P < 0·001) in 2012 irrigation season than in 2011 irrigation season (0·95 and 0·84, respectively).
Effect of irrigation treatment on the absorbed photosynthetically active radiation (PARa), light absorbed by the canopy (ε a), crop yield, radiation use efficiency (RUE) and maximum green canopy cover (GCC). Data was analysed with multiple analysis of variance (PolyAnova) and they are presented as mean with s.e.m.
* P is not calculated because there are only two irrigation seasons.
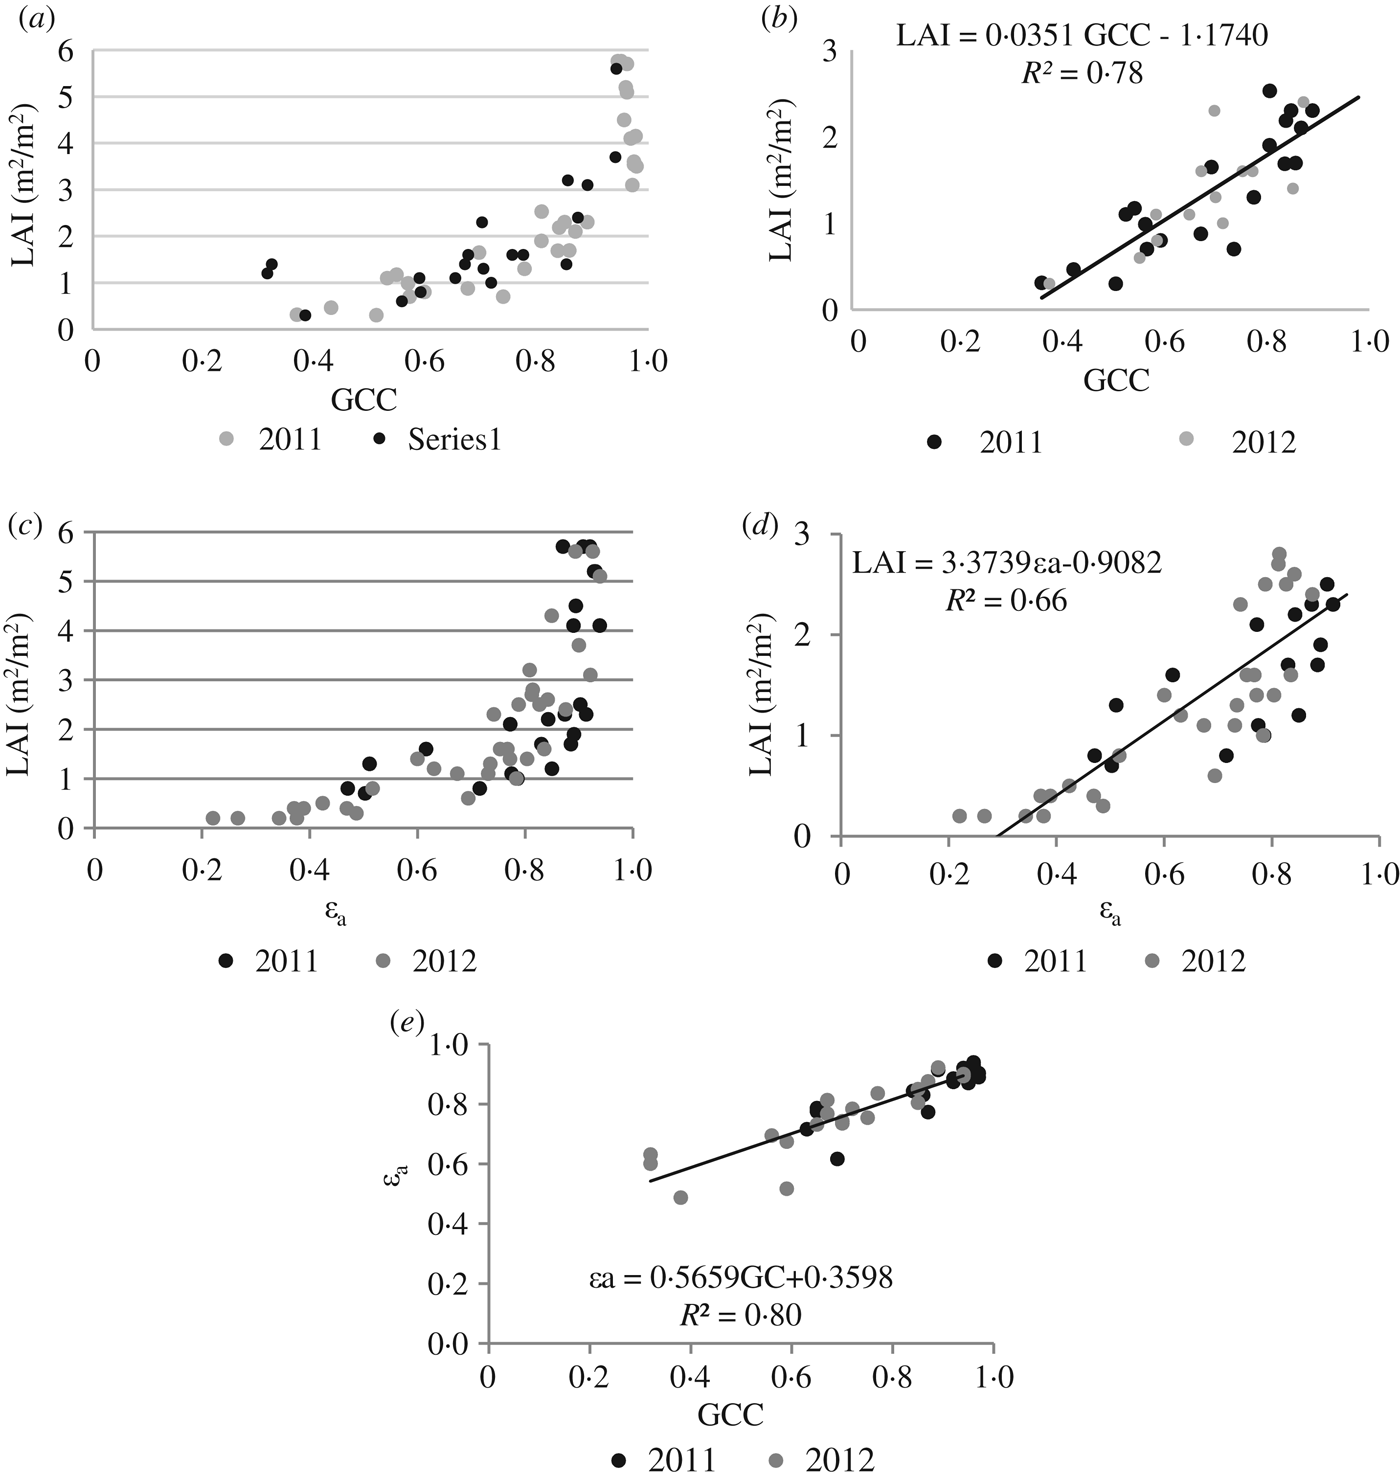
An exponential correlation between LAI and GCC was found in both irrigation seasons (Fig. 3(a)). At maximum GCC, LAI ranged from 2 to 6 m2/m2. At maximum GCC, LAI reached values of c. 3 m2/m2. Above this value, the correlation between the parameters decreased.
Relationship between (a) leaf area index (LAI) and green canopy cover (GCC), (b) between LAI and GCC with LAI values that correspond with effective full cover in the potato crop, (c) between LAI and light absorbed by the canopy (ε a), (d) between LAI and ε a with LAI values that correspond with effective full cover and (e) relationship between ε a and GCC.
Before the crop reached the maximum proportion of GCC (<1·00 in all of the treatments), there was a linear relationship between GCC and LAI corresponding to the maximum efficiency in light absorption. This outcome occurred at values <3 m2/m2 in the present study. The R 2 (78·5%) was highly significant (P < 0·01) (Fig. 3(b)).
Light absorption
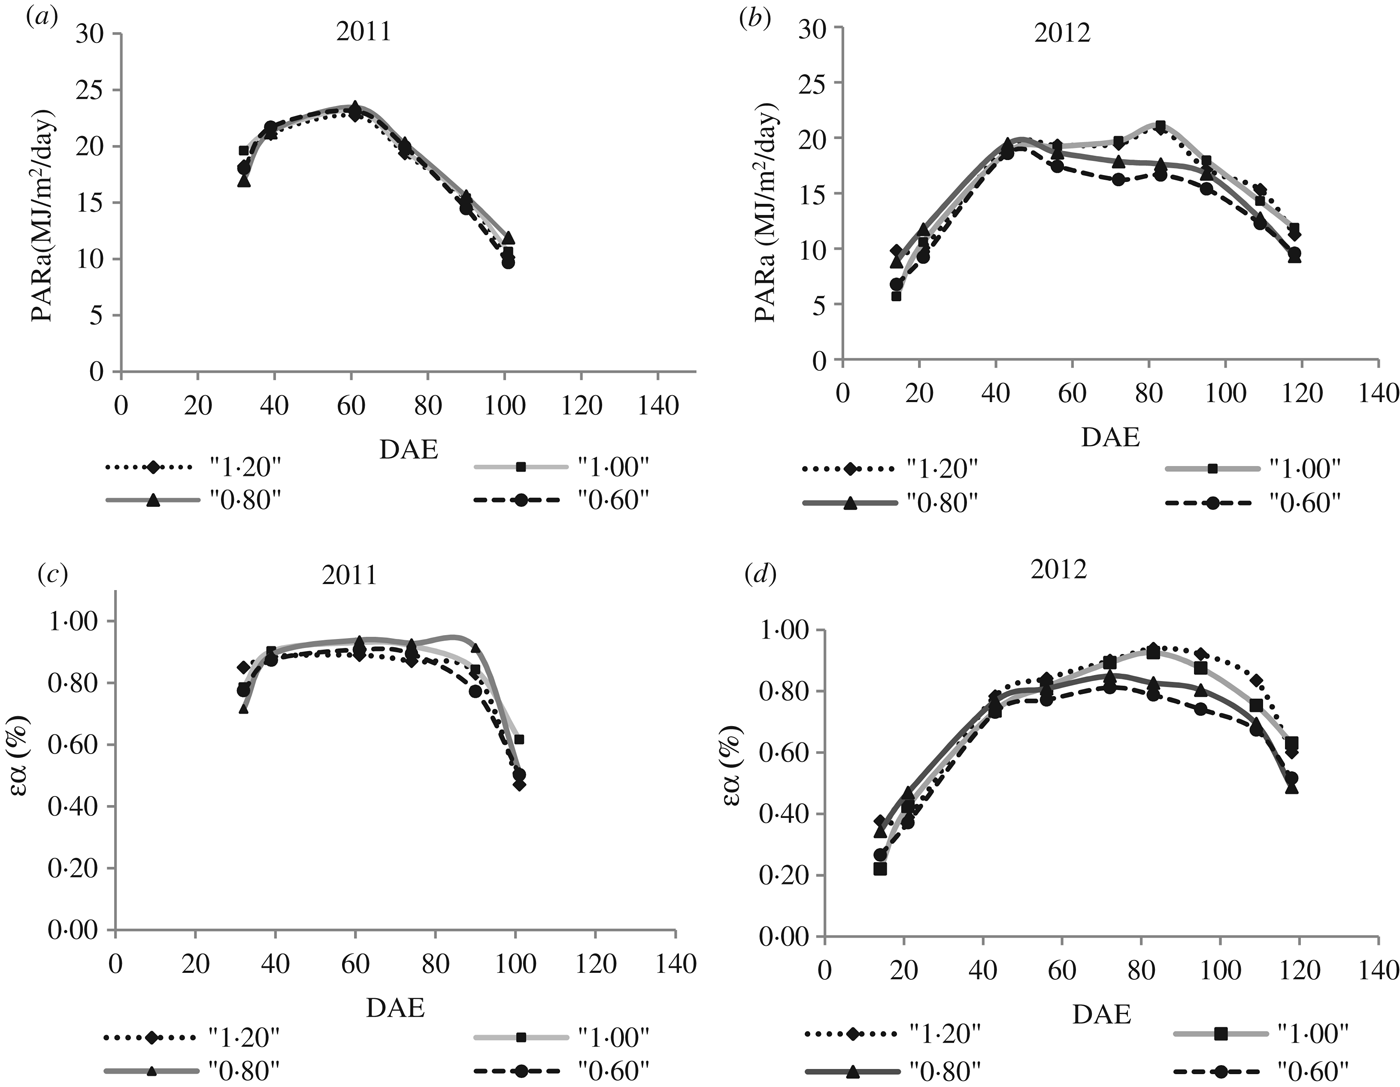
In each irrigation season, the highest PARa occurred at the flowering and tuberization stages. In 2011, PARa for all the treatments was 22–23 MJ/m2/day (61 DAE) (Fig. 4(a)). In 2012, the maximum values occurred at 83 DAE (20–21 MJ/m2/day) in the 1·20 and 1·00 irrigation treatments and at 19 DAE (18–19 MJ/m2/day) in the 0·80 and 0·60 treatments (Fig. 4(b)). Regarding maximum PARa values did not differ significantly among irrigation treatments (Table 3). However, 2012 irrigation season showed a mean significantly lower (P < 0·001) than the 2011 irrigation season (23·1 and 20·0 MJ/m2/day, respectively).
Absorbed photosynthetically active radiation (PARa) by treatment in (a) 2011 and (b) 2012 and light absorbed by the canopy (ε a) by treatment in (c) 2011 and (d) 2012.
In 2011, the trends were similar for all irrigation treatments. Thus, ε a values increased until the crop reached the maximum GCC (61 DAE), and above this value, ε a decreased at the onset of senescence (74 DAE) (Fig. 4(c)). In the 2011 irrigation season, maximum ε a values did not differ significantly among irrigation treatments. In 2012 (Fig. 4(d)), maximum ε a, values were reached at 83 DAE (senescence period) for the 1·00 and 1·20 treatments, and at approximately 68 DAE for the 0·60 and 0·80 treatments. This parameter showed a significant decrease (P < 0·01) among treatments with high (1·00–1·20) and low water requirements (0·60–0·80) and a significant linear response (P < 0·01) (Table 3).
Data from the 2 years were used to correlate LAI and ε a (Fig. 3(c) and (d)). The pattern was very similar to that exhibited by the exponential correlation of LAI and GCC, with LAI increasing after maximum ε a was reached. Thus, when LAI was higher than 3 m2/m2, the increase in ε a was not particularly relevant (Fig. 3(c)). These results indicate that it is possible to develop a highly significant (P < 0·01) linear relationship (R 2 = 71·4%), with LAI corresponding to maximum ground cover (Fig. 3(d)).
The relationship between ε a and canopy cover was also analysed using the data from the two seasons. Figure 3(e) illustrates a highly significant (P < 0·01) linear correlation between the variables; the R 2 is 80·2%.
Light extinction coefficient
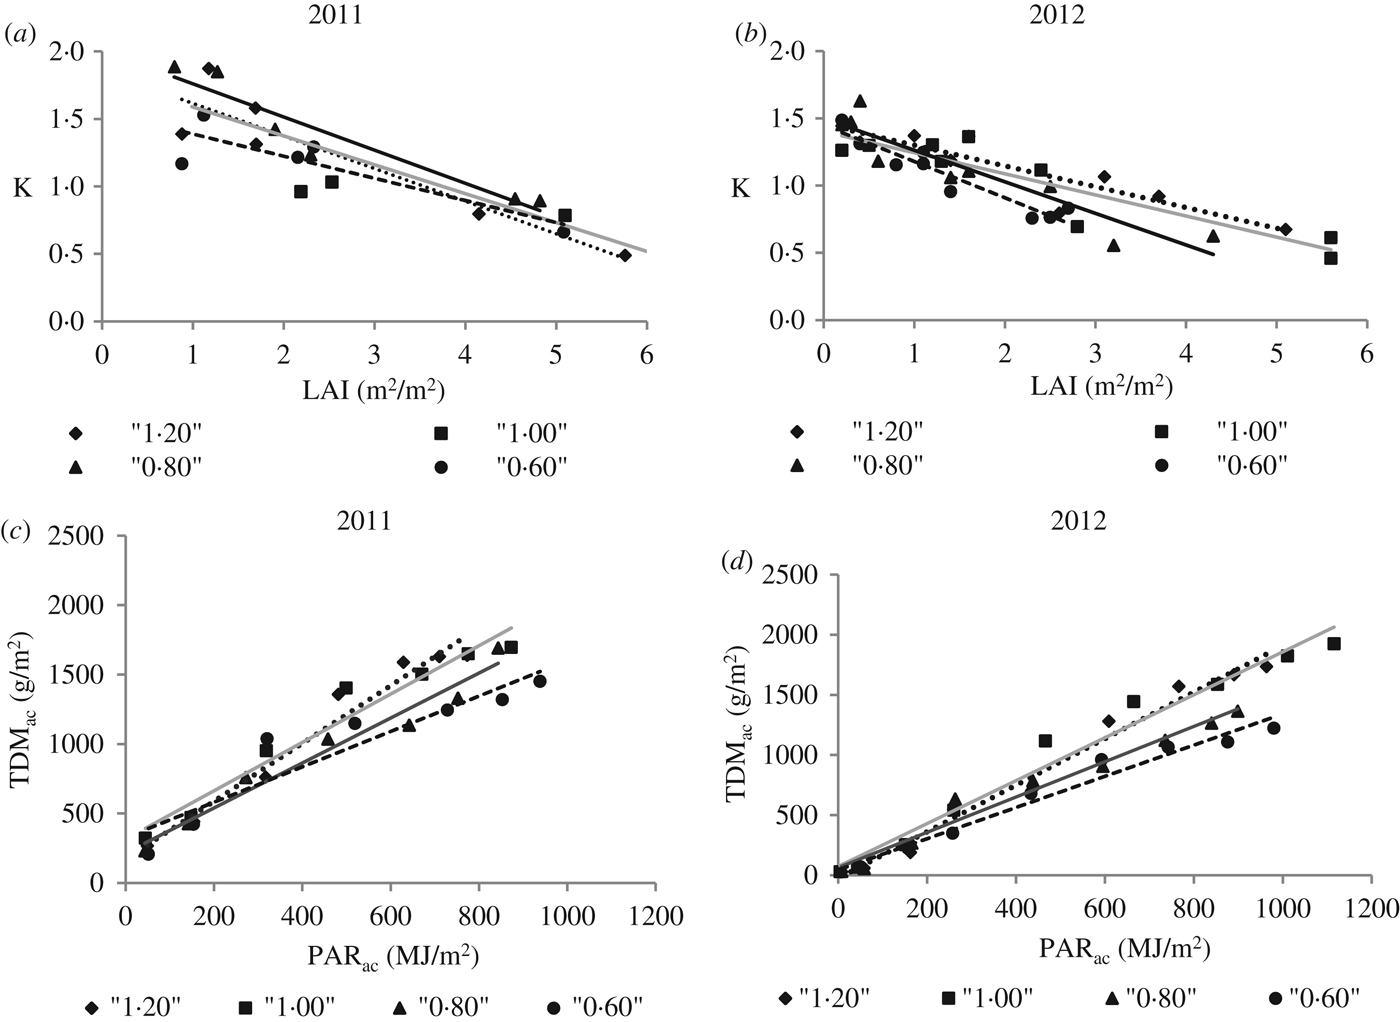
For all the four irrigation treatments, the linear regression revealed a significant (P < 0·01) relationship between the light K and LAI (Fig. 5(a) and (b)). The results show that light interception was more efficient per unit leaf area when LAI was relatively low. There were similar minimum values of K ranging from 0·48 to 0·75, in the irrigation seasons.
Relationship between extinction coefficient (K) and leaf area index (LAI) by treatment in (a) 2011 and (b) 2012, and relationship between accumulated total dry matter content (TDMac) and accumulated absorbed photosynthetically active radiation (PARac) by treatment in (c) 2011 and (d) 2012.
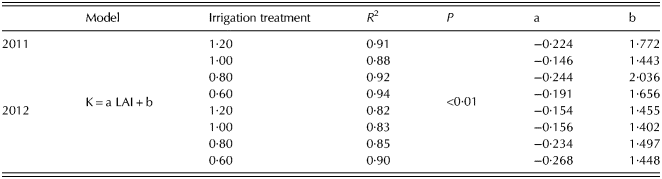
The linear models for each irrigation treatment were highly significant (P < 0·01), with R 2 ranging from 0·81 to 0·94 in the two irrigation seasons. The 0·80 irrigation treatment exhibited a large decrease in intercepted efficiency in 2011 compared with the other irrigation treatments (a = –0·2442), as indicated by the slope of the linear model. In 2012, the decrease was less noticeable in the 1·00 and 1·20 irrigation treatments (a = –0·1569 and –0·1544, respectively) than in the 0·60 and 0·80 irrigation treatments (a = –0·2689 and –0·2346, respectively) (Table 4).
Analysis of the linear model between LAI and K
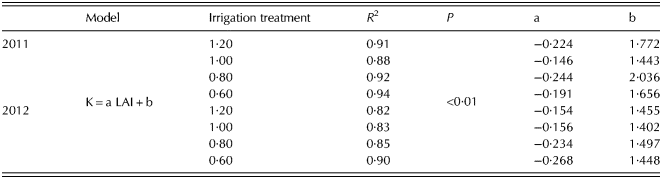
K, extinction coefficient; LAI, leaf area index; a and b, coefficients of the model.
Radiation use efficiency and crop yield
In each irrigation season, the 0·60 irrigation treatment had the lowest RUE and crop yield, and the 1·20 irrigation treatment exhibited the highest RUE. A significant decrease (P < 0·001) was observed among irrigation treatments as the water deficit increased, with a significant linear response (P < 0·01) (Table 3).
For all four irrigation treatments, the linear regression revealed a significant (P < 0·01) relationship between accumulated total dry matter (TDMac) and accumulated PAR absorbed (PARac) (Fig. 5(c) and (d)). In both seasons, the slopes indicated that RUE values were higher for the 1·20 and 1·00 irrigation treatments than for the 0·60 treatment.
With regard to crop yield, the 1·00 irrigation treatment showed the maximum value. A significant decrease (P < 0·001) was shown when comparing irrigation treatments; with a significant linear (P < 0·001) and quadratic response (P < 0·01) (Table 3).
DISCUSSION
Canopy efficiency
The rainfall recorded in 2011, which was particularly high during the initial stages, may explain why LAI did not differ among irrigation treatments. In fact, from sowing until the beginning of the irrigation treatments (38 DAE), the accumulated effective precipitation was 100·6 mm (127·8 mm recorded during the entire the crop cycle).
Although the cultivar Agria is classified as susceptible to water deficit, responding with a strong decrease in ground coverage and canopy radiation interception (Hassanpanah Reference Hassanpanah2010), GCC was more sensitive to high temperatures than to water stress during the current experiment. All treatments reached similar maximum values of GCC, although the maximum occurred later in the deficit treatments. In an analysis of potato clones of temperate and tropical origins grown for two seasons at different densities and in two cropping systems, Cadersa & Govinden (Reference Cadersa, Govinden, Lalouette, Bachraz and Sukurdeep1999) found maximum GCC to be between 70 and 98%; they also found a linear relationship between GCC and light interception, as demonstrated in the present paper. Several authors (Haverkort et al. Reference Haverkort, Uenk, Veroude and Van De Waart1991; Boyd et al. Reference Boyd, Gordon and Martin2002; Jayanthi et al. Reference Jayanthi, Neale and Wright2007; Castallanos et al. Reference Castallanos, Abril and López2010) have stated that when GCC reaches the maximum value, the crop is at its maximum light absorption efficiency, which is defined as the stage of maximum leaf area expansion before the onset of leaf shading.
Leaf area index values similar to maximum GCC have been found by several researchers. Wright (Reference Wright1982) and Jayanthi et al. (Reference Jayanthi, Neale and Wright2007) stated that the maximum ground cover was reached at an LAI of c. 3·5 m2/m2, a level at which the crop's potential ETo rate reaches its maximum. De la Casa et al. (Reference De La Casa, Ovando, Bressanini, Martinéz and Rodriguéz2011), who determined RUE for a potato crop and analysed the values of LAI and GCC, found that maximum canopy cover (98%) occurred at an LAI of 3–4 m2/m2. In addition, De la Casa et al. (Reference De La Casa, Ovando, Bressanini, Rodriguéz and Martinéz2007) analysed the use of LAI and GCC for a potato crop as an indirect measure of the aboveground biomass and reported maximum ground cover (100%) when LAI was approximately 3 m2/m2, although the crop did attain higher LAI values (4·5 m2/m2). Haverkort et al. (Reference Haverkort, Uenk, Veroude and Van De Waart1991) analysed the relationships between ground cover, intercepted SR and LAI of two cultivars of potato and found that the crop covered the ground completely when LAI exceeded 3 m2/m2.
Other researchers have obtained relatively good fits for models of the relationship between GCC and LAI. De la Casa et al. (Reference De La Casa, Ovando, Bressanini, Rodriguéz and Martinéz2007) obtained a regression coefficient of 98% for potato crops using a potential model to explain the relationship between GCC and LAI. Analysing an onion crop with a pivot irrigation system in Spain, Córcoles et al. (Reference Córcoles, Ortega, Hernández and Moreno2013) developed a linear model with a good fit statistic (R 2 = 83%). Haverkort et al. (Reference Haverkort, Uenk, Veroude and Van De Waart1991) reported a strong correlation between potato LAI and ground cover early in the season, before ground cover reached 100%. Ballesteros et al. (Reference Ballesteros, Ortega, Hernández and Moreno2014b) analysed the relationship between GCC and LAI, using aerial images from UAVs and found the best fit for a maize crop with a second-order polynomial model (R 2 = 91%) and for an onion crop with a linear model (R 2 = 85%). Similar studies, such as that of Jayanthi et al. (Reference Jayanthi, Neale and Wright2007), used an exponential model (R 2 = 90%) to correlate LAI with the soil-adjusted vegetation index (SAVI). Turner et al. (Reference Turner, Cohen, Kennedy, Fassnacht and Briggs1999) obtained a third-order polynomial model (R 2 between 51 and 74%) when correlating LAI with the normalized difference vegetation index (NDVI). Ballesteros et al. (Reference Ballesteros, Ortega, Hernández and Moreno2014b) used a linear model (R 2 = 89 and 82% for maize and onion, respectively) to describe the relationship between the visible atmospherically resistant index (VARIgreen) and GCC.
Leaf area index continues to increase after reaching the maximum light absorption efficiency (3 m2/m2), as demonstrated in the present paper. This fact, together with the differences in total biomass reached by the different irrigation treatments, helps explain why a leaf area increase did not result in a more efficient use of radiation. Boegh et al. (Reference Boegh, Soegaard, Broge, Hasager, Jensen, Schelde and Thomsen2002) analysed photosynthetic rates in eight crops and reported that when LAI increases, crop photosynthetic activity decreases. This phenomenon is caused by light absorption reaching a constant value when LAI is near the maximum. In Canada, analysis of the relationship between LAI and ground cover in potato by Boyd et al. (Reference Boyd, Gordon and Martin2002) showed that when the plant exerted less energy to produce leaves while maximizing ground cover, light interception was more efficient, i.e., an efficient plant produces leaves that can intercept PAR without shading one another.
Similar results were found by Bégué (Reference Bégué1993), who analysed the variability in the relationships between LAI and daily interception efficiency (where the interception efficiency saturates for high values of LAI), and between LAI and NDVI: a linear relationship was found between ε a and NDVI for crop growth and senescence stages in maize.
Gordon et al. (Reference Gordon, Brown and Dixon1997) analysed a potato crop and fit K and LAI using a polynomial model; the coefficient of determination was lower (77%) than was obtained in the present study (81·6–94·3%). According to Jongschaap & Booij (Reference Jongschaap and Booij2004), relatively high K values imply steep light gradients, i.e., relatively low light intensities deeper in the canopy, which is typical for potato crops. Jongschaap & Booij (Reference Jongschaap and Booij2004) found average K values between 0·66 and 0·73 for different potato varieties.
Biomass accumulation
The measured TDM was closely related to PAR absorbed by the canopy and the high temperatures. During the 2012 irrigation season, the climate (high temperatures from the onset of tuberization) helped explain the TDM differences among irrigation treatments. Kooman et al. (Reference Kooman, Fahem, Tegera and Haverkort1996) reported that leaf growth is the main factor influencing daily crop dry matter accumulation and that high temperatures adversely affect leaf development in most water deficit treatments. This response was observed in 2012, when the lower irrigation treatments accumulated less TDM than the higher irrigation treatments.
The significant linear response found about RUE values and crop yield in the effect of irrigation seasons can be explained by the longer crop cycle in 2012 than in 2011 and thus a higher accumulated PAR absorbed. The RUE values were very similar to results from other studies of potato crops, c. 1·45–1·70 g/MJ (Sinclair & Muchow Reference Sinclair and Muchow1999) and 2·90–3·20 g/MJ (De la Casa et al. Reference De La Casa, Ovando, Bressanini, Martinéz and Rodriguéz2011).
Moreover, in both irrigation seasons, the crop yield differences exhibited the same trend as TDM and RUE. The 0·60 irrigation treatment had a smaller LAI and therefore less photosynthesis, resulting in a smaller increase in the final crop yield.
Although the highest RUE was in the 1·20 irrigation treatment, crop yield showed similar values between the non-stress treatments (1·20 and 1·00). The current analysis indicates that the 1·00 irrigation treatment provided the best results over the 2 years.
CONCLUSION
In 2011, when there was high rainfall, there were no statistically significant differences in the maximum values of ground cover among irrigation treatments. However, in 2012, irrigation treatments that received more water had more ground cover than the other irrigation treatments. An exponential model provided a good fit for the relationship between ground cover and LAI and was useful for explaining the relationship between light absorption efficiency and LAI. Leaf area index and ground cover are linearly correlated until the LAI approaches its maximum of 3 m2/m2. This outcome indicates that high ground cover values do not represent an increase in photosynthetic activity. In both irrigation seasons, the highest efficiency light absorption values occurred at the LAI value that corresponded to maximum ground cover. The highest RUE occurred in the treatments that received more water. In the 1·20 irrigation treatment, RUE was 43% higher than in the 0·60 irrigation treatment. The current results indicate that higher yield and TDM are associated with these irrigation treatments.
The authors wish to express their gratitude to the Spanish Ministry of Science and Innovation (MICNN) for funding the project, ‘Sprinkler irrigation: water application, agronomy and return flows (grant no. AGL2010-21681-C03-02)’. We would like to acknowledge the support of the Erasmus Mundus project (External Cooperation Window project for lot 15) and CNPq (National Counsel of Technological and Scientific Development) for funding the scholarship for Débora Costa Camargo. We thank the managers and farmer of ‘Centro de Formación Agroambiental of Aguas Nuevas’ for their help.