Since the passage of the Voting Rights Act (VRA) in 1964, minority candidates have been elected to political office at all levels of government. One question is whether candidates from specific racial and ethnic groups trigger participatory effects among voters that share the same racial or ethnic identity. In this paper, we revisit the question of whether African American candidates increase African American electoral participation, and offer a new research design that leverages the redistricting process in a way that accounts for many of the analytical challenges (i.e., problems with selection effects, variation in treatment specification, and treatment effect heterogeneity) that have plagued previous researchers’ efforts. By focusing on the effects of African American candidates when voters are moved through the redistricting process, we are able to offer a more precise test of how African American candidates affect individual level electoral behavior. We find strong evidence that African American candidates have little or no effect on co-racial voter turnout. In fact, in some cases moving from a white candidate to an African American candidate appears to decrease African American voter turnout. We also examine turnout rates for white voters that are also moved and find similar patterns. We conclude that while representation of minorities has increased in Congress, these candidates appear less effective at inspiring continued African American involvement in the electoral process.
MINORITY TURNOUT AND MINORITY CANDIDATES
An influential study by Bobo and Gilliam (Reference Bobo and Gilliam1990) provided the initial evidence that minority candidates and office-holders might increase minority turnout. Bobo and Gilliam (Reference Bobo and Gilliam1990) found that African Americans in cities with African American mayors displayed higher rates of political efficacy and participation than African Americans in cities with white mayors. One explanation for this finding was a theory of racial political participation known as empowerment, which states that when an office holder shares the citizen’s race this generates a psychological benefit that increases political participation (Bobo and Gilliam Reference Bobo and Gilliam1990; Gilliam Reference Gilliam1996; Gilliam and Kaufman Reference Gilliam and Kaufman1998). More specifically, it is thought that a heightened sense of political empowerment occurs when minorities live in places where they witness political power held by members of their racial in-group (Browning, Marshall and Tabb Reference Browning, Marshall and Tabb1984; Bobo and Gilliam Reference Bobo and Gilliam1990; Gilliam and Kaufman Reference Gilliam and Kaufman1998; Leighley Reference Leighley2001; Barreto, Segura and Woods Reference Barreto, Segura and Woods2004). Here, a co-racial or co-ethnic candidate in political office sends a signal to the minority group that they have a stake in the political process and can influence policy.
While empowerment theory was formulated in the context of mayoral elections, the wave of new minority officeholders produced by the VRA prompted scholars to extend the theory to other legislative offices. Specifically following the amendment of Section 2 of the VRA by Congress and the Supreme Court’s ruling in Thornberg v Gingles in 1986, many states were then required to create majority–minority legislative districts in order to achieve preclearance from the Justice Department. Following the census in 1990 and 2000, minority candidates gained a number of seats at both the state and Federal level.
Following the large increase in minority representation produced by Section 2 of the VRA, a large literature developed trying to answer the question of whether minority candidates generally increase minority turnout (Tate Reference Tate1991; Brace et al. Reference Brace, Handley, Niemi and Stanley1995; Gay Reference Gay2001; Voss and Lublin Reference Voss and Lublin2001; Tate Reference Tate2003; Barreto, Segura and Woods Reference Barreto, Segura and Woods2004; Griffin and Keane Reference Griffin and Keane2006; Washington Reference Washington2006; Whitby Reference Whitby2007). Early work using precinct level data found little evidence of increased turnout (Brace et al. Reference Brace, Handley, Niemi and Stanley1995; Gay Reference Gay2001), but later studies have generally found a positive correlation. Voss and Lublin (Reference Voss and Lublin2001) used precinct level data in Florida and Georgia and finds higher turnout when a Black Congressional incumbent is on the ballot. Barreto, Segura and Woods (Reference Barreto, Segura and Woods2004) find rather stronger evidence that Hispanic candidates have a positive net effect on minority turnout—in their case Latino turnout. The strongest evidence was found by Washington (Reference Washington2006) who aggregates individual level data from across 20 years and hundreds of elections and also finds an increase in turnout among African Americans when there is an African American candidate. Fraga (Reference Fraga2016b) also finds evidence that turnout is higher among African Americans when a co-racial candidate is on the ballot in legislative races.
Of course, empowerment may not be the only possible mechanism that could explain why minority turnout would increase with co-racial candidates. Minority candidates should view minority voters as a natural voting bloc that is easily mobilized. Under this mechanism, minority turnout may increase since minority candidates will have a strong incentive to turnout co-racial voters. As such, minority candidates may use targeted mobilization efforts aimed specifically at minority voters (Toure and Hamilton Reference Toure and Hamilton1992).
While current theory has been devoted to understanding why we might expect an increase in minority participation, we would argue that there are plausible counter-arguments as well. Public ignorance of politics is well-documented, and many legislative offices may not be visible enough to engage citizens’ interest. Even elections for the US House may not be visible enough for minority voters to even realize that the candidate shares his or her racial identity. Moreover, the seats created under the VRA tend to be very safe. The lack of competition may work to undermine voter interest, and candidates will have little need for mobilization and voter outreach. Finally, other research has found that empowerment may wear off after one or two election cycles and thus no longer mobilize minority voters (Gilliam and Kaufman Reference Gilliam and Kaufman1998).
Despite the current consensus on minority candidates and minority turnout, close examination of the extant research designs suggests a false consensus. With few exceptions (see Henderson, Sekhon and Titiunik Reference Henderson, Sekhon and Titiunik2014; Fraga Reference Fraga2016b), none of the existing work has accounted for selection, the process by which voters are selected for treatment. As we explore below, there are systematic reasons why we should expect that voters that face minority candidates may systematically differ from voters who do not. Unless we account for such selection effects, estimates from standard regression models will be biased (Heckman Reference Heckman1979). Moreover, we must account for heterogenous responses to the treatment. That is, when voters are treated, they must respond in the same way for a statistical model to produce consistent parameter estimates. One existing study, for example, pools all House, Senate, and gubernatorial races from 1982 to 2000 (Washington Reference Washington2006). Here, we have to assume that response to a House candidate is the same as the response to a Senate candidate. Other studies have examined the effects of minority candidates across multiple Congressional districts (Barreto, Segura and Woods Reference Barreto, Segura and Woods2004), or across multiple states (Fraga Reference Fraga2016a; Fraga Reference Fraga2016b). This approach, however, introduces significant heterogeneity into the study design. In the presence of such response heterogeneity, least squares estimates of the treatment effect converge to a consistently estimated parameter, but this parameter does not represent a meaningful treatment effect (Angrist and Pischke Reference Angrist and Pischke2009). Moreover, we outline below, finding comparable races across Congressional districts when the candidates are of differing races is a considerable challenge.
With plausible theoretical arguments for and against the participatory effects of these districts, and a number of research design issues at stake, considerable attention needs to be paid to the research design, so that a sharp test of the theory can distinguish between these competing claims. We now turn to design issues.
IDENTIFICATION STRATEGY: REDISTRICTING
Next, we outline the identification strategy we use to identify the causal effect of African American candidates on turnout. Let D i ∈{0, 1} be an indicator of treatment that is 1 if the individual faces an African American candidate and 0 otherwise while Y i ∈{0, 1} records whether an individual votes or not. We are interested in the average causal effect as in E[Y i |D=1]−E[Y i |D=0]. To identify this causal effect, we assume that we observe all relevant confounding variables. This assumption is often referred to as “selection on observables” (Barnow, Cain and Goldberger Reference Barnow, Cain and Goldberger1980), since we assume that treatment selection is based on observable covariates. Under this assumption, once the observed differences in the confounders between the treatment and control groups have been taken into account, we can estimate causal effects. Undoubtedly, this is a very strong assumption that we would not expect to be true in general. We exploit the redistricting process after the 2000 Census as strategy for satisfying this assumption.
Our research design builds on other uses of redistricting to estimate causal effects (Ansolabehere, Snyder and Stewart Reference Ansolabehere, Snyder and Stewart2000; Sekhon Titiunik and Henderson 2010; Sekhon and Titiunik Reference Sekhon and Titiunik2012; Fraga Reference Fraga2016a). In this design, we use a simple comparison created by redistricting: we compare African American voters that after the 2000 Census are moved into a US Congressional district with an African American representative to African American voters that remain in a district with a white representative. African American voters are often moved into House Districts that are either majority–minority or minority influenced so that states are in compliance with Section 2 of the VRA.
As Sekhon and Titiunik (Reference Sekhon and Titiunik2012) note designs based on redistricting have a key advantage: district boundaries are drawn by public officials, not voters. Thus, redistricting creates situations where the treatment is assigned by state legislators instead of voters. Therefore, our design shares an important aspect with experiments: the individuals in charge of assigning treatment are separate from the population that receives the treatment. Moreover, we know the criteria by which state legislators select geographic areas into Congressional districts. That is state legislators have access to US Census data on measures like race, education and income as well as voter and election data like registration levels, turnout rates, and vote returns. As such, we have good reason to believe that selection on observables holds perhaps approximately when treatments are assigned through the redistricting process.
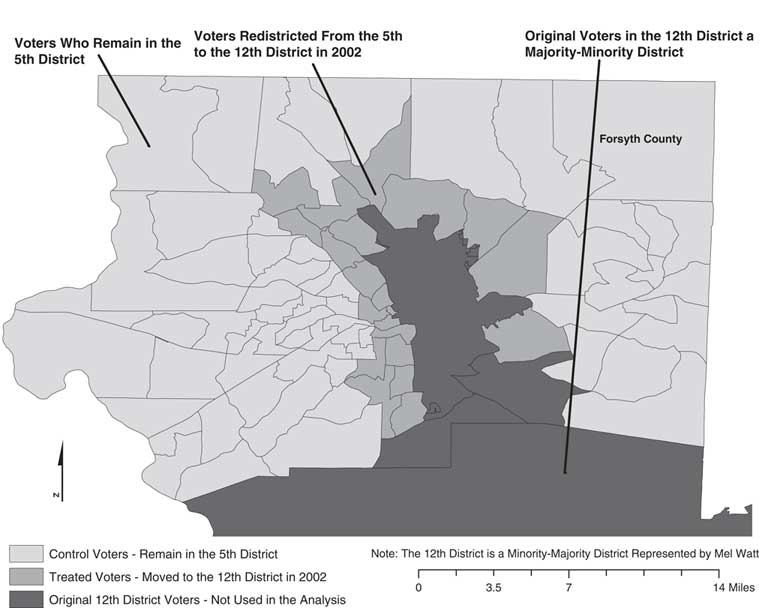
To help the reader understand how we use redistricting, Figure 1 contains a map of one of the areas we study in North Carolina. In this example, some voters were moved from the 5th district represented by Republican incumbent Brad Miller to the 12th district represented by African American incumbent Mel Watt around the city of Winston-Salem. In this case, we have a number of precincts that move from the 5th district to the 12th. Voters in the precincts that move are the treated voters as they are moved into a district where they have a chance to vote for an African American candidate for Congress for the first time. For these voters, the House candidate changes, but all voting costs are held constant as polling places remain the same. Other work has shown that if the cost of voting increases in terms of moving the polling place, turnout will decrease (Brady and McNulty Reference Brady and McNulty2011). To that end, we ensured that the voters in our study did not face any change in their polling location after redistricting. We use voters that remain in the 5th district as the controls since they remain under a white incumbent. These voters are suitable controls since they share a similar voting history and for them nothing changes after redistricting. The appendix contains similar figures for the other areas included in our study.
Change in district boundaries for House Districts 5 and 12 from 2000 to 2002 Note: Precincts are moved from the 5th district represented by white Republican incumbent Brad Miller to the 12th district represented by Democratic incumbent Mel Watt, an African American. Both won easily in 1998 and 2002. All voters reside in Forsyth county North Carolina.

A design based on redistricting does change the treatment of interest. While it may be possible to separate the effect of having an African American candidate from the effect of redistricting itself, we assume the two treatments are fused and impossible to separate. For our study, the treatment is being moved into a majority–minority or minority-influenced district with a African American candidate for the US House. Formally, D i =1 for voters that are moved from a white incumbent to a African American Democrat in a majority–minority district. As such, we are estimating a treatment that is the effect of being redistricted to an African American candidate, and it is possible that being moved by redistricting alters turnout. Whether redistricting has an effect on turnout, however, is an empirical question. Using an identical design in both North Carolina and Georgia, Keele and White (Reference Keele and Whiten.d.) find that redistricting has no effect on turnout when the race of the candidate is fixed. Therefore, we can have greater confidence that we are estimating a race effect and not a redistricting effect.
One thing we cannot control in our design is the electoral environment that occurs in the two districts after redistricting. Clearly, the treated voters have been moved to a new Congressional district while the control voters remain in a district with a different campaign. Thus, we cannot control for campaign effects directly. We would prefer the campaigns in the two districts to be identically competitive in terms of mobilization and political interest. The key worry is that a competitive election in the control district may cause African American voters to turnout at unusually high rates which would then obscure any increase in turnout by voters that have moved to the majority–minority district with an African American candidate. Of course, this problem is endemic to the research question. In any design based on redistricting, a counterfactual comparison has to be made across two different Congressional districts where different elections occur simultaneously. In general, we seek to account for this concern by using areas where voters are moved from one uncompetitive environment to another. That is, we specifically look for areas where voters move from a district with a white Republican candidate who wins easily and has done so for sometime. Thus, we can contrast voters facing a white Republican candidate who is expected to win easily with voters who now have a chance to vote for an African American candidate in an equally uncompetitive election. We think this is our best chance at making sure our treated and control comparisons are highly comparable, something that will be difficult if we attempt to make comparisons across a large number of different elections. Below we provide summaries of the ex post electoral environment for each area that we study.
Redistricting Case Selection
Data availability for the redistricting process after the 1990 census is poor. To that end, we focus on voters that are moved into districts with African American representatives after the 2000 census. As we outline below, we focus on districts in Georgia and North Carolina. We found data availability and reliability to be highest in these two states. These states also allowed us to examine districts that range from rural and suburban to urban.Footnote 1
North Carolina
In North Carolina, we searched for areas where African American voters had been under white incumbents and were moved after 2000 into either Districts 1 or 12. We found two areas that met our criterion. First, we found that three rural counties, Chowan, Pasqoutonk, and Perquimans, were moved from the 3rd district where Walter Jones, a white Republican, had held that seat since 1994 to District 1. This area is also useful since it allows us to observe a rare open seat election. Before the 2002 election, Eva Clayton, an African American woman, announced her retirement. Four different candidates competed in the Democratic primary in the Spring of 2002. The winner of that primary, Frank Ballance, went on to easily win the seat in the Fall of 2002. For this district, we also include results from the 2002 primary. The center of Winston-Salem has been apart of District 12 since its creation in 1992. Under the 2002 redistricting plan, a number of precincts around the Winston-Salem urban core were moved from the 5th district to the 12th. The 5th district seat was held by Richard Burr a white Republican. For this analysis, we are able to restrict the analysis to Forsyth County making it our preferred within-county design where all county level variation is held fixed. Note that Winston-Salem has never had an African American mayor. In both cases in North Carolina, the post-redistricting campaigns were uncompetitive in both the treated and control areas. Tables A1 & A2 in the Online Appendix contains details on all post-redistricting elections in terms of vote margins and campaign spending.
Georgia
Georgia, like Texas, redistricted twice after the 2000 census. The first redistricting plan was drawn by a Democratically controlled state legislature. In 2002, however, the Republican party gained control of the state senate and governorship. Then in 2004, the Republican party captured the state house as well. With both the governorship and legislature under Grand Old Party control, state legislators proceeded to redraw the Democratic map created in 2002. On May 6, 2005, Governor Perdue signed into law the second redistricting plan since the 2000 census (Barone, Grant and Ujifusa Reference Barone, Grant and Ujifusa2005). Here, we only study voters that were moved between 2004 and 2006. We study two districts in Georgia.
We first examine voters who are moved into District 13 in Cobb County after the second redistricting in 2005. The redistricting plan drawn in 2005 split Cobb County between three Congressional districts: the 6th and the 11th districts, which were represented by white Republican incumbents, and the 13th represented by David Scott an African American incumbent. In our analysis, we compare voters in Cobb County who were moved into District 13 but before were part of either the 6th or 11th before 2005.Footnote 2 Tables A1 & A2 in the Online Appendix contains a map of the area along with the district boundaries.
Studying the changes to Cobb County has one particular advantage, since we found a unique opportunity to control confounding factors via design in Cobb County. State legislators split a number of precincts in Cobb County when they completed the redistricting plan in 2005. That is, they split precincts across two Congressional districts that make up the county. Of these split precincts, we found two precincts that were split across District 11 where Phil Gingrey the white Republican was the incumbent and District 13 where David Scott an African American Democrat was the incumbent. Thus, within these two precincts, some of the voters were in a House district with a white incumbent and some voters were able to vote for a Black candidate for the first time in 2006. Therefore, we can compare Black voters who were voting at the same location, but some were given ballots for a white candidate and some for a Black candidate. This design allows us to hold all precinct level covariates constant and as such is superior to the within-county design as a large number of factors are held constant by the design of the study.
Next, we examine when African American voters were moved from District 8, represented by Jim Marshall a white Democratic incumbent, to District 2 a seat held by Sanford Bishop, a Black Democrat, who has held that seat since it was drawn to be a majority–minority district in 1992. We found only two counties, Peach and Dooley, where African American voters were moved from areas which had never had a African American representative into the 2nd District. Figure ?? in the Online Appendix contains a map that outlines the geographic change in this area.
In sum, we examine four different majority–minority districts each with different overall profiles. Both District 1 in North Carolina and District 2 in Georgia contain no large metropolitan areas and are by and large rural districts. The counties in these districts tend to be poorer and less well-educated. The part of District 12 in North Carolina that we examine mainly encompasses the Winston-Salem metro area, a longstanding Southern urban area with a core that is predominantly African American. The part of District 13 in Georgia that we examine, Cobb County, is predominantly suburban and has grown more recently with the rise of Atlanta. Here, the residents are largely well educated with high incomes. We think these four areas provide a reasonable representation of areas in the South with African American voting blocs. Table ?? in the Online Appendix presents detailed information on the post-redistricting elections in Georgia.
In both states, we verified that precinct boundaries did not change as voters were moved from white to African American candidates. In many cases, the precinct identifier in both states is the name of the polling location. This allows us to know with a high degree of certainty whether polling places remained the same before and after redistricting thus holding voting costs constant. We also verified precinct boundaries using maps and GIS software. In Cobb County, we removed a few precincts from the study that were altered for the 2006 election.
Devices
Next, we review a number of devices that we use in the study. A device is information collected in hopes of distinguishing an estimated association from bias (Rosenbaum Reference Rosenbaum2010).
First, we make extensive use of placebo tests. Causal theories do more than predict the presence of an effect; they also predict the absence of an effect in the absence of treatment. For example, if we compare turnout before redistricting and find that turnout levels differ, any post-redistricting effects are suspect. Thus, for the statistical models we use, we apply it before redistricting occurred to ensure there is no difference between those who are later moved to an African American candidate and those that remained behind after redistricting.
Second we attempt to make use of within-county designs. In some cases, we will compare voters from entire counties that are moved into a majority–minority district to voters in counties that were not moved. In other instances, we will focus on a single county where some precincts from that county are moved from a district with a white candidate to a majority–minority district with an African American candidate or incumbent. We designate this second design as a within-county design since county is held constant. Within-county designs have the strength that in many states, especially in the South, election administration is done by county governments. Thus, some county governments may make it more difficult or easier to vote depending on the number of polling locations used or the number of voting machines at each polling location. In the within-county design, factors of this type will be held roughly constant.
Next, it is possible that there may be some time lag to the treatment effect. That is, there may be some delay before the representative can publicize himself or herself via casework or town meetings in these newly added areas. If so, voters may not be fully aware of having been moved into a district with minority representation at the first election. Alternatively, it may take time for a candidate to begin to mobilize new voters. To account for this, we estimate effects for two to three elections after redistricting occurs. This allows us to observe any possible delay in the onset of the treatment.
We also account for heterogenous treatment effects. That is, it might be the case that the effect of African American representation in majority–minority districts differs from district to district. We account for heterogeneity by looking at districts in separate analyses. We are unable to examine every district, but we select a representative set of districts for our study. This is a key contrast between our study and Fraga (Reference Fraga2016b). Fraga (Reference Fraga2016b) also uses a design based on redistricting, but pools results from ten different states. The difficulty with combining many elections is that we might obscure variation in the effect of the treatment.
Finally, we also leverage white voters. While we are focusing on how turnout among African Americans changes after redistricting, of course, a number of white voters are also moved by redistricting into these districts. We expect that whites moved into a district with a African American representative will feel little empowerment and may even react negatively due to racial resentment. Thus, for whites, we expect turnout to either stay constant or decline. If we find that turnout among whites uniformly declines this suggests that whites are turning out at lower rates given a negative reaction to being represented by an African American. If we find evidence of a decline in turnout for whites that would be consistent with past studies (Gay Reference Gay2001). A decline in turnout among whites also suggests that whites are aware that they have been moved to a district with an African American representative. If political awareness is roughly constant across white and African American voters, this suggests that African American voters should also be aware of the move to a representative that is African American. In short, if whites appear to react negatively to being moved to a majority–minority district, we can probably assume that African Americans are also aware of being moved. If turnout does not increase under this scenario, we can rule out the empowerment mechanism which also suggests that a lack of mobilization may be to blame.
DATA
For the period before and after 2000, we can obtain individual level data on turnout. To avoid an analysis with aggregate data, we use the voter files from both North Carolina and Georgia. The voter files contain whether registered voters voted in each election. There are a few other important covariates in the voter file as well including gender, age, race, and party registration in North Carolina. In North Carolina, we discarded the small fraction of African Americans that were not registered as Democrats. Restricting the analysis to Democrats among African Americans in North Carolina reduces the sample by less than 3%. Use of the voter file, of course, limits our analysis to registered voters. While this limits our inference somewhat, we think the tradeoff is worth it to avoid running afoul of the ecological inference problem.
For our analysis, we combined the individual level data in the voter file with two other data sources at the precinct level. The first data source is Census data from 2000. While the Census obviously contains many different covariates, we used the following Census measures: percentage of African Americans, percentage of African Americans that are of voting age, percentage with a college degree, percentage with a high school degree, percentage unemployed, percentage below the poverty level, percentage of housing that is renter occupied, and median age.Footnote 3 We also collected precinct level data from both state election boards. Specifically, precinct-level election data allowed us to measure partisan support for Federal offices, turnout, and the percentage of African Americans that are registered to vote. These are all measures that we expect state legislators to use when redistricting, thus we seek to ensure that these measures are comparable across our treated and control groups.
ANALYSIS
We conduct two different but related analyses. Both analyses are based on matching estimators. In the matching, we use a precinct level propensity score. Here, we estimate a logistic regression with Pr(D i =1) as the outcome variable and using all the precinct level Census, election, and turnout measures as predictors. We also match directly on the individual-level covariates from the voter file. As we noted above, race and party identification are held constant by stratification and thus we do not match on these measures. In the matching, we pay special attention to voter history by matching on it exactly. This means that people who did not vote in the last two elections are exactly matched to citizens who did not vote and vice versa. Since we have voting history for two elections, voters are matched exactly in a four level combination.
For every area that we study, we conduct two different matching analyses. The first match is a standard match where in each election year, we match treated voters to control voters using genetic matching to form our matched samples (Sekhon Reference Sekhon2011; Sekhon and Diamond Reference Sekhon and Diamond2013). Since propensity scores are estimated using precinct level data, they do not vary with individual level voters, therefore, we stratify the precinct level propensity score and exactly match within these propensity score subclasses. This is equivalent to a matching analysis with propensity score subclassification (Rubin Reference Rubin2008). We use ten propensity score subclasses, and we tend to lose some observations due to a lack of overlap, but the bias adjustment should be greater.Footnote 4 We also match on voting history as described above. With the matched data, we then estimate the turnout rate with a regression model adjusting for age and gender with clustering on precincts to account for within-precinct correlations. We implement this analysis, before and after redistricting occurred. We expect it to return no effect in the election before redistricting. In the placebo test analysis, for North Carolina, we exact match on turnout in 1996 and 1994; in Georgia we exact match on turnout in 2004 and 2002. If we fail this placebo test, we have decreased confidence in the estimates after redistricting since the groups were not comparable before the treatment occurred. In the first analysis we conduct separate matches for each election time period that we study, and we do not discard treated observations, except what occurs due to exact matching. This has the advantage of allowing us to include any new voters that have registered between 1998 and 2002 in the analysis. However, in this analysis if the placebo estimate is zero that serves as a general indication the areas are similar before treatment, but cannot account for possible changes that might occur in the district between elections.
The second matching estimator, however, is limited to the voters in the placebo test. Here, we started with a basic matching analysis in either 1998 for North Carolina or 2002 for Georgia, again using genetic matching. As before, we exact match on voter history, but we also match on age, gender, and the precinct-level propensity score. To build our inference directly on this placebo test, we simply tracked the turnout behavior of the matched voters who pass the placebo test in the subsequent treated elections after redistricting. In short, we are only willing to declare treated and control voters comparable if they pass the placebo test, and we then limit our inference to these voters by following their voting records through later elections. In the treated elections, we simply calculate the difference in turnout percentages across the treated and control voters. We use a χ 2 test to calculate whether this difference in percentages is statistically significant. In North Carolina, we track these voters during the 2002, 2004, and 2006 elections and calculate turnout rates in each year. In Georgia, we track voters through the 2006 and 2008 elections. This analysis requires us to exclude anyone that registered to vote between the placebo election and the election after redistricting. It is possible that citizens will be motivated to register and vote given the redistricting treatment, but they, by definition, cannot be included in the placebo test. The distribution of these voters might differ from those in the placebo test. We capture newly registered voters in the first matching analysis.
Often we find in the second matching analysis that if we retain all registered voters, the estimates do not pass the placebo test. When this occurs, we search for a subset of voters for whom the placebo test holds. We accomplish this by enforcing a caliper on the precinct-level propensity score. A caliper is a matching rule that stipulates that two matched pairs must be some minimum distance or they will not be matched. Application of a caliper invariably discards some treated observations. This makes the inference more local but reduces bias in the estimated treatment effect if it allows us to pass the placebo test. We enforce the caliper on the precinct level propensity score, since we know that assignment to treatment is based on these covariates. We started with a caliper distance of 0.2 times the standard deviation of the propensity score; this caliper distance is a useful starting point (Rosenbaum Reference Rosenbaum2010). If we observe no differences in turnout under this caliper distance, we increased the caliper distance to observe whether we could increase the number of observations used while still maintaining a zero-order placebo effect. We iterated this process until we found a caliper distance that produced a point estimate that passes the placebo test but drops the smallest number of observations. If a smaller caliper was necessary, we repeated the process until we found a subset of voters that satisfied the placebo test. Finally, to be clear, we do not use a caliper of this type in the first matching analysis. In that analysis, we seek to use as many voters as possible, so we do not use the caliper to enforce the placebo test result.
RESULTS
North Carolina
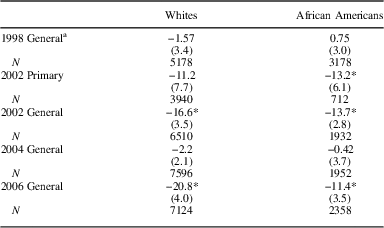
Table 1 contains estimates in two columns by racial category for the first matching estimator. We first examine the results from the placebo test in 1998 to understand whether our statistical adjustments are successful. For the placebo test, we wish to do more than simply find an estimate that is not statistically significant; the closer the estimated difference in turnout is to zero the greater confidence we have in our adjustments. As we can see in the first row of Table 1, the placebo test results are better for African Americans than whites. For African Americans, the estimate is less than a single percentage point, while for whites the difference is one and half percentage points. As we mentioned before, we might expect this primary to be singularly competitive since the seat is open and might energize African American voters who have been newly shifted into District 1. However, we find a large decline in turnout for both racial categories. That is for African Americans who were moved into District 1 with African American candidates, turnout was around 13 points lower in both the primary and general election. In the 2004 general, turnout is basically the same for both sets of voters. In 2006, however, African American turnout in District 1 was again lower by more than 5 percentage points.
Matching Estimates of Turnout Levels for US House District 1

Note: Cell entries are the treated minus control difference in turnout with standard errors in parentheses. Treated voters are those moved by redistricting from a white Republican incumbent in 2000 to an African American candidate in 2002. Standard errors adjusted for precinct-level clustering. We omit 2000 as a placebo test since the first treated year is 2002 a midterm election
a Placebo estimates: all voters are in the same Congressional district in this year.
*p-value <0.05.
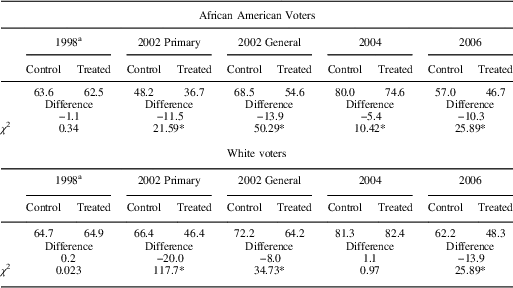
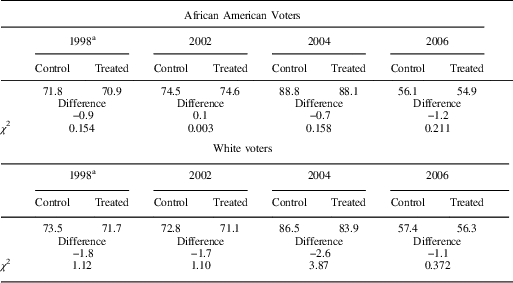
Next, we turn to the longitudinal analysis in Table 2. While this analysis excludes citizens that registered to vote between 1998 and 2002, it allows us to exactly track voters who voted at similar rates before redistricting. The general pattern from the previous analysis repeats itself. In 1998, we observe a difference of around one percentage point that is not statistically significant for African Americans and less than a half a percentage point for whites. When we recalculate the turnout rate for this same subset of voters in 2002, where the treated voters are now in a majority–minority district with an African American candidate in an open race, we find that turnout is lower by nearly 12 points and 20 points. Turnout for the treated voters remains lower in both 2004 and 2006. Thus, all the evidence we have seen so far indicates that political participation by African American moved to a district with an African American candidates actually declines, and the behavior of whites mirrors that of minorities. We next turn to our second area of analysis in North Carolina.
Turnout for Elections in US House District 1 Among Voters With Similar Voting Rates in 1998

Note: Cell entries are the estimated turnout percentages for treated and control groups. Treated voters are those moved by redistricting from a white Republican incumbent in 2000 to an African American candidate in 2002. Sample size for African Americans is 2456 and for whites is 4692.
a Placebo estimates: all voters are in the same Congressional district in this year.
*p-value<0.05.
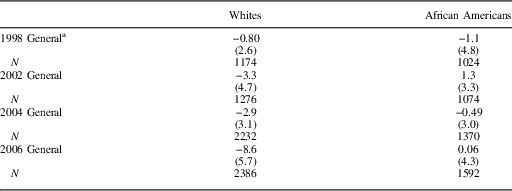
We repeat the same two matching analyses for voters in Forsyth county, who were moved from a Republican in the 5th House District to a African American incumbent in District 12. The analysis, here, has the advantage of being a within-county design, so all county-level factors related to election administration are held constant. The other key difference between here and District 1 is that we are now studying an urban area instead of a largely rural area. Table 3 reports the estimates after we matched on individual level covariates and used subclassification on the precinct level propensity score. Here, we find our corrections work better than in District 1. For African Americans, the placebo effect estimate is a 10th of a percentage point, and for whites the placebo difference is less than a percentage point. The results do differ between racial categories. For African Americans, we find very little difference between the controls who stayed with a white candidate and the treated units that moved to an African American candidate. In each election between 2002 and 2006, the estimated difference never exceeds half of a percentage point. For whites, however, the differences are clearly negative in the post-treatment period, though these do not reach statistical significance once we adjust for clustering at the precinct level.
The Effect of House Candidate Race and Redistricting in US House District 12

Note: Cell entries are the treated minus control difference in turnout with standard errors in parentheses. Treated voters are those moved by redistricting from a white Republican incumbent in 2000 to an African American candidate in 2002. We omit 2000 as a placebo test since the first treated year is 2002 a midterm election.
a Placebo estimates: all voters are in the same Congressional district in this year.
Table 4 contains estimates for the voters that we tracked from 1998 to subsequent elections. First, we review results for African American voters. In 2002, the placebo test effect is mere 10th of a percentage point. In 2004 and 2006, we observe minor differences that are not statistically significant. For white voters, there is little evidence of any change since subsequent estimates are quite close to the estimated placebo difference.
Turnout for Elections in US House District 12 Among Voters With Similar Voting Rates in 1998

Note: Cell entries are the estimated turnout percentages for treated and control groups. Treated voters are those moved by redistricting from a white Republican incumbent in 2000 to an African American candidate in 2002. Sample size for African Americans is 1552 and for whites is 2806.
a Placebo estimates: all voters are in the same Congressional district in this year.
Thus the pattern for voters moved to District 12 differs from that of voters moved into District 1. Here, we find that when African American voters are moved to a district with an African American candidate little changes in terms of turnout behavior. The difference in the results—strongly negative to nearly zero—across the two areas of North Carolina suggest that our concerns about treatment heterogeneity were justified. That is the effect may differ from place to place. Pooling such disparate estimates will be highly misleading. We now turn to Georgia.
Georgia
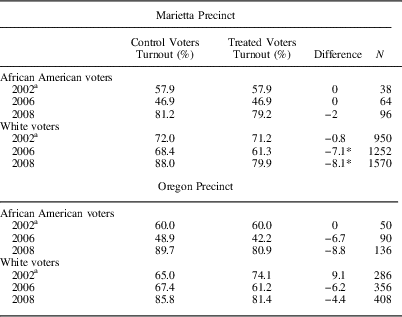
We begin with the results from Cobb County. We report the results from full county analysis in the Online Appendix. The full county results are consistent with what we have found thus far. That is, for African Americans that are moved into District 13, turnout either does not change or declines. For white voters, turnout declines by around three percentage points. Here, we report results for the two split precincts, where voters in the same precinct were in different Congressional districts. For these analyses, all precinct-level covariates are held constant by the design. As such we only use covariates from the voter file. To that end, we match on age and gender with an exact match on voting history. We use the county-designated precinct names of Marietta and Oregon.
Table 5 contains the results after exactly matching on voter history and matching on age, age-squared, and gender. For African Americans, in both of the split precincts, the empirical pattern is similar. First, we are able to produce perfect placebo outcomes. That is voting rates before redistricting were identical. In the Marietta precinct, we observe no change in 2006 and a slight decline in 2008. In the Oregon precinct, turnout declines in both subsequent elections. For white voters, the results are quite different in that for both precincts there is some evidence of a decline in turnout. In the Marietta precinct, the placebo difference is satisfactory at less than a percentage point. In the Oregon precinct, however, the placebo difference is quite large, but in both districts we observe large declines in turnout for both 2006 and 2008. In the Oregon precinct, we see a large reversal as the difference in 2002 is 9.1 points but is −6.2 points in 2006, a substantial reversal, though there is not enough power to rule out the possibility that zero is contained within the confidence interval.
Turnout Levels After Matching for Cobb County: Split Precincts

Note: Cell entries are the turnout percentages after adjustments via matching. Treated voters are those moved by redistricting from a white Republican incumbent in 2004 to an African American incumbent in 2006. Each precinct was split across Congressional districts, and all voters voted at the same polling place.
a Placebo estimates: all voters are in the same Congressional district in this year.
*p-value <0.05.
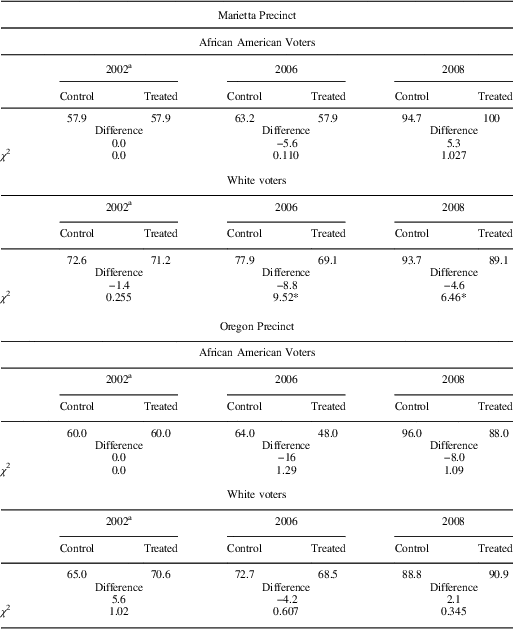
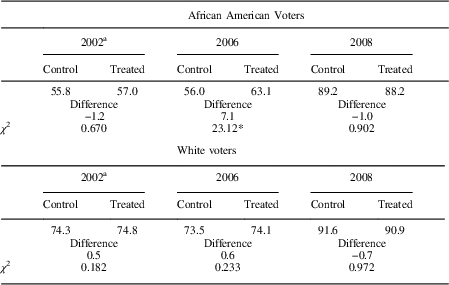
Table 6 contains results from our longitudinal analysis. The pattern, here, is quite clear. In three of the four analyses, the placebo results are good to excellent with two of them being exactly zero. In all cases, however, we observe declines of 4 percentage points or more in 2006. In 2008, the estimates are split evenly between negative and positive without any clear pattern. In general, we observe good placebo estimates followed by either a one or two election decline in turnout rates. There is, however, no evidence of turnout increasing.
Turnout for Elections in Cobb County Among Voters With Similar Voting Rates in 2002: Split Precincts

Note: Cell entries are the estimated turnout percentage in treatment and control groups. Treated voters are those moved by redistricting from a white Republican incumbent in 2004 to an African American incumbent in 2006.
a Placebo estimates: all voters are in the same Congressional district in this year.
*p-value <0.05.
We now report the results from the 2nd House District in Georgia. Like District 1 in North Carolina, this Congressional district is either rural or made up of small towns. As we mentioned earlier, we rely on the second redistricting in Georgia. Thus, we use the results from 2002 as our placebo estimates. That is we compare voters who were moved to an African American candidate in 2006 and had been able to vote for an African American House representative at anytime before then. We were careful to not include any areas that were moved to an African American member of Congress in 2002, but were then moved out of that district in 2005. Here, we examine voters that were moved from a white Democratic incumbent to an African American incumbent.
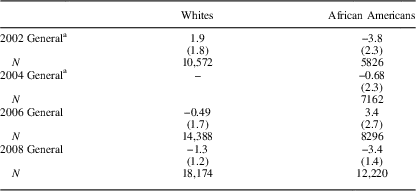
Table 7 contains estimates for voters in both racial categories. First, we review results for African Americans. Strictly speaking, we pass the placebo test in 2002 since the estimates are not statistically significant, but the point estimate is fairly large at 3.8 percent. Given this poor result, we also estimated a placebo test for 2004. In 2004, the placebo results are much better with estimated differences of less than 1 percent. This implies that we should have greater faith in the estimates for 2008 than 2006. Here, we do observe a small increase in turnout in 2006; it is over 3 percentage points. In both cases, we cannot rule out that zero is contained within a 95% confidence interval. In 2008, we observe that turnout for those moved is lower relative to those that were not moved. Thus, we see some weak evidence for an increase in turnout due to voters moving to an African American candidate. Whatever increase we observe, however, appears to be temporary. Moreover, in 2008 when the estimates pass a placebo test, we observe a decline in turnout among the treated. For whites, the placebo test effect is rather large at just under two percentage points. The estimates in 2006 and 2008 are negative but small in magnitude and are small relative to their estimated standard errors.
The Effect of House Candidate Race and Redistricting in US House District 2

Note: Cell entries are the treated minus control difference in turnout with standard errors in parentheses. Treated voters are those moved by redistricting from a white Democratic incumbent in 2004 to an African American incumbent in 2006.
a Placebo estimates: all voters are in the same Congressional district in this year.
Table 8 contains the results from our longitudinal analysis. The pattern here is nearly identical to that in Table 7. For African Americans, the results from the placebo test are improved but not perfect as we observed a difference of 1.2 percentage points. In 2006, however, turnout increases just over 7 percentage points. Importantly, this is the first evidence we have found of an increase in turnout for voters moved to an African American candidate. In 2008, however, turnout in the treatment group is lower by 1 percentage point. Thus, the increase we observed in 2006 appears to be temporary. For white voters, the placebo difference is improved at half a percentage point. We find no evidence of change in post-treatment elections as both differences are small and not statistically significant.
Turnout for Elections in US House District 2 Among Voters With Similar Voting Rates in 2002

Note: Cell entries are the estimated turnout percentage in treatment and control groups. Treated voters are those moved by redistricting from a white Democratic incumbent in 2004 to an African American incumbent in 2006. Sample size for African Americans is 4424 and for whites is 5676.
a Placebo estimates: all voters are in the same Congressional district in this year and estimates should be zero by construction.
*p-value <0.05.
Overall Results
Thus far, we have conducted a large number of different analyses that do little to convey an overall trend in the various point estimates. We conclude with one final analysis to remedy this omission. In the final analysis, we used each point estimate as a matched pair difference, and used the Wilcoxon signed rank test as a summary analysis. This allows us to test the hypothesis that all these effects are zero, and estimate the magnitude of the overall effect across every matched analysis. This also allows us to conduct an analysis for sensitivity to hidden confounding. A sensitivity analysis allows us to quantify the amount of confounding that would have to be present to reverse our conclusions. The appendix contains the details on the sensitivity analysis we use, but see Rosenbaum (Reference Rosenbaum2010) for additional details on this type of sensitivity analysis.
For the African Americans, we find the median difference in turnout is −3 points, and is statistically significant (p<0.001). For white voters, the median difference in turnout is −2.95 points, and this estimate is also statistically significant (p<0.001). In both cases, it appears that turnout decreased. For African Americans, Γ=2.17 before the estimate is no longer statistically significant at the 0.05 level. For white voters, Γ=2.61 before the estimate is no longer statistically significant at the 0.05 level. Thus in both cases, a hidden confounder would have to more than double the odds of treatment for treated voters to reverse our conclusions.
DISCUSSION
In general, we find the following pattern. When whites are moved to a district with an African American representative it appears that turnout tends to decline. For African Americans, negative point estimates are less pervasive but not uncommon. In only one instance do we find a point estimate that is in the right direction and of relatively large magnitude. This suggests that voters know that the race of their representative has changed. White voters appear to vote less in response, while African American appear to respond with indifference. Mostly likely, the reason African Americans do not vote in greater numbers is due to the uncompetitive nature of these races, which means that mobilization efforts are rare to non-existent. Other work using mayoral data in Louisiana finds that co-racial turnout only increases in elections that are more competitive (Keele et al. Reference Keele, Shah, White and Kay2017). Competition is generally missing in the races we consider, and is often missing from many elections in minority influenced districts.
This brings us back to the topic of empowerment. Our results suggest that voter mobilization is an important mechanism. If so, this implies that empowerment does not exist in a vacuum. Empowerment, on its own, may not be enough to motivate minority voters, especially when a co-racial candidate is already an incumbent and has a record of winning easily. However, as we noted, finding evidence for empowerment in studies like ours will always be difficult given that we only observe turnout behavior in the voter file. We would argue that a series of lab experiments or focused field experiments would be a better avenue for understanding the role of empowerment in African American turnout.