I. INTRODUCTION
Polymer thin films fabricated using low-temperature nonequilibrium plasma techniques are actively studied for their physical and chemical stability and low cost, uncomplicated production.Reference Forrest1 From one precursor, polymers of significantly different chemical and physical structures or films with property gradient can be obtained by controlling deposition conditions of polymerization. Such conditions include the energy delivered into the reaction chamber, monomer flow, geometry of the reactor, addition of gas, and so on.Reference Shi2 Furthermore, compounds not amenable to conventional thermochemical polymerization pathways can be polymerized using plasma techniques. Given their high adhesion to the substrate and smooth, defect-free, and uniform surfaces, plasma polymers have already found their application as antiscratch barriers and protective coatings. These include corrosion-protective barrier coatings on reflectors and metallic surfaces, coupling and corrosion prevention layers on steel, adhesion promotion pretreatments on aluminum, gas permeation barrier coatings in packaging, and resist in microfabrication processing.Reference Beake, Zheng and Alexander3 Organic plasma polymers are currently attracting significant interest for their potential in the areas of mechanics, flexible electronics, and optics. The ability to retain certain functionalities of the organic precursor in the polymer film also renders these materials attractive to the field of biotechnology. Here, organic plasma polymers can take role of biomaterials, tissue scaffolds, hydrophobic antifouling coatings, and as antireflective coatings on polymeric ophthalmic lenses.
Whether within an electronic device or as a bioactive coating, the mechanical and morphological properties of these films influence the nature of application, performance, and longevity of these materials. Furthermore, the morphology of the surface is known to influence the wetting behavior of the solid films, the latter being an important consideration with regard to biomedical prospect of these materials. Hence, to determine potential applications of such organic polymer thin films and to optimize such a material for specific applications, an understanding of the relationship between the fabrication parameters and the resultant mechanical properties of the plasma polymer is required.
Techniques such as microhardness and tensile testing are commonly used to study the mechanical characteristics of a wide range of bulk amorphous polymers. They provide useful information with regard to materials’ elastic modulus and microstructure, as well as the effect of molecular weight and composition on the mechanical behavior of these materials. Although functional for bulk polymers, these techniques have limited characterization capacity when it comes to investigations on thin plasma polymer film structures and coatings since many of the above-mentioned applications require thin films of below 100 nm in thickness. Relatively large loads and penetration depths required to image the indent lead to results being dominated by substrate contribution. Furthermore, the technique does not offer information on the elastic properties of the thin films. Depth-sensing indentation (or nanoindentation), on the other hand, was initially developed for studies on plastic‑elastic materials. It applies very low loads and small depths and therefore can be successfully used for characterization of plasma polymerized thin films.Reference Cech4 Similarly, the adhesion and fracture strength of ultrathin or soft plasma polymer films can be evaluated using a nanoscratch test that allows for high-resolution application of ultralow scratch loads and acquisition of displacement data as films deform and fail.
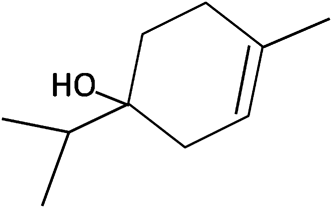
Here, we study the nanotribological and nanomechanical properties and surface morphology of the plasma-polymerized terpinen-4-ol (polyterpenol) thin films fabricated under various deposition conditions.Reference Bazaka, Jacob and Bowden5 The chemical structure of terpinen-4-ol monomer is presented in Fig. 1. Polyterpenol is a transparent insulating material with refractive index just above that of glass.Reference Bazaka and Jacob6, Reference Bazaka and Jacob7 It is characterized by sound physical and chemical stability, and its tunable onset degradation temperature and low postannealing retention rates suggest polyterpenol as a potential sacrificial material for fabrication of air gaps and sealed nanochannels.Reference Bazaka and Jacob8 Polyterpenol films fabricated at low power conditions have been shown to prevent adhesion and propagation of selected human pathogenic bacteria, Staphylococcus aureus and Pseudomonas aeruginosa, indicating the material can be applied as an antibacterial and antifouling coating for indwelling medical devices.Reference Bazaka, Jacob, Truong, Wang, Pushpamali, Wang, Ellis, Berndt, Crawford and Ivanova9, Reference Bazaka, Jacob and Ivanova10 Polyterpenol films implemented as a surface modification of the gate insulator in pentacene-based organic field effect transistor (OFET) significantly shifted the threshold voltage, improved the effective mobility and the switching property of the polyterpenol-containing OFET.Reference Jacob, Bazaka, Weis, Taguchi, Manaka and Iwamoto11, Reference Bazaka, Jacob, Taguchi, Manaka and Iwamoto12
Chemical structure of terpinen-4-ol.

II. EXPERIMENTAL
Plasma-enhanced chemical vapor deposition was used to fabricate thin polyterpenol films from nonsynthetic monoterpene alcohol precursor (Australian Botanical Products Ltd., Hallam, VIC, Australia) according to an experimental procedure described elsewhere.Reference Bazaka and Jacob6 External copper electrodes were used to capacitively couple the RF (13.56 MHz) power supply to the deposition chamber. Films were manufactured at room temperature and pressure of 100 mTorr under varied deposition conditions, such as time and input power, on precleaned glass substrates. The polymer films used in this study were deposited at 10, 15, 25, 50, 75, and 100 W RF power. Spectroscopic ellipsometer (model M-2000D, J.A. Woollam Co., Inc., Lincoln, NE) was used to estimate optical thickness and roughness of the deposited films.
An NT-MDT (Zelenograd, Moscow, Russia) atomic force microscope (AFM) was used in nanoindentation analysis, with the standard head replaced with a Triboscope indenter system manufactured by Hysitron, Inc. (Minneapolis, MN), which allows for application of a desired load on the indenter with an electrostatic force taking a role of a transducer. Berkovich indenter (70.3° equivalent semiopening angle) was used in indentations, and instrument compliance was calibrated using fused silica. Preliminary images of the samples under investigations were collected to evaluate the roughness of the area to be indented. The indentation profile consisted of loading, holding, and unloading. Typical loads used in the indentation ranged from 100 to 700 μN with fixed loading time and hold time of between 2 and 5 s. The loading and unloading rates and the time associated with each segment were varied to investigate the effect of these parameters on the resultant hardness and modulus values. In the load−partial unload experiment, several cycles of loading to gradually increase depth and unloading to 10% of the maximum load for that cycle are performed with the tip of the indenter remaining in contact with the sample. The loading/unloading rate and holding time was kept constant at 100 μN/s and 20 s, respectively, with 50–800 nm depth range. The technique is another tool to capture the variation in mechanical properties of the thin film‑substrate system as a function of indentation depth.
The indentation process was monitored continuously during loading and unloading phases with respect to displacement, force, and time. The contact area for each indent was calculated from the stiffness vales and the known modulus for quartz. Contact parameters and mechanical properties of the films are derived from the contact area and load‑displacement curve as proposed by Oliver and Pharr.Reference Oliver and Pharr13 In the case of polyterpenol, the unloading stiffness was calculated after polynomial fitting of 90% of the unloading curve. The contact depth h c is established using elastic analysis developed by Sneddon for the penetration of a flat elastic half space by probes of axisymmetric shapes as h c = h max – ε (P max/S), where h max is maximum depth, ε is a constant dependant on the pressure distribution established after the plastic deformation and is a function of the geometry of the indenter, P max is maximum force, and S is contact stiffness. For Berkovich indenter, ε is usually assumed to take a value of 0.75. The contact stiffness S is defined as  and
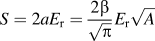 , where P is the indenter load; h is the depth of penetration by the indenter; a is the contact radius; β is a correction factor that depends on the material properties, the geometry of the indenter, and the penetration depth;Reference Abbes, Troyon, Meza and Potiron14 E r is the reduced modulus; and A is the projected (cross-sectional) contact area. Recently, Abbes et al.Reference Abbes, Troyon, Meza and Potiron14 demonstrated the dependence of β on the penetration depth and tip for elastic−plastic materials, and the consequent effect on hardness and elastic modulus measurements. In this study, the correction factor β of 1.034 was used in the calculations to account for the tip geometry of Berkovich indenter; the dependence of β on the material properties of the fused quartz and polyterpenol samples was not investigated, thus limiting the quantitative merit of the results obtained. However, qualitative assessment of the evolution of sample hardness with RF power can still take place assuming that not taking into account the material-related β factor correction produces a systematic bias of the same order of magnitude for the different polyterpenol samples. The hardness of the film sample H is derived from the peak force applied to the sample P max and the projected contact area A, as
 , where A = f (h c). The reduced elastic modulus accounts for the deformation of both the indenter and the thin polymer film and can be expressed through
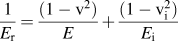 , where E is the elastic modulus of the sample, ν is related to Poisson’s ratio of the specimen under investigation, and E i and ν i are the elastic modulus and Poisson’s ratio pertinent to the material of the indenter.
In nanoscratch experiment, the samples were subjected to a ramp force profile, with a maximum force of 2000 μN, a scratch length of 20 nm, over 30 s. As with indentation experiments, Berkovich probe was used for scratching, with orientation of the Berkovich tip being between the face forward and edge forward relative to scanning direction.Reference Chen, Bakshi and Agarwal15 A two-dimensional force transducer of the nanoindentation probe allows for force measurements in the lateral and vertical directions, from which the friction coefficient of a material can be determined as the ratio between the lateral force and the normal (applied) force.Reference Lafaye and Troyon16, Reference Brechignac, Houdy and Lahmani17 Multiple measurements collected for each sample were plotted as normal displacement versus normal force to estimate adhesion between the polymer thin film and the glass substrate. Visual examination of the surface in response to the deformation was conducted using postscratch topographical scans. The cross-hatch test using the Elcometer 107 (Manchester, United Kingdom) kit was also performed to obtain a standardized (ASTM D3359) qualitative assessment of the adhesion between polyterpenol films and glass substrate.
III. RESULTS AND DISCUSSION
A. Surface morphology
The surface morphology of polyterpenol thin films fabricated under different RF power conditions was studied using AFM in semicontact mode. When comparing to AFM contact mode, where the high tip-to-surface forces can mechanically deform the surface under the investigation, the short intermittent contacts between the tip and the sample surface characteristic of AFM tapping mode reduce the inelastic deformations to the surface of the sample. Furthermore, the effective forces applied to the surface are smaller than those of the contact mode.
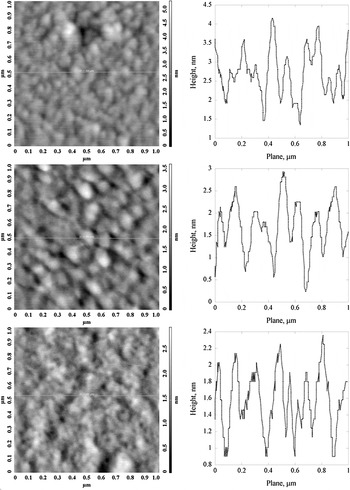
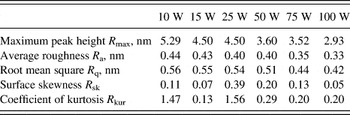
Scanned images representative of the samples are presented in Fig. 2, and roughness parameters for the films are summarized in Table I. The surface of unmodified glass substrate was also scanned and used as a reference. Independent of deposition power, polyterpenol coatings were smooth, uniform, and defect free, lacking comparatively prominent features (maximum peak height of 15.1 nm) present on the surface of unmodified substrate. Smooth surface of polyterpenol films indicates that the polymerization reactions took place predominantly on the surface of the glass substrate rather than in the gas phase.Reference Hu, Zhao, Uddin and Lee18 The maximum peak height (R max) decreased for films deposited at higher RF power, from 5.29 nm for 10 W to 2.93 nm for 100 W. The average (R a) and root mean square (RMS) (R q) surface roughness parameters also decreased, from 0.44 nm and 0.56 nm for 10 W to 0.33 nm and 0.42 nm for 100 W, respectively. These roughness estimates were in agreement with previously reported roughness values for polyterpenol established by means of spectroscopic ellipsometry.Reference Bazaka and Jacob6
Typical two-dimensional atomic force microscope (AFM) images and surface profiles of polyterpenol thin film surfaces deposited at 10 W (top), 50 W (middle), and 100 W (bottom) from approximately 1 × 1 μm2 scanned areas.

Roughness of polyterpenol thin films deposited under different input power conditions.

According to Pelliccione and Lu,Reference Pelliccione and Lu19 there are multiple factors that would influence the formation of a complex morphology on the surface of a thin film grown via plasma-assisted chemical vapor deposition. Therefore, the roughness parameters of polyterpenol films were also investigated as a function of film thickness and deposition rate. Thinner films (below 100 nm) were characterized by a slightly lower R q compared to films of thickness between 300 and 2000 nm fabricated under similar deposition conditions. A similar trend for plasma-polymerized trans-2-butene was reported, where overall increase in RMS roughness was attributed to the increase in low frequency contributions.Reference Collins, Letts, Fearon, McEachern and Bernat20 Higher deposition rate (1 μm/h versus 0.2 μm/h) also resulted in the increase in the surface roughness of the film due to the particles in the growth region unable to relax fast enough before the next layer of the film is assembled.Reference Johnston and Ratner21 The degree of surface roughness has also been demonstrated to depend on the deposition temperature, with higher temperatures resulting in the increased surface relaxation rate that allows the short wavelength roughness amplitudes to relax toward longer wavelength more quickly, resulting in a smoother surface of the plasma film.
All polymer thin films displayed a surface skewness (R skw) greater than 0 and coefficient of kurtosis (R kur) less than 3, i.e., the R skw values describe a disproportionate number of peaks pertaining to the polyterpenol surfaces, and the R kur values signify the surfaces with well spread out height distribution.Reference Lamolle, Monjo, Rubert, Haugen, Lyngstadaas and Ellingsen22, Reference Gadelmawla, Koura, Maksoud, Elewa and Soliman23 There was no observed dependency of the surface skewness (R skw) and coefficient of kurtosis (R kur) values on the deposition power used during polyterpenol film fabrication.
Surface morphology is known to influence the wetting behavior of the solid films, namely the hysteresis and the mean contact angle of the liquid drop placed on the surface. It has been demonstrated that for hydrophilic surfaces, where cos θ>0, the effective contact angle on rough surface is smaller than the Young’s angle of chemically comparable smooth surface. Previous water contact angle studies on polyterpenol films fabricated under varied RF power showed an increase in θ with deposition power, the increased hydrophobicity predominantly attributed to a decrease in oxygen-containing functionalities present at the surface of the polymer. For films deposited at 100 W, water contact angle was determined to be approximately 75°, compared to approximately 60° estimated for 10 W films. Given that hydrophilicity is amplified by roughness of the surface, as described by Wenzel,Reference Wenzel24 the decrease in surface roughness with deposition power is also likely to contribute to increased hydrophobicity of the surface.
B. Nanoindentation
Many factors, including the mechanical strength and thickness of plasma polymer thin films, residual stress, and chemical bonds at the interface, are thought to affect the adhesive or cohesive strength of the material. Mechanical failure can take form of delamination at the interface due to lower adhesive strength; the other form of mechanical failure of the coating is cracking or brittle failure in the thin film due to lower cohesive strength. Determination of adhesive or cohesive strength in combination with identification of the critical failure sites can be used to determine factors that may contribute to debonding of the coating and potential failure of the device. The effect of experimental conditions at which the nanoindentation and nanoscratch test are performed, such as the indentation load, loading rate, and hold time in the case of nanoindentation, and the scratching speed, loading rate, and probe radius should also be accounted for to ensure the correct interpretation of the results.
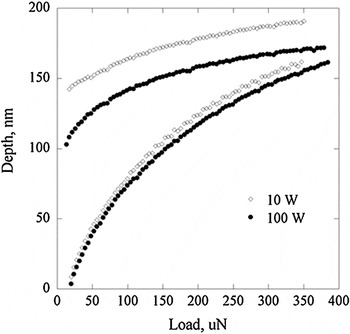
Mechanical properties of plasma-polymerized polyterpenol deposited under different RF power conditions were investigated using a single indentation method and a load‑partial unload technique. Illustrative single indentation curves from 2000-nm-thick polyterpenol film fabricated at 10 and 100 W are presented in Fig. 3. It is not uncommon that the tip would continue to move into the surface of the sample during the holding time as a result of viscous creep of the material. The observed divergence between the unloading and loading curves is a reflection of a residual plastic deformation within the indented film. As can be seen from polyterpenol material response to the indentation, the film deposited at 10 W is softer than one fabricated at 100 W, with less elastic recovery observed during unloading for the former. Furthermore, the softer 10-W film displays more extensive creep deformation occurring during the hold period at maximum load. Single indentations under similar load conditions performed at randomly chosen locations on the surface of the samples confirmed lateral homogeneity of the indentation behavior of the films.
Typical single indentation force‑displacement curves collected for polyterpenol thin films deposited at 10 and 100 W, film thickness 2000 nm.

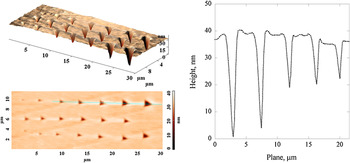
Figure 4 shows typical repeat single indentation profiles under increasing indentation load of polyterpenol film deposited at 75 W. To collect thin film with only plastic response, indentation depths of no more than one-tenth of the overall thickness of the film were used, so that the stress field remains within the film and the measurement is not influenced by the substrate. The variation in hardness with indentation depth was determined from repeated single indentations on films fabricated under different RF power conditions. It is possible that polyterpenol thin films examined in this study are slightly harder at the surface of the samples, at indentation depth below 130 nm. More likely, however, is that the chain molecular mobility is being restricted in the confined region of mechanical contact adjacent to the probe, with shallower indents resulting in a more profound expansion impediment due to intrinsic length scales of the material such as the polymer chain length.Reference Kranenburg, Tweedie, van Vliet and Schubert25 Tweedie et al.Reference Tweedie, Constantinides, Lehman, Brill, Blackman and van Vliet26 proposed that the superposed contact stress shifts T g at the probe−amorphous polymer interface, resulting in a mechanically distinct region confined between the polymer and the diamond probe. Such a region may be characterized by a combination of unique structural and physical properties, with an apparent stiffness that exceeds the elastic response of the bulk polymer. Furthermore, the choice of the probe material may influence the attraction toward and repulsion from the probe, consequently affecting the molecular mobility within the contact region via intermolecular interactions or via stretching or alignment of polymer chains with regard to the surface of the probe.
Typical AFM image of plastic impressions remaining in polyterpenol sample fabricated at 75 W after indentation under different load conditions.

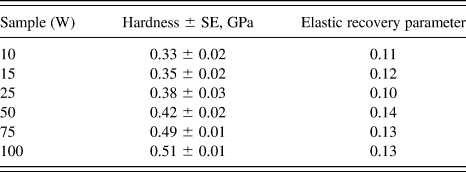
It is difficult to determine a definite trend in the hardness of the polyterpenol thin films with indentation depth due to multiple sources of error. These include the relative nonuniformity of the indent, such as pile-up and sink-in phenomena observed on some samples, and associated with it difficulties in precise estimation of the indent area (possible overestimation in the case of pile-up and underestimation due to sink-in features), respective influences of material properties and sample thicknesses, creep, to name but a few. In addition, as the indent is imaged with the same tip that was used in the actual indentation process, there is a possibility of imaging artifacts and tip effects affecting the precision of the measurement. Hence, the values presented in Table II are indicative of the evolution of the hardness properties of polyterpenol under changing fabrication conditions and may quantitatively differ from the actual material properties due to aforementioned measurement constrains.
Mechanical properties of plasma-polymerized polyterpenol thin films (at 500-μN load).

Above the plastic depth of 130 nm for films deposited at 10, 15, and 25 W, and above 100 nm for films fabricated at 50, 75, and 100 W, hardness levels off to an approximately constant value, indicating there is no significant variation in the structure of polyterpenol coating across its thickness. The variation in the mechanical properties of polyterpenol thin films with indentation depth examined using load−partial unload technique revealed that at depths below 200 nm, the depth profile of the hardness follows a trend similar to that determined using the single indentation approach. Above the plastic depth of approximately 200 nm, the hardness of the system gradually increases due to the stress field no longer being contained within the body of the coating. As the influence of the mechanical properties of the substrate on the elastoplastic response of the film‑substrate system becomes more prominent, such data becomes less representative of the coating itself.
To evaluate the effect parameters such as loading time and dwell time have on the indentation behavior of polyterpenol films, additional single indentations were performed on samples deposited at 50 W. At constant load of 700 μN, increasing loading and unloading time with rates (r) ranging from 0.5 to 20 nm/s decreased calculated hardness value from 0.44 GPa to 0.40 GPa. As the contact depth at maximum load is influenced by creep deformation taking place during the holding time, the hardness values obtained using these maximum contact depth estimates will also be affected. Calculated from the tangent of the slope of the unloading curve, the modulus will also be directly impacted by the choice of the holding time. Where holding time is absent or insufficiently low, the film will continue to deform viscoplastically during unloading leading to distortions in the shape of the unloading curve. In the case of polyterpenol thin films, increasing the hold time from 3 to 25 s at constant load of 400 μN resulted in a decrease in the calculated hardness from 0.43 to 0.39 GPa. A logarithmic creep expression h = AIn(Bt + 1), where h is increase in depth at P max, t is the holding time, and A and B are fitting parameters, can be used to describe the creep data for polyterpenol, as it has been previously used to illustrate the indentation-induced time-dependent part of the plastic deformation of a number of polymers, ceramics, and glasses.Reference Beake, Zheng and Alexander3 Parameters A and B which relate to the general susceptibility to creep and the rate of the exponential creep process, respectively, did not change significantly under varied holding time conditions, with A at approximately 3.55. To compare, Beake et al. estimated that fused silica has A of approximately 2.2, whereas the value for poly(ethylene terephthalate) (PET) is in the vicinity of 10.1. This indicates that in their creep behavior, polyterpenol films resemble fused silica more than they do traditional polymers due to the high degree of cross-linking characteristic of plasma films. The presence of covalent bonds that connect polymer chains results in restricted chain movement within the polymer film, and hence the better creep resistance of polyterpenol. Creep constant k can be estimated from the plot of the plastic deformation as a function of holding time using H = H 0 t−k, where H is hardness, H 0 is the hardness at t =1 min, and t is the holding time. For polyterpenol thin films fabricated at 50 W, the creep constant was determined to be approximately 0.05, similar to that reported k of 0.07 for plasma-polymerized hexane films, and k values of approximately 0.04 and 0.09 for such conventional thermoplastics as PET and poly(ethylene oxide), respectively.Reference Beake, Zheng and Alexander3
Regression analyses of the force curves collected for the polyterpenol samples indicated the hardness increased with the deposition power, from 0.33 GPa for 10 W to 0.51 GPa for 100 W at 500-μN load, as presented in Table II. The elastic recovery was calculated as (h max − h c)/h c, where h max is the maximum indent depth and h c is the contact depth. For polyterpenol films, the elastic recovery parameter was estimated to be between 0.1 and 0.14. The increase in hardness is attributed to the increase in the degree of cross-linking within the polymer thin film as a direct consequence of the increased RF power delivered into the deposition chamber,Reference Cech, Cechalova, Trivedi and Studynka27 which is in agreement with previously reported Fourier transform infrared spectroscopy (FTIR) and x-ray photoelectron spectroscopy (XPS) results. Highly cross-linked polymers are significantly more rigid and compact compared to conventional amorphous or crystalline polymeric structures as the vibrational movement of the carbon backbone of the polymer is restricted by the presence of a multiple covalent bonds between polymer chains, conferring improved mechanical properties to this three-dimensional structure compared to a linear thermoplastic polymer.Reference Bae, Cho, Choi, Cho, Hong, Jeong and Boo28, Reference Rangel, Cruz and Lepienski29 Studies conducted on hexamethyldisiloxane and acetylene films demonstrated further improvement of the hardness and wear resistance of these plasma-polymerized coatings can be achieved by applications of such postdeposition treatments as an oxygen plasma treatment and ion implantation, respectively.Reference Rangel, Cruz and Lepienski29, Reference Benítez, Martínez and Esteve30 The modification is generally localized to the surface region of the film.
C. Nanoscratch
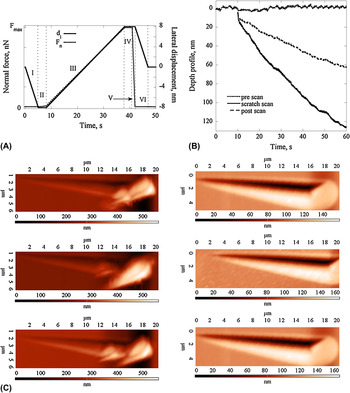
Figure 5 presents the nanoscratch depth profiles for polyterpenol thin films for a maximum normal load of 2000 μN. The initial state of the surface preceding the scratch is reflected in prescratch curve, the scratch scan curve corresponds to the actual tip penetration into the sample in the course of the testing, whereas the postscan curve is a representation of residual deformation of the sample coating as a result of scratching, i.e., the plastic deformation of the probed coating after unloading the tip. In the case of polyterpenol thin films, the deviation between scratch and postscan curve indicates partial elastic recovery of the film sample. The residual plastic deformation was also confirmed by AFM scans, as presented in Fig. 5. Pile-up along the scratch trace and at the point of maximum applied normal load is noticeable on the AFM images of polyterpenol films deposited at lower RF power (depicted by the lighter shading of the AFM image), indicating different mechanism of mechanical deformation for these coatings. Upon loading, the constant slope of the scratch scan indicates a homogenous mechanical response of the material. Application of similar maximum normal loads resulted in higher scratch depths in the case of samples fabricated at lower RF powers, indicating these coatings are softer compared to polyterpenol films deposited at increased RF power levels.
(a) Nanoscratch normal force F n and lateral displacement d l curves. (b) Nanoscratch depth profile for the polyterpenol thin film coating tested with ramping normal load of 20−2000 μN. (c) AFM images of scratches performed on polyterpenol thin films fabricated at 10 W and 100 W under varied normal load; top panel 1000 μN, middle panel 1500 μN, bottom panel 2000 μN.

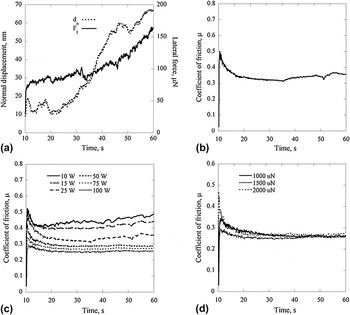
In Fig. 6, the nanoscratch data for polyterpenol thin films are presented as a plot of lateral force F 1 and normal displacement d n, and friction coefficient μs as a function of time. As the normal load increases, the evolution of the coefficient of friction for all the films show an increase to a stable value, with films deposited at higher RF power being characterized by lower values of the coefficient of friction. Figure 6(c) shows coefficient of friction profiles for polyterpenol as a function of deposition power and as a function of applied maximum normal load. Absence of significant fluctuations in the friction coefficient indicates no considerable damage, cracking, or delamination of the coating occurred. Coatings deposited at higher RF powers showed less mechanical deformation and hence are likely to be more stable and less susceptible to wear. Overall, all polyterpenol films were characterized by sound adhesion to the substrate. The friction coefficient was also found to be independent of the normal load applied during the nanoscratch test.
Nanoscratch data for polyterpenol thin films fabricated at 25 W: (a) lateral force F 1 and normal displacement d n, and (b) friction coefficient μ s as a function of time. Coefficient of friction profiles of the polyterpenol thin film (c) as a function of deposition RF power and (d) under varied ramping normal load (film fabricated at 100 W).

D. Cross-hatch testing
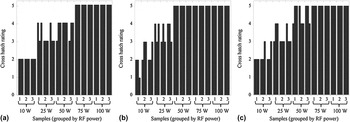
Potential for damage and delamination of polyterpenol coatings was also assessed using a cross-hatch test that provides a standardized (ASTM D3359) qualitative assessment of the adhesion of the coating to the substrate. The adhesion behavior of polyterpenol thin films deposited on glass, PET, and polystyrene is summarized in Fig. 7. Independent of the substrate, the quality of adhesion is improved for samples deposited at higher RF power. Sample fabricated at 10 W was characterized the least favorable adhesion response, with delamination affecting between 15 and 25% of the surface area, whereas samples deposited at 20 and 50 W displayed minimal (less than 5%) damage to the sample surface, and no delamination was detected for 75 and 100 W polyterpenol films. Such improved performance of the latter two film types is associated with enhanced interfacial bonding as a result of increased ion bombardment during plasma-aided deposition. For films deposited at lower powers, surface modifications of the substrate prior to film deposition can be used to improve the quality of adhesion. Plasma-assisted surface cross-linking, surface activation using argon or argon‑nitrogen gas mixture, or addition of adhesion layers are some of the methods to enhance the bonding within polymer thin film‑substrate system. Examination of the optical images for the scratched samples also suggests a difference in the hardness of the polyterpenol coatings deposited under varied RF power conditions. Thin films deposited at an RF power of 10 W appear to be softer, with visible damage to the surface of the coating other than adhesion failure as a result of tape application and removal. These results are consistent with hardness evaluation performed using nanoindentation system.
Adhesion behaviors of polyterpenol thin films fabricated on (a) glass, (b) poly(ethylene terephthalate), and (c) polystyrene at various RF power levels.

IV. CONCLUSIONS
Thin films of polyterpenol were fabricated using RF plasma polymerization under varied RF deposition power levels, and their mechanical and tribological properties were examined using nanoindentation and nanoscratch analyses. Independent of deposition power, polyterpenol coatings were smooth, uniform, and defect free. Smooth surface of polyterpenol films indicates that the polymerization reactions took place predominantly on the surface of the glass substrate rather than in the gas phase. The average (R a) and RMS (R q) surface roughness parameters also decreased, from 0.44 nm and 0.56 nm for 10 W to 0.33 nm and 0.42 nm for 100 W, respectively. Coatings fabricated at higher deposition power were characterized by improved hardness and enhanced wear resistance. The hardness increased from 0.33 GPa for 10 W to 0.51 GPa for 100 W at 500-μN load. The elastic recovery was estimated to be between 0.1 and 0.14. Absence of significant fluctuations in the friction coefficient indicates no considerable damage, cracking, or delamination of the coating occurred. Coatings deposited at higher RF powers showed less mechanical deformation attributed to increased degree of cross-linking associated with higher input power and hence are likely to be more stable and less susceptible to wear. Potential for damage and delamination of polyterpenol coatings was also qualitatively assessed using a standardized cross-hatch test. Independent of the substrate, the quality of adhesion is improved for samples deposited at higher RF power; the results consistent with those obtained using nanoindentation system. This study substantiate that the polyterpenol, which adheres well to many commonly used substrates, is a potential candidate for thin film applications that require smooth and uniform surfaces.
ACKNOWLEDGMENTS
Authors are grateful to the financial support obtained from Rural Industries Research and Development Corporation. We are also thankful to the Advanced Analytical Centre at James Cook University for the access to AFM and nanoindentation systems. K. Bazaka is thankful for the Australian Postgraduate Award and Australian Institute of Nuclear Science and Engineering Postgraduate Award. K. Bazaka acknowledges the funding and support received from the Department of Education, Employment and Workplace Relations and Austraining as a part of Endeavour Research Fellowship.