I. INTRODUCTION
Photocatalysis technology has been considered as one of the best selections to solve the issues of energy source and environmental pollution. Reference Perez, Vittorio, Torres and Sham1,Reference Primo and Garcia2 In literature, titanium dioxide (TiO2) was found to display photocatalytic activities under UV light by Fujishima and Honda in 1972. Reference Fujishima and Honda3 Now it becomes one of the most efficient and widely used materials in this field. Reference Minsoli, Phillohidis, Poulios and Sotiropoulos4 TiO2 has many advantages including low cost, nontoxicity, long-term stability, and high photoactivity. Reference Fujishima and Zhang5–Reference Qiu, Xing and Zhang10 However, there are still some obstacles toward its practical applications in photocatalysis. One of the difficulties to use TiO2 in practice is that the most TiO2 photocatalysts are polyporous, and usually composed of building units with different crystallographic orientations, the majority of which exhibit polycrystalline structure. Reference Li, Chen, Sun, Rao, Han, Hu and Zhou11 The interparticle boundaries related to defects generally may act as recombination centers of the formed electron–hole pairs during photocatalysis, leading to the decrease of the activity of polycrystalline structure photocatalysts. Therefore, single-crystal-like structure TiO2 can effectively reduce the amount of defects of internal crystal, and enhance transfer and separation ability of charge carriers, finally improving photocatalytic activity of photocatalysts. Reference Yu, Zhang, Wu, Zhao and Zhang12,Reference Kuang and Yang13 Another shortcoming of TiO2 is its wide band gap of 3.2 eV, which means that it can only be activated by ultraviolet (UV) radiation (with wave length below 380 nm), and lavish most part of solar energy. On the whole, to further improve the photocatalytic performance of TiO2, developing visible light driven mesoporous single-crystal-like TiO2 by a simple eco-friendly method is a very necessary measure.
There have been two manipulations to break the limitations to improve the photocatalysis efficiency of TiO2. The first one is to control the particle size, porosity, and morphology of the materials. Now, there have been studies about the photocatalytic performance of mesoporous single-crystal-like TiO2 prepared by soft/hard-templating methods. Reference Zheng, Kuang, Yan, Qiu, Qiu and Yang14,Reference Sivaram, Crossland, Leijtens, Noel, Alexander-Webber, Docampo and Snaith15 However, the template agents may lead to difficult complex production process and even secondary pollution. It has been studied that the molten salt system is a special reaction medium in favor of controlling crystals growth and pore structure, because it can directly affect intrinsic anisotropic growth due to its lower flowability and diffusivity that usually result in relative slow crystal nucleation and growth rates. Reference Li, Chen, Sun, Rao, Han, Hu and Zhou11 Therefore, it could be a feasible technique to synthesize mesoporous single-crystal-like TiO2 by molten salt method in which mixed nitrates are as a morphology modifier. Relative investigations have not been reported up to now.
Another method to improve the photocatalysis efficiency of TiO2 is to extend the photo-response from UV to visible light region to improve the utilization of sunlight by doping either transition metals or nonmetal elements. Reference Dvoranova, Brezova, Mazur and Malati16,Reference Hashimoto, Irie and Fujishima17 Doping with metals may lead to lower photocatalytic activity because of either the thermal instability Reference Asahi, Morikawa, Ohwaki, Aoki and Taga18 or an increase of the photogenerated electron–hole recombination rate. Reference Asahi and Morikawa19 Among the nonmetals doping, N doping is one of the most studied ways to alter the electronic structure of TiO2. Since Asahi and coworkers claimed that nitrogen doping would be beneficial for improving the photocatalytic activity of TiO2, Reference Asahi, Morikawa, Ohwaki, Aoki and Taga18 a large number of experimental data were reported on the preparation of nitrogen modified TiO2. Among these researches, urea was widely used to dope nitrogen into TiO2 to improve its visible light absorbance and photocatalytic activity. Reference Yin, Yamaki, Komatsu, Zhang, Wang, Tang, Saito and Sato20,Reference Zalas21 But the high temperature calcination to obtain crystalline solids during the processes would result in deactivation of catalyst due to the loss of nitrogen from the titania lattice. Reference Perez, Vittorio, Torres and Sham1 And the increase of nitrogen content would make the particles densely aggregated, finally reducing the photocatalytic efficiency of TiO2. Reference Hu, Hsu and Lu22 To solve the above problems, the calcination process of N-doped TiO2 with mixed nitrates as a synergistic nitrogen source would enhance the nitrogen content of the sample, and finally improve the photocatalytic performance of TiO2.
Therefore, in this study, the N-S-TiO2 samples were firstly synthesized via hydrothermal method using urea as the doping agent, then through a calcination process using mixed nitrates as morphology modification and synergistic nitrogen source. The use of two kinds of nitrates (NaNO3 and KNO3) in calcination process can increase the content of nitrogen of the obtained solid products due to their different melting points and decomposition temperatures. The photocatalytic activities of the prepared materials were evaluated by the degradation of methylene blue (MB) under visible light radiation. And the N-S-TiO2 samples display superior photocatalytic activity compared with pure TiO2 and nitrogen doped TiO2 without the treatment of mixed nitrates.
II. EXPERIMENTAL
A. Materials and methods
In this study, all the chemicals were purchased from commercial sources and used without further purification. The nitrate-treated N-doped TiO2 was prepared by the following typical process. In a polytetrafluoroethylene reactor, 5 mL acetic acid and 2 mL tetrabutyl titanate were first added drop by drop under intense magnetic stirring; then 5 mL 2 M urea solution was added. After stirring constantly for 30 min, the mixed solution was hydrothermally treated at 150 °C for 24 h. After washing with distilled water and drying, the sample was mixed with NaNO3 and KNO3 according to the proportion of 5:1:1, and then calcined at 350 °C for 4 h. The prepared nitrate-treated N-doped single-crystal-like TiO2 samples were abbreviated to N-S-TiO2. For comparison, N-doped TiO2 samples without mixed nitrates treating were also prepared, which was named as N-TiO2. And the samples without urea and nitrate treating were named as pure TiO2.
B. Characterization
The crystal phase of the samples was identified by powder x-ray diffraction (XRD; Rigaku D/max, Rigaku Corporation, Tokyo, Japan) with a Cu Kα radiation in the 2θ range of 20–80° at a scanning rate of 4°/min. Raman spectra were collected at room temperature using Horiba HR800 recorder (Horiba Scientific, Kyoto, Japan) with a 514.5 nm Ar+ laser excitation in the range of 100–700 cm−1. The morphology and crystalline structure of the samples were examined by scanning electron microscopy (SEM; JEOL S-500, JEOL Ltd., Tokyo, Japan), transmission electron microscopy (TEM; JEOL JEM-2100F, JEOL Ltd.), and high resolution transmission electron microscopy (HRTEM). The specific surface area was evaluated from N2 adsorption isotherms using the BET method with an Autosorb iQ Station-I adsorption instrument (Quantachrome Instruments, Boynton Beach, Florida). The mesopore size distribution and mesopore volume were calculated by desorption isotherms. The elemental composition of the samples was measured by x-ray photoelectron spectroscopy (XPS, photon energy 1253.6 eV) with Mg Kα radiation as the exciting source. All the binding energies were referenced to the C 1s peak at 284.6 eV for calibration. The UV–vis absorption spectra of the samples were recorded on a UV–vis scanning spectrophotometer (Lambda 900, PerkinElmer, Beijing, China) in the range from 200 to 800 nm equipped with an integrated sphere with Barium sulphate (BaSO4) as the reference. The band gap energy can be estimated by extrapolating the linear part of the (Ahm)1/2 versus hν curve to the energy axis.
C. Evaluation of photocatalytic activity
The photocatalytic performance of the samples was evaluated by the decomposition of MB in aqueous media (5 mg/L) under visible light irradiation. The experiment of liquid photocatalytic reaction was carried out in the reaction test tubes which were located axially in a ring whirligig test tube rack (XPA-7, China). N-TiO2, N-S-TiO2, pure TiO2, and P25 were used as photocatalysts. A xenon lamp (Lap Pu, XQ) of 500 W with a 420 nm cut-off filter right above the reactor was used as the light source to provide only visible light in the center. In each test, 0.1 g of photocatalysts was added into 5 mg/L MB aqueous solution (50 mL). Prior to photoreaction, the suspension was ultrasonically treated and stirred in the dark for 30 min to reach the adsorption–desorption equilibrium between photocatalysts and MB. During the degradation process, the mixture in the test tube was stirred by magnetic force under the visible light irradiation. For every 30 min of interval, the supernatant liquid was sampled out and centrifuged to remove the photocatalysts from the suspension. The resultant transparent solutions were examined by UV/vis spectroscopy (722 s) at 662 nm to obtain the absorbance of the MB solution.
D. Reactive oxidation species trapping experiments
To explore the reactive oxidation species generated during the photocatalytic process, for each photocatalytic test on MB by the N-S-TiO2 samples, superoxide radical
 $\left( { \cdot {{\rm{O}}^{{\rm{2}} - }}} \right)$
and hydroxyl radicals
 $\left( { \cdot {\rm{OH}}} \right)$
were investigated by the addition of 1 mM parabenzoquinone (BQ, a quencher of
 $\cdot {{\rm{O}}^{{\rm{2}} - }}$
) and 1 mM tertbutyl alcohol (TBA, a quencher of
 $\cdot {\rm{OH}}$
), respectively.
Reference Huang, Liu, Chen, Zhang, Zhang and Wang23–Reference Yan, Chen, Zou and Wang26
And all the other experiment condition during the tests is similar to the above photocatalytic process.
III. RESULTS AND DISCUSSION
A. Composition analysis
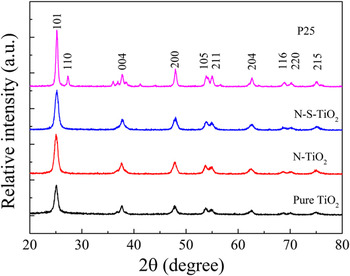
Typical XRD patterns of the samples are shown in Fig. 1. It is seen that P25 sample contains anatase and rutile, which are corresponding to JCPDS no 21–1272 and JCPDS no 21–1276 cards, respectively. And all the diffraction peaks of N-TiO2, N-S-TiO2, and pure TiO2 can be indexed to the unique anatase phase, indicating that the doping with nitrogen into TiO2 would not produce new phases. Furthermore, there are no nitrogen-originated XRD peaks existed in the samples, which is probably due to the low dopants content in the samples below the detection limit of the instrument. In addition, it is because the dopants were dispersed in the lattice of TiO2. Reference Cheng, Yu, Xing and Yang27
Typical XRD patterns of pure TiO2, N-TiO2, N-S-TiO2, and P25 samples.

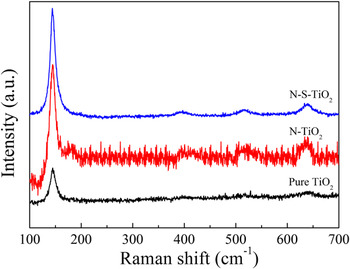
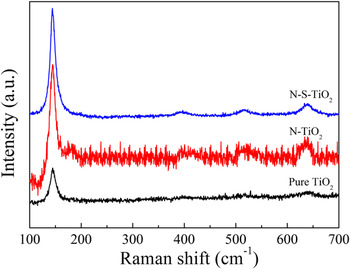
Figure 2 presents a comparison on the Raman spectra of N-doped TiO2 by two methods and pure TiO2. For all the samples, the four peaks could be assigned to Eg(1) (144 cm−1), B1g(1) (396 cm−1), A1g + B1g(2) (516 cm−1) and Eg(2) (639 cm−1) modes of anatase TiO2 phase, respectively. In addition, there is no nitrogen peaks in the spectra, which is in agreement with the XRD results.
Raman spectra of pure TiO2, N-TiO2, and N-S-TiO2 samples.
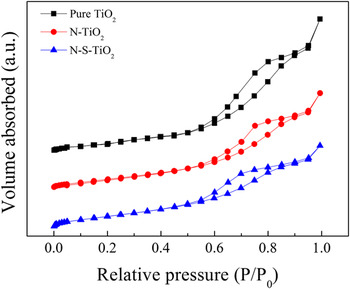
BET N2-sorption measurements can be used to investigate the surface areas, pore volumes, and average pore diameters of the samples. The recorded N2 adsorption–desorption isotherms for pure TiO2, N-TiO2, and N-S-TiO2 samples are shown in Fig. 3. N2 adsorption–desorption isotherms include six types from I to VI, indicating the existence of micropore solids, nonhole, or macropore structure, the interaction of gas–solid on nonhole or macropore materials, mesoporous structure, the interaction of gas–solid on micropore and mesoporous materials, and the multilayer adsorption on surface of nonhole materials, respectively. The isotherms of all the three samples belong to the type IV with H2 hysteresis loop, indicating the existence of mesoporous structure according to the IUPAC classification. Reference Xie, Bian, Yao, Hao and Wei28 The formation of mesoporous is due to the shrinking of crystals at high temperature, which leaves space between the crystals. In addition, the melt ions always left the space between the particles in mixed nitrates system. Reference Sathiyanarayanan, Alimohammadi, Zhou and Fichthorn29
N2 adsorption–desorption isotherms of pure TiO2, N-TiO2, and N-S-TiO2 samples.

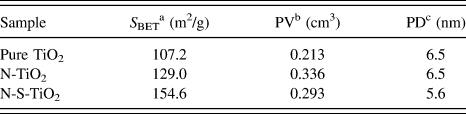
According to the measured results by BET method, the specific surface areas, pore sizes and pore volumes of the three samples were calculated, and the results are listed in Table I. The samples show variation in their surface areas, which are 107.2, 129.0, and 154.6 m2/g, respectively, for pure TiO2, N-TiO2, and N-S-TiO2 samples. The specific surface areas of N-TiO2 and N-S-TiO2 samples are higher than that of the pure TiO2, which may be due to the inhibition of urea to particle size growth of TiO2 during the hydrothermal and calcination processes. The N-S-TiO2 sample presents the highest surface area compared to the other two samples. This might be owing to the decomposition of the added nitrates dispersed in the samples at the calcination process, which would lead to the formation of large amount of pores in the samples. Moreover, the mixed nitrates could directly result in relative slow nucleation and growth rates owing to the low flowability and diffusivity, which might inhibit the particle size growth of TiO2. Therefore, the N-S-TiO2 sample with a larger specific surface area provided abundant reacting active sites and a mass of molecule transport channels that are conducive to the sufficient interaction between the reactive molecules and photocatalyst, thus improving photocatalytic performance.
Structural properties of pure TiO2, N-TiO2 and N-S-TiO2 samples.

a The specific surface area was calculated using BET equation.
b Pore volume.
c Pore diameter.
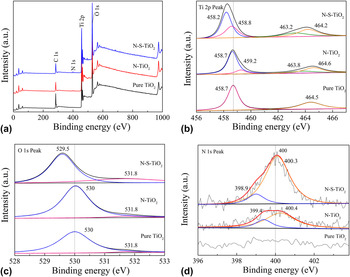
The chemical structure of the prepared TiO2 samples was examined by XPS. Typical XPS survey spectrum of pure TiO2, N-TiO2, and N-S-TiO2 samples is shown in Fig. 4(a). XPS survey spectrum of N-TiO2 and N-S-TiO2 sample reveals the existence of titanium, oxygen, and nitrogen, according to the peak positions of Ti 2p (464.2 eV), O 1s (531.6 eV) and N 1s (400 eV). In contrast, there is no N 1s peak existence in XPS survey spectrum of pure TiO2. Therefore, it can be deduced that the doping of nitrogen into TiO2 was successful.
Typical XPS results of pure TiO2, N-TiO2, and N-S-TiO2 samples: (a) survey spectrum, (b) Ti 2p peaks, (c) O 1s peaks, and (d) N 1s peaks for all the three samples.

The Ti 2p core level for pure TiO2, N-TiO2, and N-S-TiO2 samples is shown in Fig. 4(b). There are two strong peaks at the binding energies of 458.3 and 464.1 eV in Ti 2p region of N-S-TiO2 sample, which can be attributed to the Ti 2p 3/2 and Ti 2p 1/2 spin-orbital split photoelectrons in the Ti4+ chemical state, respectively. Reference Sun, Zhao, Zhou and Liu30 The splitting value of 5.8 eV between these bands is the characteristic of the Ti4+ species in anatase TiO2. Reference Wu and Tang31 The Ti 2p 3/2 core level can be deconvoluted into two peaks at 458.2 and 458.8 eV, which can be assigned to the Ti–N and Ti–O linkages of Ti 2p 3/2 orbit, respectively. In addition, the Ti 2p 1/2 core level can also be divided into two peaks at 463.2 and 464.2 eV, representing the presence of the Ti–N and Ti–O bonds in Ti 2p 1/2 orbit. The two peaks of pure TiO2 at 458.7 and 464.5 eV are owing to the binding energies of Ti4+ 2p 3/2 and Ti4+ 2p 1/2, respectively. And there is no divided peak in the Ti 2p spectrum of pure TiO2 sample. The Ti 2p 3/2 peak of the pure TiO2 powder located at higher binding energy than that for the N-TiO2 and N-S-TiO2 samples. The corresponding peak of N-S-TiO2 sample is obtained at lowest binding energy of 458.3 eV by comparison. This result indicates that the electronic interaction of Ti with anions in pure TiO2, N-TiO2, and N-S-TiO2 samples is different. The partial Ti4+ might have electronic interaction with nitrogen when nitrogen was doped into TiO2 lattice. The lower electronegativity of nitrogen compared to oxygen would result in a decrease of electron density around N anion, and thus the electron density on Ti increased. Reference Chen and Burda32 This is why the binding energy of Ti 2p in N-S-TiO2 sample decreased, which displays nitrogen is incorporated into the TiO2 lattice.
Figure 4(c) shows the O 1s peaks of pure TiO2, N-TiO2, and N-S-TiO2 samples, which are all around the binding energy of 530 eV, indicating that O element exists mainly in the form of O2−. The O 1s spectrum consists of two peaks, which are around 530 and 532 eV, respectively. The strong peak around 530 eV can be attributed to the O–Ti–O lingkage of oxygen coordination, while the weak one around 532 eV may arise from the chemisorbed species from the ambient. Reference Jagadale, Takale, Sonawane, Joshi and Patil33 The O 1s core level of N-S-TiO2 sample is broader than that of pure TiO2 and N-TiO2 samples and has a shift to 529.5 eV, which might be due to the presence of oxygen and nitrogen in the same lattice units of TiO2. Reference Jagadale, Takale, Sonawane, Joshi and Patil33
A comparison on the N 1s peaks of pure TiO2, N-TiO2, and N-S-TiO2 is shown in Fig. 4(d). There is no peak in the N 1s spectrum of pure TiO2 sample, while the other two samples both present a peak at 400 eV, which can be designated to the incorporation of nitrogen into TiO2. The N 1s peak of N-S-TiO2 sample is significantly stronger than that of N-TiO2 sample. The nitrogen content of 2.392 at.% was detected in the N-S-TiO2 sample, while that in the N-TiO2 sample was only 1.160 at.%, which implies that the nitrogen content of the samples can be improved by the synergistic effect of urea and nitrates because of the addition of NaNO3 and KNO3 mixed nitrates compared with using urea as a single nitrogen source. And the use of two kinds of nitrates in this work also can increase the content of nitrogen of solid, because their different melting point and decomposition temperature can lead to the incorporation of nitrogen at different temperatures during the calcination process.
Specifically, the nitrogen 1s core levels of N-TiO2 and N-S-TiO2 samples can be deconvoluted into two peaks, in which one peak appears at 399.4 eV for N-TiO2 and at 398.9 eV for N-S-TiO2, and another peak appears at 400.4 and 400.3 eV for N-TiO2 and N-S-TiO2 samples, respectively. In literature, it was reported that nitrogen from simple chemisorbed nitrogen or TiN should appear at ≤397.5 eV, and nitrogen in NO species must appear above 400 eV. Reference Sugai, Watanabe, Kioka, Miki and Kawasaki34–Reference Rodriguez, Jirsak, Dvorak, Sambasivan and Fischer36 Here the peak at 398.9 and 399.4 eV (for N-TiO2 and N-S-TiO2 samples, respectively) can be attributed to the anionic N incorporated in TiO2 in O–Ti–N linkages. The existence of a peak at or near 400.3 eV can be ascribed to the nitrogen in NO or oxidized nitrogen in the form of Ti–O–N or Ti–N–O linkages. Reference Sathish, Viswanathan, Viswanath and Gopinath37 Moreover, the peak at or near 400.3 eV of N-S-TiO2 sample is stronger than that of N-TiO2 sample. From this fact, it can be deduced that the mixed nitrates method may enable TiO2 surface containing more NO due to the synergistic effect of urea and nitrates, and the strong oxidation ability of NO is beneficial for the photocatalytic activity of N-S-doped TiO2.
B. Morphological structure
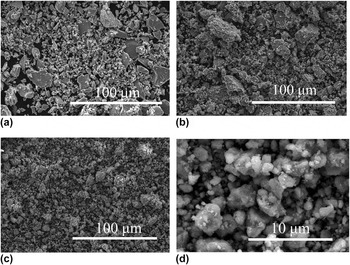
Typical SEM images of pure TiO2, N-TiO2, N-S-TiO2 samples are shown in Fig. 5. Although all the three samples have a large number of inhomogeneous blocks, the N-S-TiO2 sample has a relatively small mean particle size. There are many irregular small grains adhering to the surface of the inhomogeneous blocks in all the three samples. Moreover, the particle surface of pure TiO2 is rather smoother [see Fig. 5(a)], while there are more small grains in both N-TiO2 [see Fig. 5(b)] and N-S-TiO2 [see Fig. 5(c)] samples. And the N-S-TiO2 sample has more uniform particle size and less large blocks. A high magnification SEM image of N-S-TiO2 sample is shown in Fig. 5(d), where many nanoparticles with a diameter ranging from 10 nm to 5 μm are visible.
Typical SEM images of (a) pure TiO2, (b) N-TiO2, and (c) N-S-TiO2 samples, and (d) high magnification SEM image of N-S-TiO2 sample.

TEM and HRTEM were used to evaluate the particle size and crystalline structure of the three samples. Typical TEM and HRTEM images of pure TiO2, N-TiO2, and N-S-TiO2 samples are shown in Fig. 6. It is seen from this figure that all the three samples are composed of irregular nanoparticles. The nanoparticles are small grains adhering to the surface of the inhomogeneous blocks observed in SEM. The TEM image in combination with the inset shown in Fig. 6(a) indicates that the sample of pure TiO2 has a particle size in the range of 13–23 nm. Figure 6(b) reveals the size distribution of N-TiO2 sample ranging from 9 to 16 nm. From Fig. 6(c), it was calculated that the mean particle size of N-S-TiO2 sample was about 7 nm. These results imply that the present method of nitrogen doping can reduce the average particle size of the samples, and the mixed nitrates method can even make the particle size become smaller. It corroborated the results of BET. In addition, the clear mesoporous structure composed of titania nanoparticles is easily found. The formation of anatase can produce grain boundaries. The grain boundary might inhibit the growth of TiO2 grains of anatase phase as well as the degradation of mesostructure during calcinations. Reference Yu, Zhang, Zheng and Zhao38
TEM (a, b, c) and HRTEM (d, e, f) images of pure TiO2, N-TiO2, and N-S-TiO2 samples, respectively. The insets in (a–c) show the particle size distribution of the three samples.

Figures 6(d)–6(f) displays the HRTEM micrographs of the nanoparticles in pure TiO2, N-TiO2, and N-S-TiO2 samples, respectively. From the micrographs, the lattice spacing of each sample can be measured. The spacing of two neighboring parallel fringes is about 0.35 nm for all the three samples, which matches well with the d-spacing between adjacent (101) crystallographic planes of TiO2 anatase phase, Reference Selvam, Balachandran, Velmurugan and Swaminathan39 is consistent with the data of XRD. Additionally, the shape, edge, and lattice fringes of TiO2 nanoparticles could be clearly observed, and the direction of lattice fringes is unidirectional, which indicates the N-S-TiO2 photocatalyst with single-crystal-like structure and high crystallinity can be obtained by this method. It was reported that the photogenerated charge carriers transport pathways were affected sensitively by crystal boundary of photocatalysts. Reference Li, Chen, Sun, Rao, Han, Hu and Zhou11 And it can be presumed that the N-S-TiO2 nanoparticles are single-crystal-like structure that might be directly related to the effect of morphology modifier of nitrates in the mixed nitrates system. The mixed nitrates could directly result in suppression effect of intrinsic anisotropic crystal growth owing to the relative slow nucleation and growth rates. Compared to polycrystalline TiO2, the single-crystal-like TiO2 had lesser crystal boundary, which facilitated long-range electron transport and also reduced the number of defects acting usually as recombination centers of photogenerated charge carriers, thus effectively increasing the lifetime of electrons and holes.
C. Photocatalytic properties
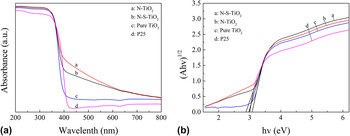
The UV–Vis absorption spectra of pure TiO2, N-TiO2, N-S-TiO2, and P25 samples are presented in Fig. 7(a). The pure TiO2 and P25 samples display an intense transition in the UV region mediated by the intrinsic band gap absorption of TiO2, resulting from the electron transitions from the valence band (VB) to conduction band (CB) (O 2p → Ti 3d). Reference Xiang, Yu and Jaroniec40,Reference Ong, Tan, Chai, Yong and Mohamed41 In addition, the absorption in ultraviolet spectrum of N-TiO2 and N-S-TiO2 samples is slightly stronger than that of the pure TiO2 sample, which may be due to that the nitrogen doping can reduce the particle size and increase the specific surface area of the samples, thus improving their absorption capability on light and reducing the reflectance. After N was doped into the samples, a clear red shift was observed and the absorption increased significantly in the visible range. The introduction of nitrogen into the crystalline lattice of TiO2 in the forms N-Ti-O or O-N-Ti linkages would modify the electronic band structure of TiO2 leading to the formation of N-dopant energy levels above the O 2p valence band (VB), thus reducing the energy gap and the energy required for electronic transitions, resulting in the absorption of visible light. Reference Selvam, Balachandran, Velmurugan and Swaminathan39 In other word, the incorporation of nitrogen into the TiO2 lattice caused the absorption of visible light. In Fig. 7(a), a remarkable absorption was observed in the visible region between 400 and 600 nm for N-TiO2 and N-S-TiO2 samples, indicating that N atoms were successfully incorporated into the TiO2 lattice, which is consistent with the results presented in Sec. III. A and III. B.
(a) UV–Vis absorption spectra of pure TiO2, N-TiO2, N-S-TiO2, and P25 samples, and (b) their corresponding Kubelka–Munk curves.

The band gap energy of the samples can be evaluated with the Kubelka–Munk function. The respective Kubelka–Munk curves of pure TiO2, N-TiO2, N-S-TiO2, and P25 samples are obtained via the transformation based on the (Ahν)1/2 versus energy of absorbed light is shown in Fig. 7(b). The calculated band gap values of pure TiO2, N-TiO2, N-S-TiO2, and P25 samples listed in Table II. It is seen that the band gap of N-TiO2 and N-S-TiO2 samples are narrower than that of pure TiO2 and P25, indicating that there are some N-dopant energy levels due to the nitrogen dopants being introduced in the band gap of TiO2, which is in accordance with the red shift shown in Fig. 7(a) and is beneficial to improving the photocatalytic efficiency of the obtained catalysts. Furthermore, the band gap of N-S-TiO2 sample is slightly wider than that of the N-TiO2. It is speculated that the mixed nitrates method did not make hybrid nitrogen increase, but led to the surface of TiO2 containing more NO, as confirmed by XPS analysis. But the strong oxidizing ability of NO would be beneficial for improving the photocatalytic activity of catalysts. Meanwhile, the wider band gap of N-S-TiO2 sample could enhance reduction ability of electrons and oxidizing ability of holes, finally resulting in improvement of photocatalytic activity.
Band gap energy (E g) of pure TiO2, N-TiO2, N-S-TiO2 and P25 samples.

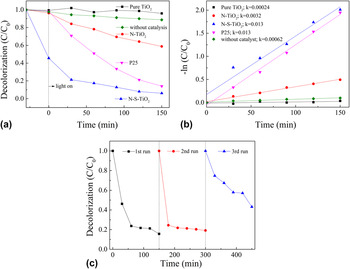
The photocatalytic activities of the pure TiO2, N-TiO2, and N-S-TiO2 samples are evaluated by the degradation of MB versus irradiation time under visible light and the results are shown in Fig. 8(a). A blank study without catalyst was used as a background check. And P25 catalyst was also studied under the same conditions as a comparison. It can be seen that there is a slight self-degradation of MB solution without catalysts under visible light after 150 min, and the degradation efficiency of MB is only 11%. In contrast, the great degradation is clearly observed when pure TiO2, N-TiO2, and N-S-TiO2 catalysts are present. The N-S-TiO2 sample has much better photocatalytic activity than that of N-TiO2 sample. The N-S-TiO2 sample takes 60 min to degrade 83% MB, presenting the highest efficiency in all the applied catalysts, while the N-TiO2 sample degrade only 22% MB for the same time, which is even lower than that by P25 (degrading 49% of MB). In addition, pure TiO2 sample shows very weak photocatalytic activity. The linear relationship between the reaction time versus −ln(C/C 0) is shown in Fig. 8(b), which indicates that the degradation of MB follows the first-order kinetics. The values of the rate constants can be calculated from the slope of the lines between −ln(C/C 0) and the reaction time, which are 0.00024, 0.0032, 0.013, and 0.013 min−1 for the reactions with pure TiO2, N-TiO2, N-S-TiO2 and P25 samples. The degradation rate of N-S-TiO2 sample is the same as that of P25 sample, which indicated that the N-S-TiO2 sample have the best photocatalytic activity. In addition, the photostability of N-S-TiO2 sample was also studied under the same conditions. Reference Niu, Cheng and Cao42,Reference Cheng, Chen, Lin, Liu and Kong43 As shown in Fig. 8(c), N-S-TiO2 sample still kept a nice activity and showed a good stability on the degradation of MB under visible light after 3 successive runs.
(a) Degradation curves of MB by the catalysis of pure TiO2, N-TiO2, N-S-TiO2, and P25 samples under visible light irradiation, (b) their corresponding plots of −ln(C/C 0), and (c) the degradation of MB on N-S-TiO2 sample under visible light for 3 runs.

The investigation of the reactive oxidation species in photocatalytic process is very important to the explication of the photocatalytic mechanism. To trap the reactive oxidation species in experiments, under the same experiment condition for each photocatalytic test on MB by the N-S-TiO2 samples, 1 mM TBA and BQ, as scavengers of hydroxyl radicals
 $\left( { \cdot {\rm{OH}}} \right)$
and superoxide radicals
 $\left( { \cdot {{\rm{O}}^{{\rm{2}} - }}} \right)$
, were added into the reaction system, respectively.
Reference Huang, Liu, Chen, Zhang, Zhang and Wang23–Reference Yan, Chen, Zou and Wang26
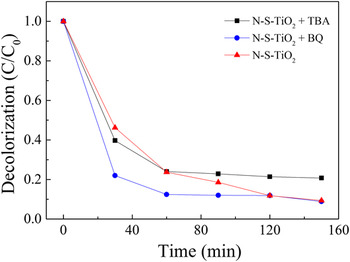
Fig. 9 shows the degradation curves of MB by the catalysis of N-S-TiO2 sample in the presence of TBA or BQ under visible light irradiation. It can be seen that the photocatalytic activity of the N-S-TiO2 sample was decreased in the presence of TBA as
 $\cdot {\rm{OH}}$
scavenger, and the inhibition efficiencies for degradation of MB is about 12.5%. However, the photodegradation of MB over the N-S-TiO2 sample was almost not affected by the addition of 1 mM BQ as quencher of
 $\cdot {{\rm{O}}^{{\rm{2}} - }}$
. Thus, it could be speculated that
 $\cdot {\rm{OH}}$
serves as the main reactive oxidation species for the photodegradation of MB over N-S-TiO2 sample under sunlight irradiation.
Photodegradation curves of MB by the catalysis of N-S-TiO2 sample in the presence of TBA or BQ scavengers under visible light irradiation.

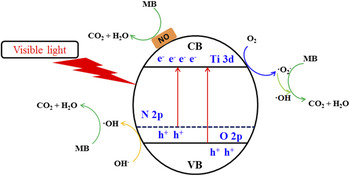
On the basis of the above discussion and results, a possible photocatalysis mechanism for the visible light photocatalytic reaction over N-S-TiO2 photocatalyst is illustrated in Fig. 10. The gradient in the energy band represents mixing of the N 2p and O 2p atomic orbitals. Reference Naik, Moon, Kim and Park44,Reference Wen, Li, Liu, Fang, Xie and Xu45 Nitrogen doping can create intra-band-gap states (N 2p) which is located above the valence band edges (O 2p), which increases the driving force of electron injected from N 2p energy level and accelerates the reductive process of interfacial electron transfer. Reference Zhang, Wu, Xing, Leghari and Sajjad46,Reference Li, Liu, Luo, Li, Huang, Li, Fang, Xu and Zhu47 Therefore, the N-S-TiO2 sample resulted in the best response to visible-light and the red-shift due to the effect of N dopant. In addition, the N-S-TiO2 sample could be activated by the visible light, thus more electrons and holes are generated and participated in the photocatalytic redox reactions. And there are a lot of NO on the surface of the TiO2, the strong oxidation ability of NO is beneficial for the photocatalytic activity of N-S-TiO2. The major reactions in this photocatalytic mechanism are summarized by the following steps:
 $${\rm{N \hbox- S \hbox- Ti}}{{\rm{O}}_2} + {\rm{visible\ light}} \to {\rm{N \hbox- S \hbox- Ti}}{{\rm{O}}_2}\left( {{{\rm{e}}^ - } + {{\rm{h}}^ + }} \right)\quad ,$$
 $${{\rm{O}}_2} + {{\rm{e}}^ - } \to \mathop { \cdot {{\rm{O}}_2}}\nolimits^ - \quad ,$$
 $$\mathop { \cdot {{\rm{O}}_2}}\nolimits^ - +\; {{\rm{H}}^ + } + {{\rm{e}}^ - } \to \cdot {\rm{OH}} + {\rm{O}}{{\rm{H}}^ - }\quad ,$$
 $${\rm{O}}{{\rm{H}}^ - } +\; {{\rm{h}}^ + } \to \cdot {\rm{OH}}\quad ,$$
 $$\cdot {\rm{OH}} + {\rm{MB}} \to {\rm{degradation}}\quad ,$$
and
 $${\rm{NO}} + {\rm{MB}} \to {\rm{degradation}}\quad ,$$
During the photocatalytic reaction, MB ions adsorbed on the active surface sites of N-S-TiO2 photocatalyst were immediately oxidized by ‧OH radicals and NO.
Mechanism for photocatalytic degradation of MB over N-S-TiO2 photocatalyst under visible light irradiation.

IV. CONCLUSIONS
In this work, the mesoporous N-doped single-crystal-like TiO2 sample was firstly prepared via hydrothermal method using urea as the doping agent, then through the calcination process using mixed nitrates as morphology modification and synergistic nitrogen source. The sample has high visible light photocatalysis efficiency for MB, much higher than pure TiO2 and N-doped TiO2 without mixed nitrates system, and even higher than P25 samples. Urea treatment (nitrogen doping) can incorporate anionic N into TiO2 in the form of O-Ti-N and Ti-N-O linkages, narrowing the band gaps of the TiO2 and improving the utilization of visible light. The nitrates treatment can refine the crystal particles of TiO2, improve the surface adsorption capability of the nitrates-treated N-doped TiO2 sample due to its increased specific surface area and make the TiO2 sample to be single crystal. The synergistic effect of urea and nitrates can improve the nitrogen content of TiO2 sample. And there are more NO on the surface of the TiO2 after the treatment by nitrates, which can contribute to improving the photocatalytic activity.
ACKNOWLEDGMENT
This work was supported by “the Fundamental Research Funds for the Central Universities of China”, and “the College students’ innovative entrepreneurial training program”.