


Introduction
Investigating the phenomenon of policy diffusion is important to our understanding of the policymaking process and allows us to identify the effectiveness and potential for policy feedbacks from specific policy initiatives. Identifying the underlying mechanisms that drive policy spread is critical to developing insights into the policy landscape as well as the processes that shape it. The diffusion literature details the theoretical basis and empirical justification for a variety of determinants causing policies to spread (Boushey Reference Boushey2010; Shipan and Volden Reference Shipan and Volden2008, Reference Shipan and Volden2012). However, despite continuing research on a wide variety of micro-level processes driving policy diffusion (e.g. Boehmke et al. Reference Boehmke, Rury, Desmarais and Harden2017; Bricker and LaComb 2020; Garrett and Jansa Reference Garrett and Jansa2015), more work is needed to specify the mechanisms through which it occurs (Jordan and Huitema Reference Jordan and Huitema2014).
While a growing number of studies propose innovative ways to capture how policy ideas spread (e.g., Gilardi and Fuglister Reference Gilardi and Füglister2008; LaComb et al. Reference LaCombe, Tolbert and Mossberger2021; Pacheco Reference Pacheco2012), many policy diffusion studies rely on proxies, such as regional proximity, to predict policy spread (Berry Reference Berry1994; Berry and Berry Reference Berry and Berry1990; Mooney Reference Mooney2001). Recent studies have noted the limitations of diffusion studies that rely on proximal states, identifying that they fail to adequately explain how diffusion occurs and potentially underestimate the extent of micro-level communication across states (Mallinson Reference Mallinson2021a; Nicholson-Crotty and Carley Reference Nicholson-Crotty and Carley2018; Zhou et al. Reference Zhou, Matisoff, Kingsley and Brown2019). Noting the limitations of models that rely on geographic proximity, Desmarais et al. (Reference Desmarais, Harden and Boehmke2015) and Matisoff and Edwards (Reference Matisoff and Edwards2014), following Walker (Reference Walker1969), argue that there is an inferred network of states that adopt policies in a similar order. However, while these inferred networks have predictive power to explain the order of policy adoption by states, they do not accurately capture the causal processes that leads knowledge to diffuse across the states or explain the adoption of policies. This paper seeks to uncover the micro-level process by which policy ideas are spread across the networks described by Walker (Reference Walker1969), Boehmke et al. (Reference Boehmke, Rury, Desmarais and Harden2017), and others by testing how well social contagion, measured through the movement of entrepreneurial policy stakeholders, explains policy adoption and diffusion.
The diffusion of policies creating birdwatching trail programs provides an excellent opportunity to study the spread of policy innovations. Since the first policy of its kind was established in Texas, birdwatching trail programs have spread across the USA. These regional ecotourism programs create opportunities for local economic development, conservation, and scientific coproduction and were present in 34 states as of 2019, offering a rich policy context for study. Investigating the adoption and diffusion patterns of these policies can provide a clear look at the underlying mechanisms guiding the process. Many studies investigating contentious policy areas find that internal determinants (the local characteristics that influence policymaking within a jurisdiction, such as local politics) dominate the diffusion process, making external determinants (intergovernmental influences that come from outside the jurisdiction) difficult to observe with precision (Bromley-Trujillo et al. Reference Bromley-Trujillo, Butler, Poe and Davis2016; Huang et al. Reference Huang, Alavalapati, Carter and Langholtz2007; Shipan and Volden Reference Shipan and Volden2012).
While the internal and external determinants of policy diffusion have been examined at great length since they were introduced to the literature by Berry and Berry (Reference Berry and Berry1990), researchers continue to work at disentangling their effects when studying how policies spread (Baldwin et al. Reference Baldwin, Carley and Nicholson-Crotty2019; Kammerer and Namhata Reference Kammerer and Namhata2018; Matisoff Reference Matisoff2008; Stadelmann and Castro Reference Stadelmann and Castro2014). The low-conflict nature of birdwatching trail programs provides a unique opportunity to examine the process by which knowledge spreads while avoiding these pitfalls. Policies that establish birdwatching trails are often low salience, low complexity, and uncontroversial, making them largely exempt from the influential implementation factors, such as resource availability and political obstruction, that can obscure understanding of how larger policy platforms diffuse. Using fixed-effects methods that more adequately control for unobserved subject-specific effects across states, this analysis offers a look at how stakeholder networks influence policy change through social contagion, demonstrating the role of stakeholder networks in how diffusion occurs.
Theoretical context
Governments often learn from their peers, imitating each other’s policies (Brinks and Coppedge Reference Brinks and Coppedge2006; Krause et al. Reference Krause, Yi and Feiock2016; Simmons and Elkins Reference Simmons and Elkins2004). Policy diffusion, the process by which policy ideas spread from one group to another, takes on an important role in the policy formation process as policymakers draw on examples from other governments when setting their agendas, gathering information on the alternatives available to them, and adopting policies to address local problems. The relevance of diffusion varies during different stages of the policy cycle as it interacts with governments’ political and structural constraints (Karch Reference Karch2007), but it is often most relevant during the information-gathering phase when decisionmakers work at identifying and comparing the merits of rival policy solutions. In the USA, policy diffusion is often studied at the state level (Boehmke and Witmer Reference Boehmke and Witmer2004; Lyon and Yin Reference Lyon and Yin2010; Woods Reference Woods2006), with states acting as policy laboratories where novel policies are implemented experimentally (Elazar Reference Elazar1972). These experiments provide useful evidence for policymakers in other governments who are considering how to deal with similar problems, catalyzing the information-gathering and decision-making stages of policy formation. If a policy innovation is successful in one state, others may adopt it as well, resulting in the diffusion of uniform policy solutions across numerous governments (Volden Reference Volden2006).
While the diffusion of policies has been shown to occur across ideologically similar states, geographically proximate states, or inferred networks (Mistur et al. Reference Mistur, Givens and Matisoff2023), the precise mechanisms by which this diffusion occurs deserve further investigation. In a recent meta-analysis, Maggetti and Gilardi (Reference Maggetti and Gilardi2016) discuss six indicators (geographical proximity, trade flows, joint membership, structural similarity, and the number of previous adopters) that are used to explain three mechanisms of policy diffusion (learning, emulation, and competition). However, the underlying micro-level mechanisms driving these processes, such as the movement of individuals between states as investigated in this article, are less well understood.
Regional proximity is commonly used to predict interaction between states, creation of transboundary stakeholder networks, and knowledge transfer (Berry Reference Berry1994; Mintrom Reference Mintrom1997; Mooney Reference Mooney2001). Since farther distances usually entail higher transportation and communication costs, regional proximity is thought to increase the level of communication between governance units. According to this logic, the closer two states are to one another geographically, the more likely they are to share knowledge and spread policies to one another. Many studies rely on this logic, using neighboring states as a proxy for interaction, (Allen Reference Allen2005; Boehmke and Witmer Reference Boehmke and Witmer2004; Chamberlain and Haider-Markel Reference Chamberlain and Haider-Markel2005; Daley Reference Daley2007; Dincer et al. Reference Dincer, Payne and Simkins2014). Other studies rely on the similar concept of fixed-region diffusion by defining connected regions within the USA (Andrews Reference Andrews2000). While numerous studies have demonstrated that geographical proximity is an important factor and helps influence likelihood of policy diffusion (Berry and Berry Reference Berry and Berry1990; Chandler Reference Chandler2009; Mallinson Reference Mallinson2021b), Maggetti and Gilardi (Reference Maggetti and Gilardi2016) argue “geographic proximity is a catch-all indicator that cannot be linked unambiguously with a specific mechanism; joint membership ignores the nature of actual interactions, but is often used as an indicator for shared norms or information flows among members…” (Maggetti and Gilardi Reference Maggetti and Gilardi2016, 96).
There are serious limitations to geographic proximity as a proxy for micro-level determinants of policy diffusion. While geographic proximity often has predictive power and hybrid models that integrate social mechanisms with spatial properties can be useful to understand policy spread (Mitchell Reference Mitchell2018), researchers have called for more research directly capturing the micro-level mechanisms driving diffusion outcomes (Jordan and Huitema Reference Jordan and Huitema2014). Geographic proximity is correlated with a range of other factors that may be excluded from a diffusion model, including travel and communication costs, geographical and cultural similarities, and competitive processes that lead geographic diffusion models to incorrectly conclude that geography, rather than some other excluded variable of interest, is responsible for diffusion patterns (Matisoff Reference Matisoff2008). A growing number of studies cast doubt on the validity of geographical proximity models after controlling for internal determinants (Lyon and Yin Reference Lyon and Yin2010; Stadelmann and Castro Reference Stadelmann and Castro2014; Yin and Powers Reference Yin and Powers2010; Zhou et al. Reference Zhou, Matisoff, Kingsley and Brown2019). The focus on regional proximity largely excludes other potential mechanisms that more directly capture the information exchange taking place across states and more accurately capture the causal mechanisms driving policy diffusion (Nicholson-Crotty and Carley Reference Nicholson-Crotty and Carley2018). In this paper, we discuss the role of social contagion, the spread of ideas through social interaction, tracked by movement of individuals as a mechanism to capture the drivers of policy diffusion.
Intergovernmental learning is an important determinant of policy diffusion (Shipan and Volden Reference Shipan and Volden2012). The micro-level dynamics through which this learning takes place are complex and have promoted close examination at the individual and network levels. Recent research points out the relevance of individuals’ use of technology in determining diffusion trends (LaCombe et al. Reference LaCombe, Tolbert and Mossberger2021), as well as the role interest group organizations play in facilitating policy spread (Garrett and Jansa Reference Garrett and Jansa2015). Expansive networks of policymakers have been inferred from persistent diffusion patterns (Boehmke et al. Reference Boehmke, Rury, Desmarais and Harden2017; Desmarais et al. Reference Desmarais, Harden and Boehmke2015), indicating the important role of networks of decisionmakers. However, other stakeholder groups are active in many, if not all, policy arenas and more work is needed to develop an improved understanding of how stakeholders impact diffusion. Social contagion, or the spreading of ideas through networks of policymakers, stakeholders, or publics through social interaction, is a critical way that policymakers learn. Pacheco (Reference Pacheco2012) empirically demonstrates that state residents change their attitudes toward policy solutions in response to seeing them implemented elsewhere, indicating that policy ideas are contagious. These opinions may be moderated by government similarity (Bricker and LaCombe 2020). Nevertheless, state residents form political opinions based on other states’ policy experiments influencing their own policymakers to adopt that policy solution (Pacheco Reference Pacheco2012).
This type of bottom-up policymaking, where local constituents or groups advocate for policy changes, is important to understand. Much of the policy diffusion literature examines top-down policymaking, driven by legislators at high levels of government (e.g. Cao Reference Cao2010; Makse Reference Makse2021; Zhou et al. Reference Zhou, Matisoff, Kingsley and Brown2019), and ignores public opinion and members of the public (Pacheco Reference Pacheco2012). But grassroots movements are a central feature of the American policy process (Chetkovich and Kunreuther Reference Chetkovich and Kunreuther2006). Input from interest groups helps drive policy learning and shapes policy diffusion (Garrett and Jansa Reference Garrett and Jansa2015). Furthermore, special interest groups have priorities that are low salience to the broader public. This inattention can enable special interest groups to influence policy diffusion. While the specific content matter different special interest groups pursue varies widely, the process of social contagion that disseminates ideas is likely to follow a generalizable pattern.
The policy subsystems that form around issues can involve active stakeholders from a diverse set of groups, including interest groups (Sabatier and Jenkins-Smith Reference Sabatier and Jenkins-Smith1999). Since policymakers are boundedly rational and have limited time and attention to devote to an issue (Simon Reference Simon1976), they often search for information from specialists within their policy subsystem and coordinate with them to develop policy (Sabatier and Jenkins-Smith Reference Sabatier and Jenkins-Smith1999; Weible and Sabatier Reference Weible and Sabatier2005). This opens the door for policy entrepreneurs to take on a major role in policymaking, resulting in significant attention in the policy diffusion literature (Chatfield and Reddick Reference Chatfield and Reddick2018; Mintrom Reference Mintrom1997; Garrett Reference Garrett2002; ; Vallett Reference Vallett2021). These studies focus on the role of communication (Garrett Reference Garrett2002) and entrepreneurial advocacy in driving the diffusion of policies across state lines (Mintrom Reference Mintrom1997). Entrepreneurs from a stakeholder network or interest group are uniquely positioned to provide policymakers with the specialized knowledge and expertise necessary to develop policy.
We contribute to policy diffusion theory by observing the role policy entrepreneurs have in policy diffusion. In our model, policy entrepreneurs travel to other states and observe successful policy experiments, then advocate for those policies to be adopted in their home state. This can occur either directly, with the entrepreneur affecting policy by engaging in creation of the program themselves, or indirectly through advocacy and information-sharing with those around them. In our case, most entrepreneurs fall into the second category. Those with the time and energy to engage directly can have even larger impacts on the policies that are implemented. This type of interaction between policymakers and stakeholder networks is thought to provide opportunities for policy ideas to spread (Cao Reference Cao2010; Kammerer and Namhata Reference Kammerer and Namhata2018; Nicholson-Crotty and Carley Reference Nicholson-Crotty and Carley2018; Reagans and McEvily Reference Reagans and McEvily2003). Special interest organizations, such as certification sponsors, often influence state laws related to their area of focus (Lee Reference Lee2009), demonstrating the importance of specialized groups in creating policy change. However, robust data on individual stakeholder movements is often difficult to obtain, limiting research examining individual-level mechanisms. Individuals in the stakeholder network are often difficult to identify. Even if they are identifiable, their movements and interactions can be even harder to track over time.
A wide range of disciplines offer perspectives on diffusion and highlight the roles of stakeholders and networks driving policy diffusion (Naumovska et al. Reference Naumovska, Gaba and Greve2021). Social networks and communication are important factors in how knowledge spreads (Burns and Wholey Reference Burns and Wholey1993; Palmer et al. Reference Palmer, Jennings and Zhou1993). Innovation diffusion research frequently examines the micro-level mechanisms related to knowledge transfer by analyzing learning (Geroski Reference Geroski2000; Kapur Reference Kapur1995) and network-based information sharing that creates information spillovers (Reagans and McEvily Reference Reagans and McEvily2003; Matisoff and Noonan Reference Matisoff and Noonan2022). Special interest groups such as stakeholder networks drive innovation diffusion, as imitation occurs among local members of a specialist community (Borracci and Giorgi Reference Borracci and Giorgi2018). Innovations often originate at a central source and spread to other adopters over time as technologies diffuse (Geroski Reference Geroski2000) Technological innovations can spread between “information neighbors” Conley and Udry (Reference Conley and Udry2010) demonstrating the importance of social contagion and interaction.
Social connections can be highly conducive to the spread of innovations as knowledge flows along network paths, encouraging diffusion through learning (Haunschild Reference Haunschild1993; Huber Reference Huber1991; Kapur Reference Kapur1995; Rogers Reference Rogers1983). The size, strength, and diversity of social networks impact their propensity to facilitate knowledge sharing. Diffusion occurs more readily along short network paths (Jackson Reference Jackson2010) and in networks with strong social cohesion and members from diverse knowledge groups (Reagans and McEvily Reference Reagans and McEvily2003). In policy subsystems, networks of policy stakeholders can be particularly important, and diffusion can be further spurred by the presence of entrepreneurs (Mintrom Reference Mintrom1997). Transfer of new knowledge into a special interest group or stakeholder network can activate new policy entrepreneurs from that community, generating more opportunities for policies to be implemented. This is reinforced by work on social activism that comes from the sociology literature. In their work on sit-ins during the civil rights movement, Andrews and Biggs (Reference Andrews and Biggs2006) demonstrate that grassroots movement organizations significantly influenced the spread of activism. Importantly, having a small group of dedicated activists was more important than mass membership in the organization, showing that small networks of actors focused on a special interest can have a significant role in disseminating ideas and facilitating inter-state learning.
These studies provide useful lessons for understanding how policy learning occurs through the sharing of ideas at the micro-level and demonstrate the utility of building diffusion theory across disciplinary lines. We extend this work in examining social contagion through individual stakeholder movement, allowing us to avoid artificially bounding interaction and diffusion with geographical constraints. In our conception of social contagion driving policy diffusion, policy entrepreneurs act as representatives of a network of interest groups. When they travel to states with different policies and programs, they observe these policies and bring knowledge to their home state. These policy entrepreneurs then advocate and work with local government officials to implement new policies in their home states.Footnote 1
Ecotourism as economic development policy
Birdwatching trails are a form of economic development policy, intended to stimulate local economic growth through ecotourism. They are designed to map, organize, and promote the best birdwatching locations in a state to attract local and out-of-state visitors and encourage non-consumptive use of local environmental resources. Ecotourism is a growing industry (McCamy Reference McCamy1992) that promises tangible economic benefits to local communities by increasing employment opportunities and land values associated with natural attractions (Campbell-Hunt Reference Campbell-Hunt2014; Wunder Reference Wunder2000), while maintaining local conservation goals (Bookbinder et al. Reference Bookbinder, Dinerstein, Rijal, Cauley and Rajouria1998; Stewart et al. Reference Stewart, Liggett and Dawson2017). Many consumers are willing to pay premiums for the chance to experience natural environments, so these activities can provide sustainable economic benefits to locals (Meleddu and Pulina Reference Meleddu and Pulina2016), particularly in rural areas where natural resources are prevalent.
Birdwatching is a popular (Cordell and Herbert Reference Cordell and Herbert2002) and growing form of ecotourism. It has been shown to offer substantial benefits to local economies as avitourists intent on observing local birds visit an area (Biggs et al. Reference Biggs, Turpie, Fabricius and Spenceley2011; Hvenegaard et al. Reference Hvenegaard, Butler and Krystofiak1989; Sekercioglu Reference Sekercioglu2002). Local birdwatching resources attract visiting birdwatchers who visit nearby economic institutions such as hotels, eateries, and shops, as well as providing the opportunity for birdwatching festivals and events which can generate millions of dollars of output for local communities (Kim et al. Reference Kim, Scott, Thigpen and Kim1998; Measells and Grado Reference Measells and Grado2007). At times, even individual birds can stimulate substantial economic activity from avid birdwatchers. In a study by Callaghan et al. (Reference Callaghan, Slater, Major, Morrison, Martin and Kingsford2018), a single vagrant Black-backed Oriole generated economic benefits worth an estimated $223,000 over the 67 days it was seen in the area. States may adopt policies to implement birdwatching trail programs to capitalize on environmental resources and compete for this ecotourism revenue.
Birdwatching trails identify a state’s best birdwatching locations, publish maps and signage to increase their accessibility, and market them to the public to encourage local ecotourism. While they receive little attention outside of the birdwatching community, these policies are highly salient to local members of that group, who remain excited about developing more access to local birdwatching locations, celebrating local birds, and potentially helping local communities capture some of the economic benefits that can result from ecotourism (Biggs et al. Reference Biggs, Turpie, Fabricius and Spenceley2011; Measells and Grado Reference Measells and Grado2007). The number and location of sites included in a trail are determined by program leaders with input from the local birdwatching community and are typically based on the quality of birdwatching at the site (in terms of the variety and abundance of birds found there), the feasibility of adding the site, and the availability of existing infrastructure making it accessible. Implementing the program then involves adding signage to those sites and publishing maps and materials promoting their use by ecotourists. These materials provide information on the precise location of each site, how to access it, and what ecotourists might expect to see if they visit it. They are typically offered as paper-bound brochures and distributed at state tourism facilities, although some states offer digital versions online or via smartphone apps as well.
It is important to note that these birdwatching “trails” are not physical pathways between sites; rather, they are institutions used to promote ecotourism as a means of stimulating economic development in an area. They are more accurately viewed as informational policies that package information previously held exclusively by local birdwatchers and publish it for a wide audience to increase awareness of, and ease of access to, existing ecotourism opportunities. This makes them distinct from other types of programs aimed at developing infrastructure for outdoor recreation. Visitors are not exposed to just another trail they can walk down but to an institution designed to lend legitimacy and importance to local avitourism. Birdwatching trails offer a unique way of packaging environmental resources and marketing them to the public that has captured the interest of policymakers throughout the USA. While the administrative details of individual programs at times vary, every birdwatching trail included in this study represents the same basic policy and is homogenous across several key criteria: (1) they are designed to identify key birdwatching locations, mark them for public use, and map them for public access, (2) they promote local ecotourism as a means of economic development, and (3) they are backed by a state-level public agency, either through direct control, partnership, funding, or support.
The first birdwatching trail program, The Great Texas Coastal Birding Trail, was founded in Texas in 1993, and designed with the three criteria we use to define these programs, to facilitate development of the local ecotourism industry (Lindsay Reference Lindsay2012). Since its creation, this program has been perceived as highly effective and has served as an example for other states interested in emulating the policy concept. Consequently, similar programs have sprung up around the USA since 1993. As of 2019, 110 trails had been founded across 34 continental US states. The Great Texas Coastal Birdwatching Trail is sponsored and managed by the Texas Parks and Wildlife Department (TPWD) and was initially funded through the Transportation Efficiency Act (1991). The TPWD later expanded the program by creating additional trails throughout the rest of the state, and in 2019 boasted nine regional trails in total, each covering a different ecological zone, providing access to different kinds of ecotourism experiences, and sporting the opportunity to observe different specialty species.Footnote 2
While all birding trail programs around the country follow the same basic blueprint, variation between different iterations of the policy exists as program leaders tailor implementation to their specific environmental and organizational contexts. Programs differ in their size based on local environmental conditions, the resources and funding they have available, and their administration. They do not require top-down legislative action to form, instead being developed and administered internally by state executive agencies.
Most trails are administered at the state level by public environmental-facing agencies, such as a department of natural resources or its equivalent, but some are implemented at the local level by local organizations or private NGOs that are keen on seeing the policy implemented in their area. These local programs are often less extensive in scale and operate on a smaller budget than their state-level peers, but they are the same in other regards. Despite being implemented by different organizations, the local programs we include in this study have all received support, whether through funding, partnership, or recognition, from state agencies and function almost identically to those run at the state level.
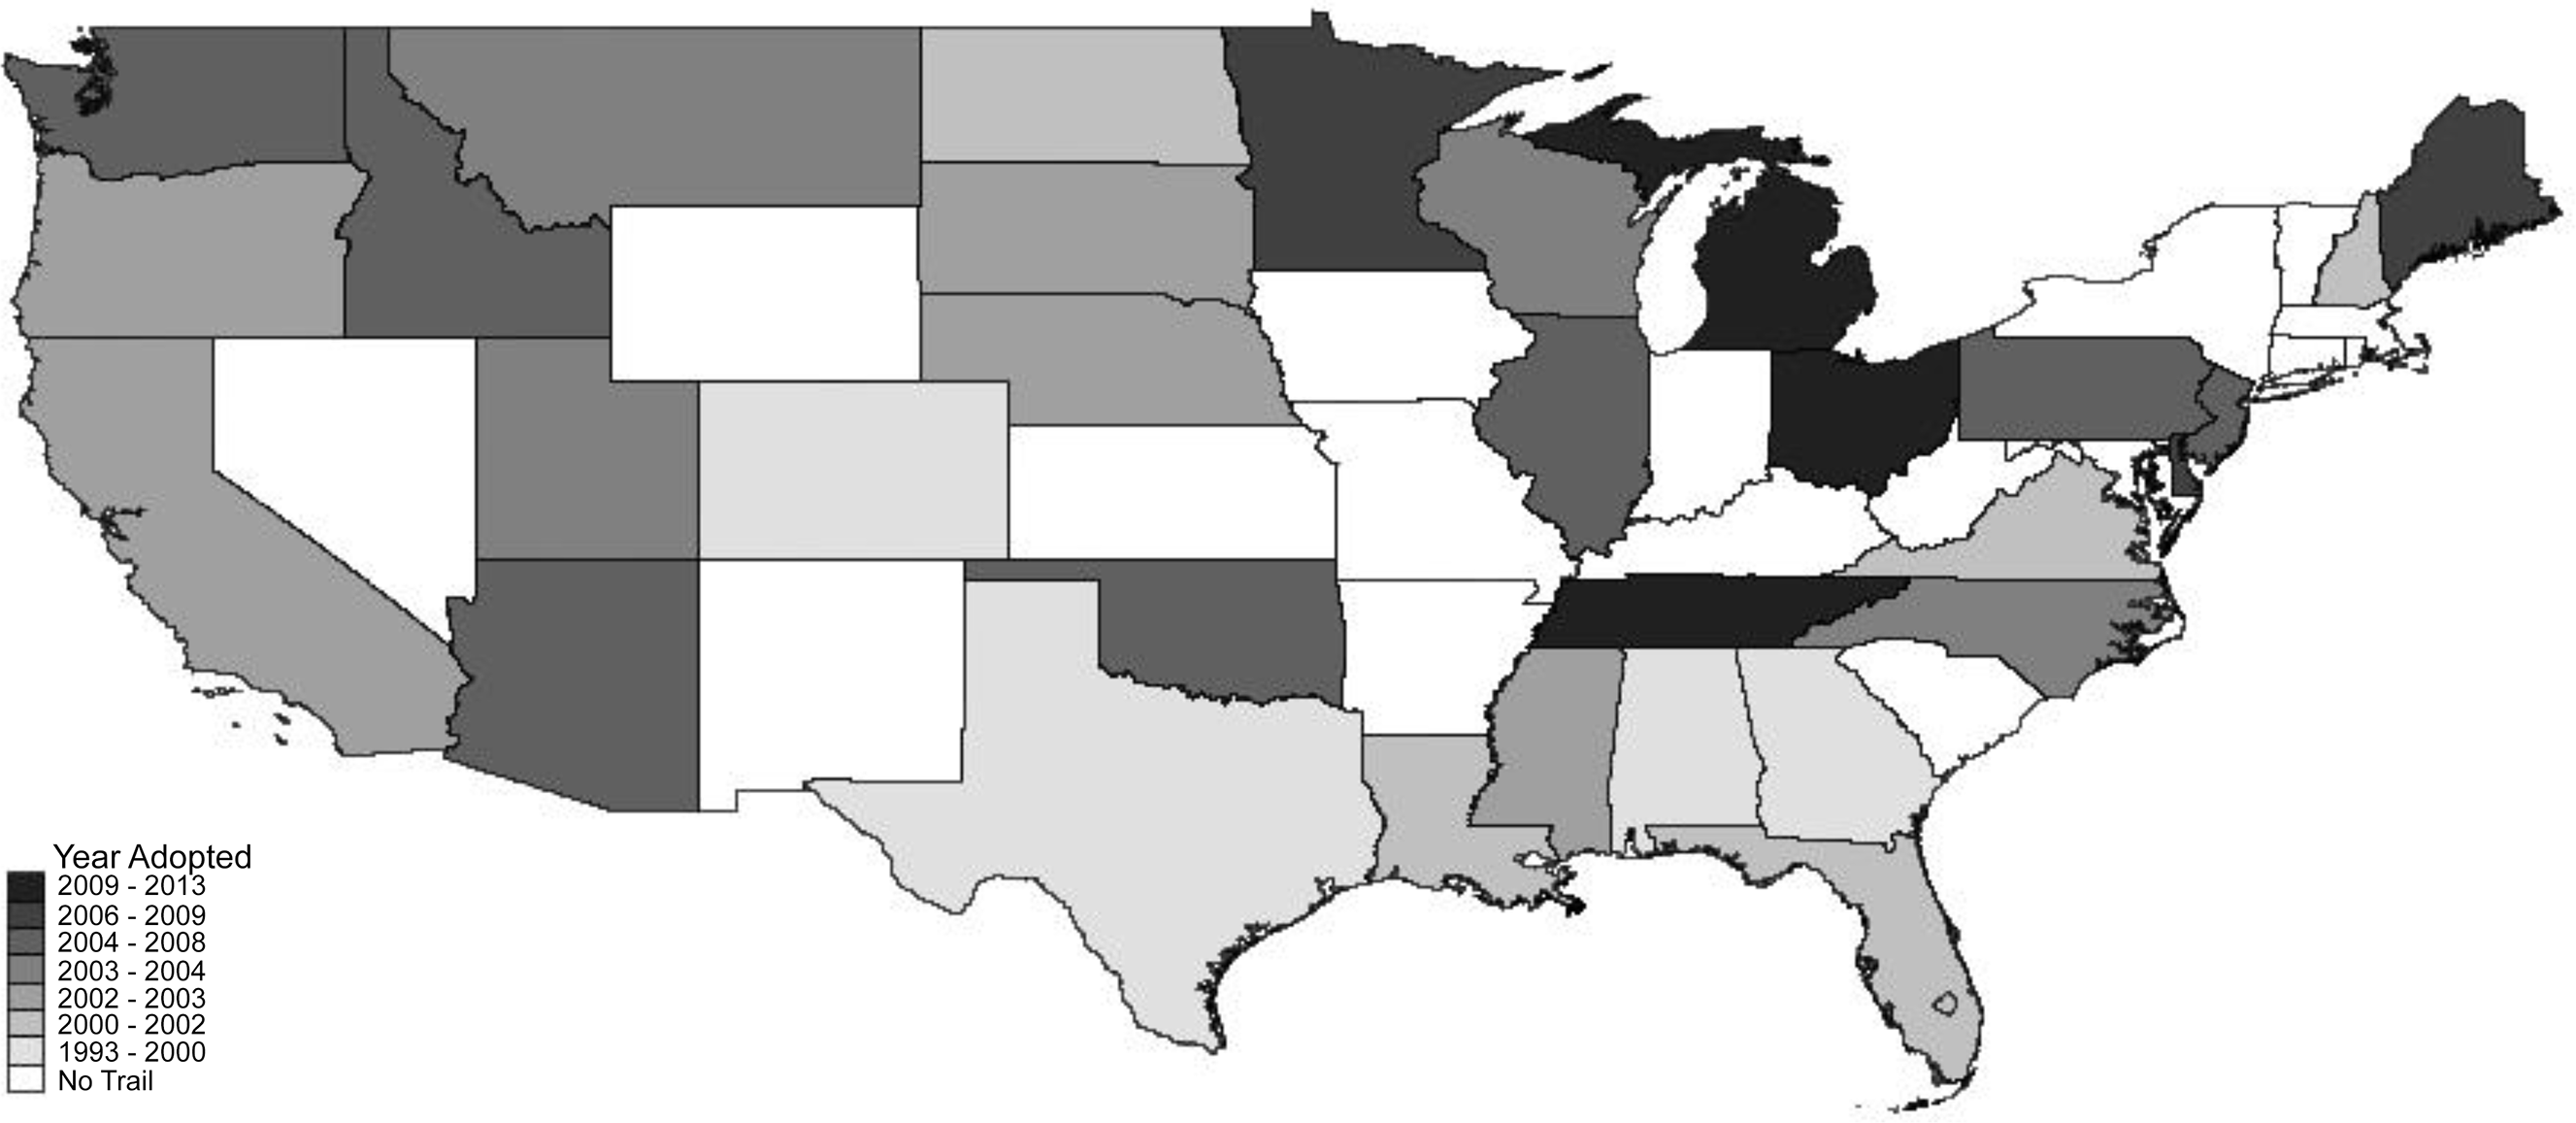
Casual observers visiting a trail who might learn about the program and try to entrepreneur a similar trail in their home state are unlikely to notice any difference between state and locally run trails, so we consider these policies uniform when investigating their diffusion. Many states also have more than one trail; multiple trails can be created and operated side by side; and many states that have received continued interest in this policy have expanded, or supplemented, their programs, implementing more in-state trails over time. For states with multiple regional trails, the level of coordination between individual trails ranges from tight-knit, where each trail is part of a single system and run by the same decisionmakers, to loosely connected, where independent trail leaders allow their trails to be associated with one another by name but rarely coordinate with each other in practice. In loosely connected trail networks, common support from the same state agency may be the strongest link between program sites. Figure 1 depicts the distribution of states with birdwatching trail programs and their geographic spread over time, indicating the year in which each state adopted its first program. Additional details are included in the appendix.
Date of state implementationFootnote 3 .
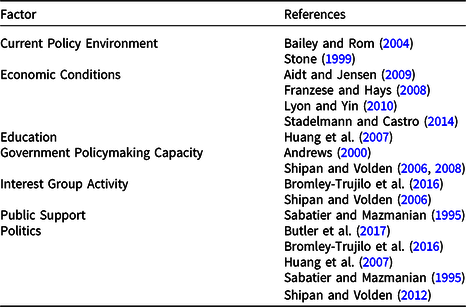
Birdwatching trails are small-scale, low-salience policies. They are low-cost, successfully operating on a small budget; many programs are largely designed and operated by volunteer members of the birdwatching community and impose minimal costs on the sponsoring organization. They are also low conflict since they present very few opportunities for contentious political debate, creating little to no popular resistance. While these policies are highly relevant to members of the birdwatching community and local businesses that could capitalize on ecotourism development, they are largely seen as unimportant to the broader public. Overall, they involve very low levels of conflict and ambiguity, creating few barriers to implementation (Matland Reference Matland1995). This makes them an excellent subject for study as they provide a clear look at how diffusion occurs with few barriers to implementation obstructing the effects of the micro-level mechanisms in play. States’ ability to adopt large-scale, highly salient policies often hinges on their fiscal health (Aidt and Jensen Reference Aidt and Jensen2009), policymaking capacity (Andrews Reference Andrews2000), and contextual factors such as the level of public support (or opposition) and ideological political debate (Butler et al. Reference Butler, Volden, Dynes and Shor2017; Sabatier and Mazmanian Reference Sabatier and Mazmanian1995). These factors can overwhelm the impact of diffusion and confound attempts to investigate how the micro-level mechanisms driving policy spread operate (Bromley-Trujillo et al. Reference Bromley-Trujillo, Butler, Poe and Davis2016; Huang et al. Reference Huang, Alavalapati, Carter and Langholtz2007). Table 1 summarizes some of the main internal characteristics that can dominate policy diffusion, muddying the waters about the external influences at work and making the precise mechanisms of diffusion difficult to discern. The low salience of birdwatching trail programs exempts them from the influence of these factors, mitigating much of the noise that surrounds diffusion of large-scale policies.
Internal factors dominating policy adoption
One of the largest factors constraining the spread of birdwatching trails is availability of knowledge about the policy. Since the general population has low interest in this type of policy and the trails themselves maintain a relatively low profile, policymakers may simply not know the policy exists. However, birdwatchers make up a widespread network of stakeholders to whom this policy is salient, providing a potential conduit through which learning about birdwatching trails can spread (Cordell and Herbert Reference Cordell and Herbert2002). While birdwatchers are not a highly visible social group to outsiders, they are common throughout the USA and maintain strong community relationships. Many birdwatchers share both social relationships with local peers and more formal relationships across the country (and sometimes world) through the birdwatching organizations, associations, and coalitions they are a part of (Baker Reference Baker2023). Birdwatchers regularly self-organize into tight-knit local clubs or chapters where they meet to share information, experiences, and expertise about birds and the activity of watching them, gather for shared bird walks and community events, and promote local conservation. Many of these small groups are interconnected with each other, as well as with larger regional, state, and national birdwatching associations, such as the National Audubon Society and the American Birding Association (2023). The National Audubon Society has 600,000 members across over 450 local chapters in the USA (Audubon 2023). These groups connect birdwatchers across the country together, creating a widespread network of like-minded stakeholders.
Knowledge diffusion across stakeholder networks is an influential driver of diffusion (Borracci and Giorgi Reference Borracci and Giorgi2018; Conley and Udry Reference Conley and Udry2010; Reagans and McEvily Reference Reagans and McEvily2003). Additionally, since birdwatchers are typically well-educated and have above-average incomes (Ceballos-Lascurain Reference Ceballos-Lascurain1996; Cordell and Herbert Reference Cordell and Herbert2002), individuals in this stakeholder network carry substantial social and political capital and have the potential to be highly influential policy entrepreneurs. Since birdwatching trails are designed to increase interest in, and resources for, local birdwatching, they have a clear motivation to promote the policy. As individual birdwatchers within this network travel between states, visiting and learning about birdwatching trails in other areas, they bring home knowledge of the program, creating a vector for social contagion and facilitating policy learning. They then work to convince policymakers in an environmentally facing agency at home to adopt the idea.
Discussions with individuals involved in developing birdwatching trail programs revealed that birdwatchers who want to imitate existing programs in their state do this in two main ways. Either they take on the role of policy entrepreneur themselves and track down personnel in a state agency who is willing to listen to their proposal for a trail, or they promote the idea in their local birdwatching club, typically a local Audubon chapter, which then spearheads entrepreneurship or policy development with the state agency. These local chapters act as hubs for members of this policy subsystem and play a critical role in the process of convening entrepreneurs with similar interests and incubating new policy ideas. Local interest groups often take on the role of advocacy coalitions (Sabatier and Jenkins-Smith Reference Sabatier and Jenkins-Smith1999; Sabatier and Weible Reference Sabatier and Weible2014) and work to influence policymakers toward adopting policies they support.
As supported by discussions with stakeholders, the presence of local Audubon groups is important in facilitating the entrepreneurship with state agencies that drive diffusion of birdwatching trail policies. However, not all Audubon chapters are active or have high levels of political capital; wide variation exists depending on the characteristics of local members. This should be closely correlated with activity in the larger network of local birdwatchers since highly active groups are likely to have more active members. If their members do not travel, allowing interaction with other groups and policies in different states, knowledge about birdwatching trails would be slow to spread, if it did at all, slowing diffusion to a crawl. Birdwatchers, particularly active members, often travel to observe birds in different regions, creating a lot of movement within the stakeholder network. Because the bird species present in nearby states are often very similar, individuals travel to watch birds often choose to travel great distances in search of species that are not present where they live. This promotes social contagion and learning in non-proximal patterns. We capitalize on these movements to test the role of a stakeholder network as a mechanism of diffusion.
We hypothesize that birdwatchers’ exposure to birdwatching trail programs in other states drives the spread or expansion of birdwatching trails within their home state. Policy diffusion is driven by the movement of members of a state’s stakeholder network as they travel, learn about novel policy ideas in other states, and then return home. Tracking where birdwatchers travel from year to year can allow us to identify social contagion between states and understand which states are learning from each other. Since the patterns of contagion shift over time, it is important to maintain a time-variant approach. Tracking the movement of individuals from a stakeholder network between states over time offers a unique, empirically testable micro-level mechanism of policy diffusion. Birdwatching trail programs offer the opportunity to test these mechanisms and study stakeholder networks in depth, through a case of widespread and ongoing policy diffusion, a clearly identifiable network of stakeholders within a special interest group, and high-resolution data describing how these stakeholders interact.
Materials & methods
In this study, we test a novel, time-variant mechanism of policy diffusion, leveraging citizen-science data to track movement of members in a stakeholder network over time. We construct a panel dataset from a variety of data organized at the state-year level.Footnote 4 We gather original data on the US birdwatching trail programs from online archival data supplemented by discussions with program personnel, then adding citizen-science data recording birdwatcher movement and controls for state socio-political and environmental characteristics. The final dataset includes observations for the population of continental US states from 1993, when the first program was created, to 2016. Alaska and Hawaii are outliers in terms of geographical location, cost of travel, and biodiversity and are, thus, excluded from the study.
Data
Our dependent variable is a discrete variable, measuring the number of birdwatching trails in a state, and is strongly balanced in the dataset. Detailed records for the birdwatching trails in many states did not previously exist and had to be gathered from online archival records and discussions with program personnel which also served to inform our understanding of the policies’ context and how they function in practice. However, the nature of these programs guarantees their observability. Birdwatching trail programs are intended to advertise local birdwatching resources, so their presence is necessarily observable, mitigating the threat of observation bias. If information on a program does not exist, we can safely assume that there is no program.
We exploit citizen-science data to create a time-variant measure of stakeholder network movement to model micro-level diffusion as our main independent variable. This mechanism is operationalized as the number of birdwatchers from a state who visit states with birdwatching trail programs in a year. This provides a measure of both the direction and frequency of visitations between states, allowing us to capture social contagion by measuring the amount of policy exposure members of each state’s stakeholders receive each year. The more interaction birdwatchers from one state have with locations and other birdwatchers in a state with an existing policy, the higher the likelihood that they learn about the policy idea and bring it back home to entrepreneur within their own state. Citizen-science data from eBird (2021), detailed further in the appendix, provide information on individual-level movement among the US birdwatching community. This platform is widely used, offering a sample of active birdwatchers, and has been recognized as a high-quality data source for conservation science (Callaghan and Gawlik Reference Callaghan and Gawlik2015; eBird 2021).Footnote 5 Birdwatchers submit records of the number and species of birds they observe to eBird, providing high-quality ecological data for scientific use. These data are typically used in environmental science, supplementing data traditionally gathered by researchers in the field to work on bird conservation (Wood et al. Reference Wood, Sullivan, Iliff, Fink and Kelling2011), population monitoring (Callaghan and Gawlik Reference Callaghan and Gawlik2015), and other ecological subjects. However, eBird also creates records of birdwatchers’ locations each time they submit birdwatching data.Footnote 6 This gives a unique look into how members of the birdwatching stakeholder network circulate, providing an avenue for novel use of the data to observe circulation among the community of its users. Since visitation between states shifts over time, this measure of social contagion is temporally dynamic, providing an understanding of how visitation and knowledge transfer between states shifts over time.
While the low salience of these policies helps us isolate diffusion effects without being overwhelmed by the impact of key internal state characteristics, we must still control for relevant state-level variables in our model. Birdwatching policies may appear more attractive to liberal policymakers who are more likely to prioritize environmental issues, so we control for state politics using the index of government ideology introduced by Berry et al. (Reference Berry, Ringquist, Fording and Hanson1998). We control for population using data from the US Census Bureau (1990, 2000, 2010) as the number of people in a state influences the size of its birdwatching community, and states with larger populations stand to gain more from these policies through domestic ecotourism. We also control for industry economic conditions by controlling for the level of foreign and domestic tourism spending in the USA (NTTO 2016), since states will be incentivized to adopt ecotourism policies when tourism gains are at a high level, and environmental conditions (i.e. the diversity and density of birds in the state) using eBird species data (eBird 2021). Birdwatchers are attracted to areas with high avian biodiversity and large numbers of birds, influencing decisions over whether states adopt ecotourism programs. We control for the level of these internal resources, measuring biodiversity as the number of bird species recorded in a state each year, and density as the average number of individual birds observed per birdwatcher each year. Finally, we use yearly exogenous time trend controls for nationwide shifts over time. All variables are lagged by one year to allow time for their impact to take effect on the policy process. Descriptive statistics are reported in Table 2.
Descriptive statistics

Methodology
State characteristics may help drive the likelihood of implementing birdwatching trail programs, so it is important to consider time-invariant state characteristics such as cultural norms and environmental context. However, the event history analysis models traditionally applied to test diffusion do not excel at controlling for these factors. Fixed-effects regression is much more effective at controlling for this type of unobserved heterogeneity between groups when using panel data (Allison Reference Allison2009). This is highly important when studying the geographically bounded policies we are examining in this study. Since these individual-specific effects are correlated with independent variables in the model, using fixed-effects methods will produce unbiased estimates (Wooldridge Reference Wooldridge2010). We use an OLS fixed-effects regression, presented both with and without robust standard errors (Angrist and Pischke Reference Angrist and Pischke2009), to test the impact of stakeholder network movement on policy diffusion as described in equation 1.
 $$\eqalign{ & Likelihood\,\,of\,\,Trail\,\,Implementatio{n_{it}} = {\beta _0} + {\beta _1}\;{(Stakeholder\;Movement)_{it}} \cr & \quad \quad \quad \quad \quad \quad \quad \quad \quad \quad \quad \quad \quad \quad \quad \quad \quad \quad + {\beta _n}\;{X_{it}} + {\alpha _i} + {\varepsilon _{it}} \cr} $$
where
 ${X_{it}}$
= controls, α
i
= fixed effects, and ε
it
= idiosyncratic error term.
This methodology is effective at proving strong causal inferences when using panel data (Gangl Reference Gangl2010) and controls for a wider range of threats to internal validity than the survival models typically used in diffusion studies. Because our dependent variable has a count distribution, an MLE-estimated count model could provide a better fit to protect against over-dispersion (Aeberhard et al. Reference Aeberhard, Cantoni and Heritier2014; Rodriguez Reference Rodrıguez2013). We run a zero-inflated negative binomial model as a robustness check and find that the results align with those from our primary OLS fixed-effects model, which we maintain for ease of interpretation. We also conduct several robustness checks to test the sensitivity of our measure of social contagion. We test the same negative binomial model controlling for state effects using a set of dummies, as well as coding three alternative operationalizations of stakeholder network movement: (1) the percentage of a state’s birdwatchers who travel to states with programs in a year, (2) the total number of visits they make to states with programs each year, and (3) the number of states with programs that birders from a state visit each year. Replacing our measure of social contagion with these three alternative operationalizations does not substantively change our results, as seen in the appendix, indicating that our results are reliable across different interpretations of how to measure contagion.
Results
Stakeholder network movement significantly drives the diffusion of birdwatching trail programs. The more exposure states have to these ecotourism programs through their stakeholder network, the more likely they are to establish or expand their own program. Holding state and year constant, states are roughly 2.8 times more likely to establish a trail for every thousand birdwatchers from that state who are exposed to the policy while traveling. When local birdwatchers travel to places with established programs, they return home with knowledge of the program, exposing their home state to that policy idea. This makes it more likely for their home state to implement, or expand, the program. Government ideology also significantly influences whether states implement birdwatching trail programs, with more conservative legislatures being more likely to adopt the program. Domestic spending on tourism is negatively correlated with adoption, indicating that states without highly developed tourism industries may be more willing to pursue policies that might help them build one. Additionally, states are significantly more likely to implement a birdwatching trail program if they have high species diversity, allowing them to capitalize on domestic environmental resources. Finally, the annual exogenous time trend we include is a significant factor in states’ likelihood to adopt this policy, demonstrating the presence of nationwide changes over time.
The full results of our main model are included in Table 3. While the effects of ideology, spending, and species disappear when the model is run with robust standard errors, the impact of stakeholder movement remains significant, reinforcing our main findings. Nevertheless, we include the results of the zero-inflated negative binomial model in Table 4 to account for overdispersion. Results from our robustness checks are substantively similar to those from our primary model; they are discussed in greater detail in the appendix.
Fixed-effects regression results

***p < 0.01, **p < 0.05, *p < 0.1.
Zero-Inflated negative binomial model

Likelihood ratio test of α = 0: chibar2(01) = 17.44 Pr ≥ chibar2 = 0.000.
***p < 0.01, **p < 0.05, *p < 0.1.
Discussion
The results provide evidence that policy diffusion is driven by stakeholder network movement, showing how they influence policy change through social contagion. Just as some birds facilitate the discontinuous spread of plants by carrying their seeds over long distances, birdwatchers spread the conceptual seeds of ecotourism programs with them when they travel. This micro-level mechanism provides a useful tool to understand how policy ideas diffuse through stakeholder networks and provides an explanation for how the micro-level interactions guiding social contagion operate, reinforcing Pancheco’s (Reference Pacheco2012) social contagion model and answering calls for more research on alternative explanations for policy spread (Douglas et al. Reference Douglas, Raudla and Hartley2015; Nicholson-Crotty and Carley Reference Nicholson-Crotty and Carley2018).
While proxies such as regional proximity are useful tools for understanding diffusion at a gross scale (Boehmke and Witmer Reference Boehmke and Witmer2004; Daley Reference Daley2007), they are not refined enough to capture subtle changes at the micro level. Measuring movement within a stakeholder network offers the specificity necessary to study interconnectivity at high definition, while also providing a way to understand how those interconnections change over time. Connections between states are not always static; it is important to understand how shifts in their interrelations over time can alter how policies diffuse between them. The literature needs more work investigating and specifying alternative diffusion mechanisms (Jordan and Huitema Reference Jordan and Huitema2014). As a micro-level, time-variant mechanism, stakeholder network movement offers a useful way of conceptualizing how knowledge transfer and policy diffusion occur.
The spread of these ecotourism programs provides an excellent opportunity to study the impact of micro-level diffusion mechanisms. Their low-cost and low-conflict nature allows examination of the mechanisms driving their spread while avoiding many of the contextual barriers influencing the adoption of larger-scale policies that might convolute their signal. While decisions about the adoption of highly salient policies are often dominated by finances (Aidt and Jensen Reference Aidt and Jensen2009), government capacity (Andrews Reference Andrews2000), and public debate (Sabatier and Mazmanian Reference Sabatier and Mazmanian1995), the low salience of birdwatching trails allows us to investigate the direct mechanisms involved in policy diffusion without the overwhelming influence of these factors. This unique case of birding trail program diffusion allows us to study diffusion patterns at a high resolution and offers perspective on how underlying mechanisms function.
While this case presents a unique opportunity to measure and test the impact of social contagion, it comes with an implicit tradeoff between internal and external validity. The phenomenon we observe is not likely to generalize to policy initiatives that are highly salient, demand widespread media attention, and are seen as important by most policymakers. Major top-down initiatives likely have more complex political pressures, reducing the ease of observing the impact of any single stakeholder network. By studying birdwatching trail programs, the clarity we obtain for the internal validity of our study may prevent us from generalizing our results to the type of top-down policy typically studied in the diffusion literature. However, grassroots movements, which often carry little salience and look much like the drive for policies we observe here in their nascent stages, play an important role in the US policymaking process (Chetkovich and Kunreuther Reference Chetkovich and Kunreuther2006). Special interest groups, whose policy priorities lack salience outside of their communities, frequently push for the realization of their policy goals. While further research is needed to verify this claim, the type of diffusion we observe in the spread of birdwatching trails should be generalizable to a wide array of policy arenas where ideas must rely on social contagion to spread, rather than mainstream modes of idea-sharing such as media outlets or political agendas, regardless of the specific content matter that community focuses on. Furthermore, our results provide insight into the diffusion of bottom-up policies in the context of the diverse stakeholders present in policy subsystems. While bottom-up policy implementation is commonplace (Matland Reference Matland1995), much of the diffusion literature examines the spread of top-down initiatives (Cao Reference Cao2010; Makse Reference Makse2021; Zhou et al. Reference Zhou, Matisoff, Kingsley and Brown2019). We point out stakeholder network movement as a key driver for policies that develop from the ground up.
We demonstrate the utility of fixed-effects methods for studying policy diffusion issues. The ability of these models to control for unobserved subject-specific characteristics and threats to internal validity makes them a powerful tool in this area. However, fixed effects do not control for changes in subject-specific effects over time and may not be robust to treatment effect heterogeneity or dynamics over time (Callaway and Sant’Anna Reference Callaway and Sant’Anna2021), leaving our analysis open to several potential endogeneity issues. We are unable to control for several potentially relevant factors in our model, such as the strength of local policy subsystem actors or coalitions, changes in interstate transportation that alter the ability or cost to travel between specific states over time, dynamic trends in the makeup of the birdwatching community in different states, and changes in the individuals in leadership positions within the state agencies engaged in sponsoring birdwatching trails. Failing to account for local subsystem strength may be particularly important since local Audubon chapters play such a large role in engineering adoption of these policies. Despite the correlation between the individuals included in our sample from eBird and these networks, failure to control for local Audubon membership is a drawback in our model and potentially limits the internal validity of our results.
While controlling for other factors would strengthen our model as well, the potential for endogeneity bias created by these issues is small since we do not have evidence of any specific state-level changes that would be particularly relevant to birdwatching trail program implementation, and we control for country-level changes over time with an exogenous time trend. Furthermore, we assess diffusion at the state level, while some birdwatching trail programs are operated by actors at the local, regional, or, in a few cases, interstate level. While all these trails are homogenous across key criteria defining the program and have been endorsed at some level by a public state agency, stakeholder network movement may vary for some sub-groups of programs. Our state-level analysis does not distinguish between diffusion of policies between states and expansions within states that already have at least one trail in place where the idea diffused from one region to another. States accrue multiple trails through diffusion of the policy idea to new regions via entrepreneurial birdwatchers or through deliberate expansion of existing trails; our data do not specify between the two. Additional data and analysis are needed to capture this level of heterogeneity and investigate the program-level impacts it creates. Finally, these programs have a widespread and well-defined stakeholder network. This is not true for all policy subjects. Our results are likely not generalizable to policy arenas with poorly defined or rival stakeholder groups. Future research should consider these factors when using stakeholder network movement to predict policy diffusion.
This study also points to the ancillary benefits of ecotourism in a region. The spread of ecotourism programs expands capacity for scientific coproduction. By implementing birdwatching trail programs, states stimulate increased local ecotourism and, in doing so, are increasing opportunities for citizen-scientists to gather data. Many ecotourists regularly contribute to citizen-science databases, so growing ecotourism in a region will likely result in an increase in data with which to study local subjects. Ecotourism opportunities facilitate coproduction of science by engaging stakeholder networks in opportunistic data collection through citizen-science initiatives (Horns et al. Reference Horns, Adler and Şekercioğlu2018). The data they gather can be used to research environmental issues, monitor local ecosystems, and facilitate more effective environmental management (Kosmala et al. Reference Kosmala, Wiggins, Swanson and Simmons2016). These data can be useful for policy research as well. As citizen science datasets continue to become more widely used and expand, they are becoming an increasingly rich source of information. Not only do they provide data on the primary subjects they focus on but they often include high-definition information on the characteristics and behavior of their users. Future policy research can leverage this unique source of data to track the movement of citizen scientists as members of a stakeholder network.
Conclusions
Policy diffusion is an important aspect of the policymaking process and represents a well-developed area of study. However, the micro-level mechanisms driving its spread deserve more attention (Jordan and Huitema Reference Jordan and Huitema2014; Nicholson-Crotty and Carley Reference Nicholson-Crotty and Carley2018). Much of the current literature examines macro-level proxies for knowledge transfer and overlooks the diversity of stakeholder networks engaged in policy subsystems. We investigate the impact of stakeholder network movement on policy diffusion, identifying movement within a special interest group network to predict knowledge transfer and policy diffusion. We find that this mechanism significantly drives the spread of ecotourism programs across the USA, offering a more precise understanding of diffusion at the micro level.
Acknowledgements
The authors would like to thank the editor and reviewers for their insight in helping improve this manuscript. They would also like to extend their thanks to the many stakeholders involved with birdwatching trails around the country for patiently helping them understand the intricacies of this policy area.
Data availability statement
Replication materials are available on the Harvard Dataverse at https://doi.org/10.7910/DVN/BZXO52 (Mistur and Matisoff, Reference Mistur and Matisoff2023).
Appendix A
We include several robustness checks to test the strength of our results. First, we use a zero-inflated negative binomial model, which includes state controls via a set of dummy variables with a logit inflation model as a robustness check to account for potential overdispersion in our dependent variable. The results are displayed in Table A1. The likelihood ratio test shows that our dependent variable is overdispersed, indicating that this model is appropriate for use. However, the results confirm those from our primary model, so we maintain the OLS fixed-effects model for greater ease of interpretation.
Zero-Inflated negative binomial model with state controls
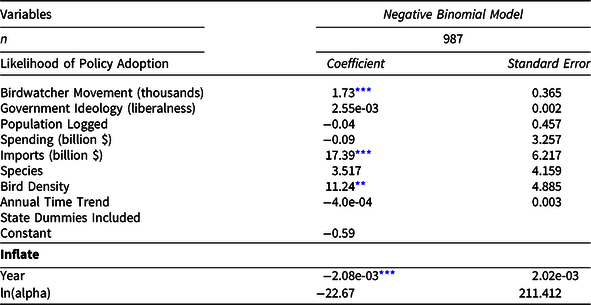
Likelihood ratio test of α = 0: chibar2(01) = 371.59 Pr ≥ chibar2 = 0.000.
***p < 0.01, **p < 0.05, *p < 0.1.
We also test the sensitivity of our measure of social contagion to alternate operationalizations of stakeholder network movement. First, we code the number of visits made by birdwatchers from state to state with established programs. While our primary operationalization measures the number of birdwatchers who are exposed to birdwatching trail programs in other states, these individuals may visit other states multiple times, gaining different levels of exposure. Our first alternate operationalization, Total Visits, provides a sense of the strength of exposure undergone by traveling birdwatchers. Second, in Percent Visited measures, the level of exposure among a state’s birdwatching community. Here, we code the percentage of birdwatchers from a state who are exposed to the policy in their travels. The influence of birdwatchers as a stakeholder group may be larger if they have uniform messaging in support of a policy idea. Therefore, stakeholder groups that have received more complete exposure to a policy idea may send a stronger signal to policymakers. Third, in States Visited we code the number of different states with birdwatching trail programs that are visited by birdwatchers from a state. Since each state’s programs are slightly different and represent a unique case of the program, knowledge of different programs might be more important than knowledge of the policy type in general. This indicates how many different programs a state has been exposed to. Each of these alternate mechanisms is treated in the same way as our primary operationalization and lagged by one year. Descriptive statistics for these three mechanisms are included in Table A2.
Descriptive statistics

We test each alternate operationalization in our model using OLS regression with fixed effects to test the reliability of our results using different measures of network diffusion. The results, displayed in Table A3, are presented both with and without robust standard errors for comparisons and are statistically similar to those from our primary model and largely reinforce our findings.
Robustness checks with alternate diffusion operationalizations

***p < 0.01, **p < 0.05, *p < 0.1.



