


A’ingae (also known as Cofán or Kofán) is a language isolate spoken by approximately 1,500 people in 13 communities in Ecuador and Colombia (Figure 1). Traditionally, the A’i (speakers of A’ingae) lived in the Andean foothills, but over the past century they have migrated down the Aguarico and San Miguel rivers, founding communities at Dureno and Zábalo, where the language is most widely spoken. This migration was spurred in large part by extensive oil contamination; an issue of great concern to the Foundation for the Survival of the Cofán People (FSC) and the community at large (Cepek Reference Cepek2012: 103; Reference Cepek2018: 1–15). Another concern in the Cofán community is the decreasing use of A’ingae, which, according to Ethnologue (Simons & Fennig Reference Simons and Charles2017), is ‘endangered’ in Ecuador and ‘severely endangered’ in Colombia as a growing emphasis on Spanish disincentivizes the younger generation from learning A’ingae.
Top: Map of communities of A’ingae speakers in Colombia (Janasoy & Pérez Vera Reference Janasoy, Ángela and Pérez2005), shaded in light gray. Bottom: Map of communities of A’ingae speakers in Ecuador (Map of Cofán Territories 2014, http://library.brown.edu/create/firstreading2014/learn-more/maps-of-ecuador/map-of-cofan-territories/), shaded in light gray and numbered 1, 3, 5, and 6.

There is no known dialectal variation of A’ingae, likely due to the fact that communities were displaced relatively recently. Zábalo, for instance, was established circa 1980. However, despite this recent separation, many in the community anecdotally believe that there is some degree of variation, a claim which merits further investigation. While A’ingae has largely remained the language of everyday life and is learned natively by children in at least Zábalo and Dureno, Spanish and Kichwa appear to be increasing in use to some extent, especially in Dovuno and Sinangoé. We leave it to future research to examine these patterns in detail since this topic has yet to be systematically studied.
There is little previous work on the sound system of A’ingae. The existing phonological descriptions are based on transcription, without acoustic data (Borman Reference Borman1962, Fischer & Hengeveld Reference Fischer, Kees and Lev2019), and there are several aspects of phonological contrasts and the phonetic realization of phonemes which are characterized differently in these two works. SIL missionaries Marlytte and Roberta Borman developed an orthography for A’ingae in the 1950s, which has been adapted slightly in recent years by community members. Since the latter is in common use presently, but is not fully described in print, we use both in our orthographic transcription, which makes it more accessible to members of the A’ingae community.
We present a complete phonetic description of the A’ingae phonological inventory, based on recordings of three male native speakers (ages 32, 34, and 53 years) of A’ingae, one from Dureno, Ecuador and two from Zábalo, Ecuador. In addition to providing acoustic analyses of allophones, we examine a few notable aspects of A’ingae phonology.
All items were elicited as translations from Spanish or English. Each word was produced twice in isolation and then twice in the frame sentence afa’chu ___ ayepambi ‘the word ___ is easy’; all measurements come from the second utterance within the frame sentence to ensure the most fluent production. Measurements for both consonants and vowels were averaged across all three speakers, with the phoneme in question measured word-initially for half of the utterances and word-medially for the other half of the utterances. Two different recorders were used due to different recording conditions. One speaker was recorded in Providence with the internal microphone of the Zoom H4n Handy Recorder in a sound-attenuated room. The two speakers in Ecuador were recorded on the Audio Technica AT803 Lavalier Microphone in a quiet room. A sampling rate of 44100 Hz was used for both.
Consonants
There are 27 consonant phonemes in A’ingae, illustrated in the chart and word list below. Voicing is contrastive for stops and affricates, but not for fricatives. Examples of each consonant are word-initial, except for consonants which are not attested word-initially: /ʔ/ and /ɰ/.


The glottal stop can be realized as creakiness and is not always reflected phonetically in rapid speech. However, it is phonologically contrastive, as indicated by the minimal pair in (1).
-
(1)


A’ingae has both short- and long-lag voiceless stops and affricates, as well as voiced stops and affricates that are produced with prenasalization. The short-lag stops and affricates, while transcribed as unaspirated, have a substantially positive voice onset time (VOT), as is given in Table 1. Among affricates, the mean VOT of each voiceless category is even longer.
Average VOTs of A’ingae stops and affricates by place (in ms).

This three-part series was observed by Borman (Reference Borman1962) and Fischer & Hengeveld (Reference Fischer, Kees and Lev2019); we contribute to the analysis by providing VOT measures. As shown in Figure 2, according to data averaged across 16 utterances per speaker, voiceless unaspirated and voiceless aspirated stops and affricates have distinct VOT distributions. The small degree of overlap is due to physiologically driven differences between places of articulation, as are observed elsewhere (Cho & Ladefoged Reference Cho and Peter1999); e.g. the VOT of /k/ is sometimes longer than the VOT of /ph/, but there is no overlap within a place of articulation.
Density plot of VOTs for A’ingae long-lag and short-lag voiceless stops (left) and voiceless affricates (right).

Drawing on our corpus of speech and written texts, there is a laryngeal co-occurrence constraint in A’ingae not observed in previous literature: within a root, voiceless stops and affricates with the same place of articulation also must match in their aspiration type, as illustrated by the examples in (2) and (3).Footnote 1
-
(2) Attested forms

-
(3) Unattested forms

No observed roots have voiceless stops or affricates that match in place but differ in VOT category, nor could our informants think of any examples when prompted. On the other hand, when stops and affricates within a root differ in place they can also differ in VOT category. This restriction is only present within the two voiceless series. The prenasalized series of stops and affricates does not abide by the laryngeal constraint; prenasalized segments can co-occur with both of the voiceless series.
Although informants could not think of any examples of words in which a root had voiceless stops matching in place but differing in VOT category, given the very limited documentation, it is possible that such forms are simply infrequent and may yet be discovered.
The co-occurrence constraint is not active across morphological boundaries, as is demonstrated in (4), in which surface forms have sequences of stops which match in place of articulation but differ in laryngeal category.
-
(4)

Co-occurrence restricted to the domain of the root is cross-linguistically common, both for long distance co-occurrence constraints generally (e.g. Hansson 2010) and for laryngeal constraints more specifically (e.g. MacEachern Reference MacEachern1999). The co-occurrence restriction does not have an effect across manner of articulation. That is, a voiceless alveolar stop may differ in VOT category from a voiceless alveolar affricate in the same morpheme.
On the basis of acoustic measurements, we find that voiced stops and affricates are consistently realized with prenasalization, as illustrated by the circled part of Figure 3, in which there is a clear period of nasalization before the closure of the word-initial stop. While the period of prenasalization has a significant intensity and duration in word-medial segments, these effects are slightly weaker word-initially, which may be why Fischer & Hengeveld (Reference Fischer, Kees and Lev2019) describe these stops and affricates as being underlyingly prenasalized but lacking prenasalization in word-initial position. Others, such as Borman (Reference Borman1962: 51), have also been uncertain about the nature of prenasalization, claiming that voiced stops and affricates are allophonically prenasalized following nasal vowels. The realization of these segments is also consistent in borrowed words, e.g. [ŋgɾĩ.ŋgõ.ŋge] ‘English’.
[ǀŋgoa.thiã.ɲẽ] ‘to boil’ (left); [ǀfa.mbi] ‘eel’ (right).

The average durations of prenasalization in voiced stops and affricates are given in Table 2. This data was gathered from eight utterances from each speaker. The relative durations of nasalization and full closure differ between the stops and affricates.
There are four voiceless fricatives: /f/, /s/, /ʃ/, and /h/. They are all typical representatives of their respective phonological categories, except for /s/, which is usually realized with aspiration (Gordon, Barthmaier & Sands Reference Gordon, Paul and Kathy2002). The area encompassed by the oval in Figure 4 illustrates this realization. The presence of aspiration is reflected by a shift from high frequency high amplitude aperiodic noise characteristic of [s] to a period of lower amplitude and more evenly distributed noise. The aspiration is similar to that of other short-lag VOT obstruents in A’ingae, with a mean of 20 ms (sd = 8). In addition to the direct evidence of aspiration, the vowels following /s/ have a more negative spectral slope than vowels following other fricatives, suggesting breathiness, as often results from neighboring segments with spread glottis features. None of the fricatives other than /s/ exhibits evidence of aspiration.
Average duration of nasalization in A’ingae prenasalized voiced stops (in ms).

[ǀkha.se] ‘again’.

The presence of an aspirated fricative without an unaspirated counterpart would be typologically unparalleled (Jacques Reference Jacques2011: 1519), with the possible exception of Korean, in which there is a phonetically aspirated /s/ and a glottalized ‘fortis’ /s*/, but it is not clear which aspects of the phonetic differences are phonologically fundamental to the contrast (Cho, Jun & Ladefoged Reference Cho, Sun-Ah and Peter2002). The duration of this aspiration in A’ingae is somewhat shorter than it is in other languages, though aspiration on frictatives tends to be short cross-linguistically (Jacques Reference Jacques2011, Salgado, Slavic & Zhao Reference Salgado, Jessica and Ye2013).
There are three approximants in A’ingae; /j/, /υ/, and /ɰ/. The nature of the labiodental approximant, seen in the oval-encompassed area in Figure 5, has been a source of some disagreement, but analysis of video data confirms the place of articulation as labiodental, and acoustic analyses confirm that the sound is consistently realized as an approximant, with clear formants and little aperiodic noise. Thus, our data supports Fischer & Hengeveld’s claim that the sound is indeed the labiodental approximant, [υ], which had been erroneously described by Borman (Reference Borman1962: 51) as being the voiced bilabial fricative /β/ with labiodental variants following low unrounded vowels. This misinterpretation was likely due to the fact that aerodynamic constraints can result in voiced fricatives being more sonorous than their voiceless counterparts, however, the lack of other voiced fricatives in the phonological inventory are consistent with this sound being an approximant phonologically and not just phonetically.
/ǀsaʡ.ʋɨ.͡tsi/ ‘warm’.

Previous descriptions of the velar approximant /ɰ/ have been more varied. Borman (Reference Borman1962: 46) described it as a contrastive phoneme and identified it as the voiced velar fricative /fl/. Fischer & Hengeveld (Reference Fischer, Kees and Lev2019) do not include this segment in their inventory, though in words where we have identified this segment, they transcribe it with [ɡ]. Our acoustic analysis demonstrates that the sound is consistently realized as an approximant [ɰ], with little aperiodic noise and clear formants reflecting a velar constriction, as seen in the part of the spectrogram in Figure 6 that the oval encompasses. Beyond these phonetic observations, we note that this produces a more uniform phonemic inventory, with one series of voiced approximants and one series of voiceless fricatives.
/ǀe.ɰa/ ‘bad’.

Vowels
The vowel system of A’ingae includes 22 vowels: five oral monophthongs, six distinct oral diphthongs, and contrastive nasal counterparts of each, as reflected in the near-minimal pair /ǀo.thi/ ‘to hammer’ and /ǀõ.tǀ̃/ ‘horsefly’.
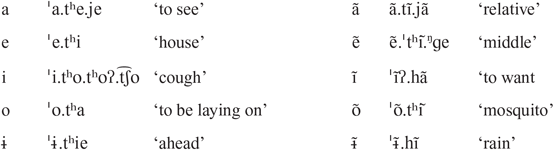
The five oral monophthongs are /a/, /e/, /i/, /o/, and /ɨ/, which is consistent with previous work (Borman Reference Borman1962, Fischer & Hengeveld Reference Fischer, Kees and Lev2019), and the formants of oral monophthongs are the same as their nasal counterparts. A formant analysis across 20 utterances per vowel confirms the distinctiveness of each oral monophthong, as shown in the first half of Figure 7. The second half of the figure gives the mean values for the corresponding nasal monophthongs; we had fewer tokens for the nasal vowels, but the oral formants are very similar to those in the oral vowels.
Average F1 and F2 of A’ingae oral monophthongs (top); average F1 and F2 of A’ingae nasal monophthongs (bottom).

While there is some overlap in the distributions of /e/ and /ɨ/ due to sampling across environments, their means are different both in F1 (4.05 Bark for /e/, 3.78 Bark for /ɨ/) and F2 (11.01 Bark for /e/, 10.17 Bark for /ɨ/); F3 further helps distinguish them (mean 12.82 Bark for /e/, 12.35 Bark for /ɨ/). These vowels are all phonologically contrastive, as is apparent from speakers’ consistent production of them in particular words, and their ability to distinguish between them, even when presented in the same environment.

There are six diphthongs in our data: [ai], [oe], [oa], [oi], [ɨi], and [ao] (recordings for [ǀphoi.ka.ɲẽ] and [a.ǀhjeʔ.khao] are not available). While there are other orthographic VV sequences, several of them are consistently realized with an intervening glide. In addition, orthographic <ae> and <ai>, which Borman (Reference Borman1962: 54) describes as distinct sequences, are not acoustically distinguished in our data, though the spelling of individual words is generally consistent in which one is used. Several other orthographic pairs similarly do not seem to be contrastive.
Figure 8 demonstrates the trajectories of diphthong formant averages from 20% to 80% through the diphthong. Between four and seven words were analyzed per diphthong, depending on how many examples we had identified for our elicitations. The formants largely align with the corresponding monophthongs.
Quadrilateral of average A’ingae diphthongs.

Nasal spreading
In addition to the phonemic contrast of oral and nasal vowels, there are several nasal spreading processes. All vowels after nasal consonants are nasalized, as is observed by Fischer & Hengeveld (Reference Fischer, Kees and Lev2019). Vowels in these environments are nasalized throughout, indicating that the process is phonological, and not merely phonetic coarticulation. However, nasal vowels can occur after oral consonants and also word-initially, so they are clearly phonologically contrastive. Nasality also spreads between adjacent vowels and vowels separated by a glottal consonant, as can be seen in suffixes (morpheme boundaries denoted by the symbl ‘=’), which vary in nasalization depending on the preceding vowel, as in (5).
-
(5)

However, consonants with oral constrictions block nasal spreading (Fischer & Hengeveld Reference Fischer, Kees and Lev2019), as is apparent in the oral vowels of [jõ.ǀɧgoe.sɨ] ‘what’ and [nẽ.ǀpi.je] ‘to arrive, to finish’ (note that prenasalized voiced stops are among the consonants that block nasal spreading). This kind of nasal spreading has been found in many Amazonian languages (Payne Reference Payne2001, Stenzel Reference Stenzel2007). Van Gijn (Reference van Gijn, Loretta and Pieter2014) offers a summary of the Amazonian languages that exhibit this feature and contrasts them with the Andean languages, where this pattern is not observed. This provides further support for regarding A’ingae as belonging to the Amazonian linguistic area, a position which – while not especially controversial – is not a given due to the A’i people’s historical territory at the interface of these two regions.
Nasality also spreads rightward from nasal vowels onto adjacent consonants, at least in certain morphemes; voiceless unaspirated stops become voiced prenasalized stops and approximants become nasals after a nasal vowel, as is reflected in affixes which vary in form depending on the preceding vowel (Fischer & Hengeveld Reference Fischer, Kees and Lev2019). This pattern is illustrated in (6).
-
(6)

Sequences of nasal vowels followed by voiceless unaspirated stops are infrequent within the lexicon. However, there are counterexamples such as [ǀ͡tsã.pi] ‘forest’, in which such a sequence is maintained without nasal spreading. It is possible that the infrequentness of these sequences is due to a historical phonological rule that is now inactive, with morphophonological alternations preserved for certain morphemes. Although we can draw no definitive conclusions at this point, the pattern is noteworthy nonetheless; future work may elucidate the nature of the assimilation process and the apparent exceptions to it.
Syllables and stress
A’ingae syllable structure is (C)V(ʔ); nuclei can contain a vowel or a diphthong and glottal stops are the only licit codas (Borman Reference Borman1962: 54; Fischer & Hengeveld Reference Fischer, Kees and Lev2019). Sequences of a high vowel followed by another syllable beginning with a homorganic glide are sometimes realized without the high vowel, resulting in surface CCV(ʔ) syllables in which the second consonant is a glide, e.g. [bijaʔa] ‘long’ and [bjaʔa]. Many of these sequences seem to come from VV sequences produced across morpheme boundaries, and it is not entirely clear how best to analyze their underlying forms. In addition, there are some exceptions to the CV syllable structure in borrowed words, where additional onset clusters are allowed, e.g. [ɧgɾǀ̃.ɧgõ.ɧge] ‘English’. However, in other borrowed words, like [ɾãnde] ‘big’ from the Spanish <grande>, the onset clusters are simplified.
Glottal stops have a limited distribution; they only occur in codas and cannot occur word-finally. Borman (Reference Borman1962: 56) identified several cases of alternations in glottal stop position within morphemes, but did not provide a phonological analysis of the process producing the alternations. We propose that glottal stops undergo metathesis with preceding vowels when their underlying position is word-final, as demonstrated in examples (7) and (8). When the glottal stop is followed by another syllable, it surfaces in the same position.
-
(7)

-
(8)

While underlying glottal stops are sometimes realized as creakiness on the preceding vowel, creakiness can also occur phrase-finally. All instances of word-final creaky vowels seem to be the result of phrase boundaries, rather than underlying glottal stops.
A’ingae has phonological stress, reflected phonetically primarily in duration, though it is also associated with higher f0, at least within the declarative frame sentence and in isolation. Amplitude was also measured, but did not exhibit significant stress-related differences. Stressed and unstressed syllables were compared within a speaker for each of the three speakers; vowel quality, word length, and position of the syllable within the word were balanced across items. All syllables were penultimate or antepenultimate, within disyllabic and trisyllabic words. The syllables were elicited in both isolation and in a declarative sentence, and mean values for stressed and unstressed syllables are given in Table 3. Both the duration and f0 maximum differed significantly between stressed and unstressed syllables in both elicitation environments based on 10 words analyzed per speaker.
Phonetic correlates of stress (N = 120).

Our observation that prominence in A’ingae syllables within the contexts that we examined is regularly cued by high f0 is not meant to suggest that f0 is an inherent characteristic of stress; previous work in other languages has demonstrated that the relationship between f0 and stress can be mediated by the intonational context (e.g. Ladd Reference Ladd1996: 45–50). Nonetheless, as this is the first sketch of the phonology of A’ingae, and we do not yet have data to evaluate possible intonational conditioning of stress realization or interactions with the features of surrounding segments, we choose to report the observed f0 patterns, as they may be relevant for subsequent work. We report f0 maximum rather than peak timing because many syllables have very flat f0, which hinders measurement of peaks, and because the prevalence of voiceless obstruents inhibits consistent pitch tracking across syllables as well as perturbing f0 at vowel edges.
The position of stress is somewhat constrained, but does not seem to be predictable. There is some lexically specific variation in stress position, as well as interactions with morphology, which can produce different stress positions within the same root. Some related forms exhibit different stress based on differences in the transparency of their morphological breakdown, as in (9); these reflect the partial regularity of stress within the same morphological environment.
-
(9)

There are also some minimal pairs distinguished only by stress, with the same morphological environments, as in (10); these demonstrate the lexical component of stress.
-
(10)

Borman (Reference Borman1962: 57–59) describes stress as usually being penultimate or earlier within a word, noting that there are interactions between stress and morphology that were beyond the scope of that paper. Fischer & Hengeveld (Reference Fischer, Kees and Lev2019) assert that stress usually occurs on the final syllable of verb stems and on the penultimate syllable of noun stems, with the stress domain including derivational suffixes but not inflectional suffixes or clitics. Given our data, this analysis does not seem sufficient. Stress is usually penultimate or antepenultimate within the root, and never occurs word-finally except in monosyllabic words. However, stress can differ depending on the particular root and is affected differently by different affixes and clitics; we do not yet have enough systematic data on combinations of each of these elements to propose a full system.
Likewise, we do not yet have enough systematic data across sentence types to propose an analysis of the intonational system. Most utterances within our corpus are declarative sentences and words in isolation; both exhibit an overall falling f0. Words that are focused by a quotative context, like the forms elicited by our frame sentence, are realized with a higher f0 than surrounding words.
Transcribed passage
English
The North Wind and the Sun were disputing which was the stronger, when a traveler came along wrapped in a warm cloak.
They agreed that the one who first succeeded in making the traveler take his cloak off should be considered stronger than the other.
Then the North Wind blew as hard as he could, but the more he blew the more closely did the traveler fold his cloak around him; and at last the North Wind gave up the attempt.
Then the Sun shone out warmly, and immediately the traveler took off his cloak.
And so the North Wind was obliged to confess that the Sun was the stronger of the two.
A’ingae phonetic transcription
õ.ǀmba.khɨ.ni.sɨ ǀfĩ.ɧgiã ǀto.ja.kãe koḛ. ǀhe.te.a. ǀfã̰.kho.he.fa ǀmã.jã.nde ǀti.͡tshɨi ǀkĩ.jã.khẽ ǀ͡tsõ̰.hẽ.nῖ.nde ǀha.kã̰.sɨ ǀtõ.mbia̰ ǀsa̰.ʋɨ.͡tshiao. ǀpuḭ.hẽ.ŋga fĩ. ǀdi.je.͡tʃo ǀhi tã.ǀsḭ̃.fa.te.͡tsa ǀmã.hã ǀo̰.tiḛ ǀti.se ǀha.ka̰.sɨ fĩ. ǀndi.je.͡tʃo o.ǀpuḭ.hẽ.mã u. ǀʃiʡ.͡tʃha.͡tʃho kĩ.jã.nẽ ǀ͡tsõ.mba.teǀõ.mba.ni.sɨ fĩ.ŋgiãǀɨ.fakiã̰.mẽǀti.seǀu.∫a̰.fã̰.ɳgaǀ͡tsa.maǀti.seǀti.͡tsheǀɨ.fa̰.niǀha.kã.sɨ ǀti.seǀ o.ǀpuḭ.hẽ.mã ǀfĩ.ndi o. ǀse.faʔ.pã.ŋga õ. ǀmba.khɨ.nḭ.su ǀfĩ.ŋgiã u. ǀ∫ã.mbi.pa ã.thḛ ǀ͡tsõ.si.te ǀkoe.he ǀsaʔ.υɨ.͡tsiǀ͡tʃã.hɨ ͡tsɨ̃ḭ̃.kɨ.tḛ fa. ǀυa.͡tsɨi ǀha.kã̰.sɨ ǀti.se o. ǀpuḭ.he.mã u.ǀ∫i.͡tʃha̰ǀ͡tso. mbaʔ ǀõ.mba.ni.su ǀfĩ.ŋgia tã.ǀsi.jã̰.͡tʃo.υe.ǀda̰.ja ͡tsa ǀkoḛ.he ǀkhua̰.ŋgi.ŋga ǀĩʔ.ha.ni ǀti.͡tshe ǀkĩ.jã.khḛ̃
A’ingae orthographic transcription (Borman orthography)
Omba’ccuni’su Fingian toyacaen Coe’jete afa’cco’je’fa majan de ti’tsse qui’an’qque, tson’jeninde jacan’su to’mbia sa’vutssia opui’jenga findiye’cho ji
Tansi’fate tsa majan o’tie tise jacan’su findiye’cho opui’jema oshi’chhachho ti’tsse qui’añe
Tsombate, ombani’su fingian u’fa quia’me tise osha’fanga, tsama tise ti’tsse ufa’ni jacan’su tise opui’jema findi; osefa’panga ombaccuni’su fingian oshambipa antte
Tsonsite coe’je sa’vutssi chan’jun, tsuin’ccute favatsseyi jacan’su tise opui’jema oshicha
Tsombate ombani’su fingian tansi’ña’choveda’ya tsa coe’je ccoa’nginga in’jani ti’tsse quian’qque.
A’ingae orthographic transcription (Community orthography)
Umba’khûni’sû Fingian tuyakaen kue’jete afa’khu’je’fa majan de ti’tshe ki’an’khe, tsun’jeninde jakan’sû tu’mbia sa’vutshia upûi’jenga findiye’chu ji
Tansi’fate tsa majan u’tie tise jakansû findiye’chu upûi’jema ushi’chhachhu ti’tshe ki’añe
Tsumbate, umbani’sû fingian û’fa kia’me tise usha’fanga, tsama tise ti’tshe ûfa’ni jakan’sû tise upûi’jema findi; usefa’panga umbakhûni’sû fingian ushambipa anthe
Tsunsite kue’je savutshi chan’jun, tsuin’khûte favatsheyi jacan’su tise upûi’jema ushicha
Tsumbate umbani’sû fingian tansi’ña’choveda’ya tsa kue’je khua’nginga in’jani ti’tshe kian’khe.
Acknowledgements
We would like to thank our A’ingae consultants – Jorge Mendua, Luis Mendua, and Juanquina Quenamá – and to all the members of the Dureno and Zábalo communities for warmly welcoming the outsiders of our team. Thanks also to Ryan Bennett, Uriel Cohen-Priva, Wilson Silva, the audience at Brown’s LingLangLunch, the JIPA reviewers, Maksymilian Dabkowski, Yiming Gu, Rachel Gutman, and all the other students in the Spring 2017 CLPS 1390 course for helpful feedback and questions on the work presented here and ideas on A’ingae generally.
This project was carried out with support from Endangered Language Documentation Programme grant ELDP #SG0481 Kofán Collaborative Project: Collection of Audio-Video Materials and Texts as well as support from the Brown Dean of the College’s UTRA program.



