

Background
Functional status, an individual's ability to perform normal daily activities required to meet basic needs, fulfil usual roles and maintain health and wellbeing (Leidy Reference Leidy1994), is a metric that corresponds to both quality of life and number of years lived. Over the last several decades there have been varying temporal trends in the functional status of individuals close to retirement age and older (Freedman et al. Reference Freedman, Spillman, Andreski, Cornman, Crimmins, Kramarow, Lubitz, Martin, Merkin, Schoeni, Seeman and Waidmann2013; Martin, Schoeni and Andreski Reference Martin, Schoeni and Andreski2010). Because functional status impacts labour force participation, the adequacy of the future labour force in ages where these functional limitations begin to increase in prevalence is not clear. The objective of this paper is to use a projection model to understand the proportion of the population aged 55–74 who are likely to have the capacity to work over the next several decades. We also examine how this may differ by level of education. We define capacity for work as being healthy enough to be in the labour force. We are interested in this age group in particular because there is substantial public policy and health promotion interest in encouraging greater labour force participation in this population, yet the prevalence of deficiencies in functional status and mobility increase after the age of 55. There are both individual and societal benefits for individuals remaining in the labour force for a longer period of time than is currently the norm. There is evidence that increased work at older ages may benefit an individual's health (Snyder and Evans Reference Snyder and Evans2006), particularly when work type is driven largely by personal preference (Herzog, House and Morgan Reference Herzog, House and Morgan1991). Having a greater proportion of the older population working either full or part-time past a traditional retirement age also has benefits for society through increased economic productivity, tax revenues and decreasing the costs of retirement-related benefits.
There is policy attention within liberal welfare states, those with a greater emphasis on market dominance (Esping-Andersen Reference Esping-Andersen1990), towards increasing the number of years individuals are in the labour force. Within many countries, the primary policy for influencing retirement age is the age at which retirement benefits begin and reach their maximum value. The current policy in many countries increases this age for later birth cohorts. For example, in the United States of America (USA), for individuals born in 1937, maximum benefits are available at the age of 65, while for individuals born after 1960, the age of maximum benefits is 67. As a response to the increasing share of the population over the age of 65, there has been discussion of further increases of the age at which retirement benefits are paid. Similarly, in the United Kingdom (UK), the state pension age is increasing from 60 for women and 65 for men to 68 for those born after 1978, with the potential for further increase in age of eligibility being reviewed every five years. After an increase in pension age to 67 in Australia, there is now a planned phase in for an increase to the age of 70 for individuals born after 1965. With this recent policy change in Australia employers have been promised additional funds to hire and retrain individuals over the age of 50. Suggesting that such complements to retirement age changes may be useful, prior research has suggested that age was not related to individual's motivation or ability to learn new skills (Tikkanen et al. Reference Tikkanen, Lahn, Withnall, Ward and Lyng2002), in particular for firm-specific training (Picchio and Van Ours Reference Picchio and Van Ours2013) that is the target of the Australian policy.
Garnering the benefits of work engagement requires that workers are not precluded from labour force participation due to functional limitations or chronic conditions that make them less likely to be in the labour force. However, there is substantial uncertainty regarding the capacity to work in this population. It is unclear if the majority of older individuals will have the physical ability to work even if they have economic incentives or preferences. While there have been well documented and substantial declines in disability among older adults since the 1980s (Martin, Schoeni and Andreski Reference Martin, Schoeni and Andreski2010), these trends appear to be flattening or even reversing such that improvements in disability recently have not kept pace with improvements in mortality (Freedman et al. Reference Freedman, Spillman, Andreski, Cornman, Crimmins, Kramarow, Lubitz, Martin, Merkin, Schoeni, Seeman and Waidmann2013). Increases in the prevalence of obesity (Flegal et al. Reference Flegal, Carroll, Ogden and Curtin2010) may also have a detrimental impact on capacity to work (Alley and Chang Reference Alley and Chang2007). Taken together, these factors may limit the number of individuals who have the capacity to work over the coming decades. This could undermine the future effectiveness of policies designed to increase work among older individuals, such as further increases in the age of qualification for full retirement benefits.
We focus our analysis on the capacity to work in the population aged 55–74. We follow the general motivation of a prior approach by using a regression-based model in individuals aged 55–59 to examine how chronic conditions and functional limitations predict being in the labour force (Cutler Reference Cutler2009). Then, capacity for work is predicted using the coefficients estimated in this model and the prevalence of predictors in the population aged 60–74. The prior analysis among only men found substantial capacity for work in ages over 60, a level that was much greater than the current level of employment in this age group, but found that capacity was more limited among individuals with lower levels of education (Cutler Reference Cutler2009). Thus currently, capacity for work in this age group seems to be substantial, but differences by level of education suggest that inequities could result due to inability to work among individuals with lower levels of education. The primary contribution of the current analysis is to extend estimates to estimate future work capacity in the US population aged 55–74 to the year 2050, as well as to examine this in the full population, not just for men.
There were three goals to our analysis. First, we quantified the extent to which health and functional status measures predict labour force participation in both men and women aged 55–59. Second, we modelled the current proportion of individuals aged 60–74 expected to have the capacity to work, based on the current age-specific prevalence of work-predicting characteristics. Third, we extend this model to predict the potential capacity for work in the US labour force aged 55–74 to the year 2050, based on multiple alternative assumptions and data sources on changes in functional limitations over time and on demographic characteristics of the future US population. To address this third question we use the best information currently available about predictors of whether men and women are in the labour force, along with projected demographic changes in those predictors. We estimate a range of future work capacities based upon different potential trends in minor and major functional limitations, including how they differ by level of education.
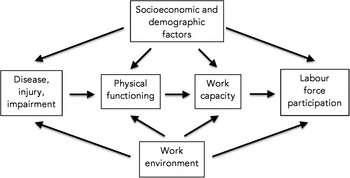
Figure 1 presents a conceptual model of the relationships between social factors, physical functioning, work capacity and labour force participation. The structure of the model helps to clarify the rationale for our proposed method of analysis, and also to describe some of the limitations of our approach. We include both the social and work environment in this figure, even though in our data we only have individual characteristics measured. This model draws from, and builds upon, prior conceptual models of hypothesised pathways from education to late-life functioning (Freedman and Martin Reference Freedman and Martin1999), models of the disablement process (Verbrugge and Jette Reference Verbrugge and Jette1994), and social ecological models of determinants of functioning, disability and health (World Health Organization 2002).
Conceptual model of the relationships of social factors, physical functioning, work capacity and labour force participation.

The model, shown in Figure 1, begins with the process of disease, injury and/or impairment, which are patterned by socio-economic and demographic factors, and influenced by the work environment. This state of an individual will over time influence physical functioning, which in turn will lead to differences in the capacity for work. We define capacity to work, in some literature also referred to as ‘work ability’, as the ability to perform ones job with respect to the demands of the work (Kenny et al. Reference Kenny, Yardley, Martineau and Jay2008). It is important to note that capacity for work is both influenced by socio-economic and demographic factors, but also depends on the nature of the work environment. While the characteristics of individual's physical functioning drive their work capacity, it is ultimately the intersection of the individual and environment that influences work capacity (Harper and Marcus Reference Harper and Marcus2006). That is, for any given level of physical functioning, the work environment itself will determine whether there is an effect of functioning on capacity. We also note that our conceptual model acknowledges that socio-economic and demographic factors influence each stage of the process between disease, injury and impairment, and labour force participation. This reinforces the importance of avoiding a singular focus on individual-level influences on work capacity at the exclusion of the environment (Ilmarinen Reference Ilmarinen2001).
We acknowledge the importance of work environment to contribute to levels of labour force participation, as described in the model. In addition, because there is not suitable data to measure work capacity directly, we use labour force participation in our models. This motivates our estimation of model coefficients (see below) in the population aged 55–59, where most individuals are in the labour force if they are physically able to work. For most of the population, if an individual is in the labour force then they have the capacity to work (the exception to this is those who are unemployed but looking for work, as they may actually not have an adequate capacity for work). The primary concern then is that labour force participation may underestimate work capacity because some individuals not in the labour force may have a sufficient level of work capacity. Since labour force participation includes individuals that are unemployed or looking for work, the utility of this proxy is not substantially impacted by economic trends and levels of employment.
We also note that in Figure 1 there is an arrow directly from work environment to work capacity. This shows that changes in the work environment may impact whether a person with a particular level of physical functioning is able to work. Due to the difficulties of predicting future work environments in the population based on current trends, we focus on work capacity as the end-point of our analyses, with our interpretation based on the work environment as currently exists.
Having an estimate of the proportion of individuals aged 55–74 in 2050 who will be able to work is central to informing the debate about increasing the age at which publicly financed retirement benefits are paid. If longer lifespan is characterised by an extension of years in which individuals have the capacity to participate in the paid labour force, increased life expectancy has different implications for retirement policies than if that period is characterised by disabilities that are incompatible with work. In addition, the solvency of income support programmes for retired individuals will depend at least in part on whether individuals will have the capacity to work at older ages.
Methods
Overview of modelling approach of projected work capacity
We first present an overview of the four steps of the process of modelling projected work capacity. After this overview, each of the four steps will be described in detail. The first step is to use logistic regression models to estimate the magnitude with which four socio-demographic measures and seven functional status and health measures predict whether individuals aged 55–59 are in the labour force (Cutler, Meara and Richards-Shubik Reference Cutler, Meara and Richards-Shubik2013; Kalwij and Vermeulen Reference Kalwij and Vermeulen2008). We focus on participants aged 55–59 in order to estimate coefficients in the population of individuals who generally want to be in the paid labour force if they are capable based upon current social norms and economic pressures of employment in this age group (Cutler Reference Cutler2009). The second step was to estimate the population prevalence of each of the four socio-demographic measures and seven functional status and health measures in the baseline year of 2010 and the projection years 2020, 2030, 2040 and 2050. The third step was to predict capacity for work in individuals aged 60–74, for years 2010–2050, by age, gender and level of education. This was estimated by applying the estimated regression coefficients from step one to the age-, year-, gender- and education-specific prevalences of the four socio-demographic measures and the seven functional status measures from step two. The fourth step was to estimate the population prevalence of capacity for work by year and level of education by multiplying the age-, year-, gender- and education-specific predicted work capacities estimated in step three by the proportion of individuals in each of those categories in the US population, for years 2010–2050, in order to capture the overall population-level impact.
Models predicting probability of labour force participation for ages 55–59
Step one of our modelling approach is using random effects logistic regression models to examine the relationships between four socio-demographic measures and seven different functional status and health measures with labour force participation as the dependent variable. These measures were selected based on prior literature. We fit all models stratified by gender on the population aged 55–59. We used data from the US Health and Retirement Study (HRS). HRS began in 1992 with a nationally representative sample of non-institutionalised US residents born 1931–1941, and their spouses (Juster and Suzman Reference Juster and Suzman1995). For our analysis, we used the HRS RAND Files Version L that were cleaned and organised to facilitate longitudinal analysis across waves of data from 1992 to 2010 (RAND 2011). We fit a random effects model to account for the multiple observations of individuals across waves.
The dependent variable was a dichotomous measure of labour force participation (RAND 2011). We consider an individual to be in the labour force if they are working any number of hours for pay, or if they are actively looking for full or part-time work. Thus our definition of working included anyone who is working any number of hours for pay, but did not include people who are doing unpaid work (e.g. care-giving or home-maker).
The four socio-demographic predictor variables that we included in our model were race, Hispanic ethnicity, level of educational attainment and occupation. We examined three race categories of white, black and other, and two ethnicity categories of non-Hispanic and Hispanic. We used four educational categories: (a) less than high school, (b) high school diploma or GED, (c) some secondary school or associates degree, and (d) four-year college degree. Self-report of the longest held occupation was divided into two categories: non-manual occupations (standard occupational categories 000–399) and manual occupations (standard occupational categories 400–905).
The seven different functional status and health measures that we included in our model were major functional limitations, minor functional limitations, obesity, diabetes, cancer, heart disease and stroke. Major functional limitations were assessed by a combination of the activities of daily living (ADL) and the instrumental activities of daily living (IADL) measures. The items included in the ADL were: bathing, eating, dressing, walking across a room and getting out of bed. The activities included in the IADL were: using a telephone, taking medication and handling money. If individuals were unable to do one or more of the tasks from either of these measures, they were defined as having a major impairment. Minor functional limitations was defined as not being able to do one of the following: walk several blocks, climb a flight of stairs, sit for two hours, and stoop, kneel or crouch (Crimmins and Beltran-Sanchez Reference Crimmins and Beltran-Sanchez2011). Individuals responding in the affirmative to any of these four questions were defined as having a minor impairment. We used self-reported height and weight from the HRS data to create a categorical variable that captured the potential non-linear risk on work across the Body Mass Index (BMI) distribution, because BMI at both low and high levels may be associated with probability of labour force participation, and a linear measure of BMI would not capture this. We used the standard categories of BMI as: underweight (<18.5), normal (18.5–24.99), overweight (25–29.99), obese class I (30–34.99) and obese class II (⩾35). We also included whether participants indicated that a doctor had ever told them they had diabetes, cancer, heart disease or stroke, with each treated as a separate item in our models. Initial models also included a measure of cognitive ability and of depression, but because these measures did not have a meaningful or significant correlation with work conditional on the other predictors in the regression models, they were not included in our final model.
The logistic regression model to predict work capacity was:
 $${\rm Labour\,force\,participation = \beta} _0 + X_1 {\rm \beta} _1 + X_2 {\rm \beta} _2 + u_{\rm i} + {\rm \varepsilon} _{{\rm it}}, $$
where β0 was a constant, X 1 was one of the independent functional status or health predictors listed above (e.g. major impairment), β1 was the estimated coefficients associated with the variable, X 2 was a vector of the socio-demographic factors (e.g. race), β2 was the estimated vector of coefficients associated with these factors, u i was a within-individual random effect to account for multiple observations of the same individual across waves and εit was the individual-level error term. We fit separate models by gender. We tested for interaction by black and Latino and found no significant or substantial interactions.
Projected population characteristics 2010–2050
The second step was to estimate the population prevalence of age, gender and each of the four socio-demographic measures and seven functional status and health measures in the baseline year of 2010 and the projection years 2020, 2030, 2040 and 2050. The age distribution of the population by race/ethnicity and gender in the year 2010 was obtained from US Decennial Census data. The forecasts of the race/ethnicity- and gender-specific age distribution of the population in 2020, 2030, 2040 and 2050 were based on the revised life expectancy estimates of the 2011 Social Security Technical Panel, which were preferable to those estimated by the US Census Bureau, as the Technical Panel forecasts were based on updated estimates of mortality. These life expectancy estimates were higher than those estimated by the US Census Bureau. The categories of white non-Hispanic, black non-Hispanic, Asian non-Hispanic, other non-Hispanic and Hispanic as mutually exclusive categories were used. We aggregated the categories of Asian non-Hispanic and other non-Hispanic to match data availability in other projection.
The projections of the educational composition of the population aged 55–75 in the years 2020, 2030, 2040 and 2050 were based on 2010 US Census estimates of educational distributions by age, gender and race/ethnicity, using the relevant birth cohorts. For example, year 2050 distribution was based on the educational distribution of the population aged 25–35 in the year 2010 (born 1975–1985) obtained from 2010 US Census data. This was a close match to the actual birth cohort of the age 55–75 populations in 2050 (born 1975–1995). We could not use the exact match because most individuals had not completed their education at the age of 15. We used distributions of the composition of educational categories that were specific to gender and race/ethnicity and obtained the overall population distribution of educational status in years up to 2050 by multiplying by the predicted gender and racial/ethnic distribution. We did not specifically account for differential mortality by educational level, beyond the extent to which it was captured in the population composition by race/ethnicity that do reflect different mortality rates. Similarly, we did not specifically account for differential outmigration by educational status, although outmigration was accounted for in the race/ethnic-specific population totals. A report by the US Census Bureau Population Division compared results of their standard projection with a zero immigration projection to assess the extent to which accounting for future immigration impacted their projections (Cheeseman Day and Bauman Reference Cheeseman Day and Bauman2000). They found that the range of results was between 2.9 per cent higher with zero migration to 5.3 per cent lower with zero migration. The distribution of occupations (blue collar versus white collar) in the population was based on a linear interpolation of US Bureau of Labor Statistics estimates of 2012–2022 trends (Bureau of Labor Statistics 2012).
The projection of the BMI composition of the future population was based on the current BMI of birth cohorts that would be aged 55–75 in the years 2010–2040 using recent US National Health and Nutrition Examination Survey (NHANES) data. For example, the projection of BMI for the year 2050 is based on the BMI distribution of the population aged 25–35 in the year 2010 (born 1975–1985) obtained from NHANES data. This was a close match to the actual birth cohort of the age 55–75 populations in year 2050 (born 1975–1995). We used estimates of the BMI composition that were specific to gender and race/ethnicity and obtained the overall population distribution of BMI up to the year 2050 by multiplying by the projected gender and racial/ethnic distribution as described previously. We did not account for differential mortality by BMI specifically, beyond the extent to which it was captured in the differential life expectancies by race/ethnicity and gender. Since BMI generally increased across working ages, and our estimates of the BMI levels in the population in 2030 and 2050 are based on current data, our estimates of the prevalence of BMI in the 30–35 and >35 categories were likely to be underestimates. If new, successful public health and medical interventions reduce BMI in these cohorts, our estimates could be inflated. We projected BMI as a categorical variable to capture the potential non-linear risk of work disability across the BMI distribution, as had been demonstrated for other outcomes (Durazo-Arvizu et al. Reference Durazo-Arvizu, McGee, Li and Cooper1997, Reference Durazo-Arvizu, McGee, Cooper, Liao and Luke1998).
There was considerable uncertainty regarding the future population burden of functional limitations in the population aged 55–75 in the USA to the year 2050. If based on a strict linear interpolation from historical data from 1990 to 2002, we would have predicted that functional limitations in older adults would decrease over time. Over this period, utilising results from multiple sources, the percentage of individuals in this age range having any type of disability decreased between 1.55 and 0.92 per cent per year, and the IADL index decreased from 2.74 to 0.40 per cent per year (Freedman, Martin and Schoeni Reference Freedman, Martin and Schoeni2002). Functional limitations decreased by about 1.5 per cent per year. However, more recent examination of trends since 1998 had shown little change, and possibly an increase (Freedman et al. Reference Freedman, Spillman, Andreski, Cornman, Crimmins, Kramarow, Lubitz, Martin, Merkin, Schoeni, Seeman and Waidmann2013). Due to the uncertain and rapidly changing patterns of functional status, and the strength with which they predicted work in our model, and therefore impacted our projections, we used two sources of data each with two different lengths of time trends, to develop four scenarios for the rate of change in both major and minor functional limitation. First, we used data from the previously described HRS to calculate the average yearly rate of change in both major and minor disability from the year 1992 to 2010 (scenario 1). To calculate trends out to the year 2050 we then applied the average yearly rate of change from this data to the age- and education-specific population groups. We also calculated the average yearly rate of change for only the most recent ten years of the data, from 2000 to 2010 (scenario 2), and calculated trends out to the year 2050 in a similar manner. Because trends differed markedly by level of education, we calculated each of these trends for both the population with less than a high school diploma and for the population with a high school diploma.
In addition to using data from HRS, we also used data from the US National Long Term Care Survey (NLTCS). These data have the advantage of both very high-quality measures of major and minor disability from a population-based study and a longer duration of trend than the HRS, with data from 1982 to 2004 (Manton, Corder and Stallard Reference Manton, Corder and Stallard1993; Manton, Gu and Lowrimore Reference Manton, Gu and Lowrimore2008). It also has a further advantage that its sampling frame includes individuals in institutions, which is likely to result in a more accurate population assessment of disability measures. From these data we created a major impairment measure of any of the ADLs and IADLs identical to that calculated from the HRS data. We also created, as similar as possible, a minor impairment measure, which included self-report or proxy report of an individual's ability to climb a flight of stairs, bend to put on shoes or stockings, and hold a bag of groceries for ten minutes. We calculated both longer-term (1982–2002, scenario 3) trends in major and minor disabilities and more recent trends (1992–2002, scenario 4) using the NLTCS data. For these scenarios we calculated average yearly rate of change across each of these different year ranges, and then applied them to age- and education-specific prevalences at baseline to project future major and minor levels of disability. As with the HRS data, these trends were calculated separately by level of education. The motivation behind examining four different changes in both major and minor disability over time is to estimate a range of potential future populations aged 55–74 based on what we may expect from past trends in the data. Given the variability in these trends over the last 30 years, the multiple scenarios enable us to estimate a more credible range of potential future populations. We focus specifically on multiple scenarios for major and minor limitations because these two factors are both strong predictors of labour force participation and are much more prevalent in the population than other important predictors that we model, e.g. chronic conditions. In addition, we have the strongest evidence that these factors have had recent relatively rapid changes in prevalence. The yearly rate of change for major limitations for scenarios 1–4 were 0.85, 0.66, 0.0010 and 0.027 per cent for low education, respectively, and 1.0, 0.36, 0.18 and 0.012 per cent for high education, respectively. The yearly rate of change for minor limitations for scenarios 1–4 were 0.76, 2.9, 0.047 and 0.29 per cent for low education, respectively, and 1.1, 2.2, 0.27, and 0.86 for high education, respectively.
Given an absence of reliable projections of chronic conditions out to the year 2050, we assumed that the prevalence of chronic conditions remained constant over time, but used age-specific prevalence (five-year age categories).
Prediction model for capacity for work in individuals aged 60–74
The third step was to predict capacity for work in individuals aged 55–74, for years 2010–2050, by age, gender and level of education. This was estimated by applying the estimated regression coefficients from step one to the age-, year-, gender- and education-specific prevalences of the four socio-demographic measures and the seven functional status measures from step two. We now refer to the variable to be predicted as ‘capacity for work’ rather than ‘labour force participation’, because in the ages past 59 fewer individuals are in the paid labour force. Our intent here is to estimate the population that could potentially be in the labour force, that is, have the capacity to work, given what we know about determinants of labour force participation in ages 55–59, and the differing prevalence of those factors among individuals aged 60–74. Separate prediction models were fit stratified by gender, age (60–64, 65–69, 70–74) and level of education (two categories) for each of the following predictor variables of interest: major impairment, minor impairment, obesity (five categories), diabetes, cancer, heart disease and stroke. Each model also contained the following potential confounding variables: race (three categories), ethnicity (three categories), education (four categories) and occupation (two categories).
We use the following prediction equation for work capacity:
 $$\eqalign{{\rm Work\,capacity}_{ijklm} & = {\rm \beta} _0 + {\rm \beta} _{1i} \times {\rm Major\,limitations}_{ijklm} \cr & \quad+ {\rm \beta} _{2i} \times {\rm Minor\,limitations}_{ijklm} \cr & \quad+ {\rm \beta} _{3i} \times {\rm Obesity}_{ijk} \cr &\quad + {\rm \beta} _{4{\rm i}} \times {\rm Diabetes}_{ijk} + {\rm \beta} _{5i} \times {\rm Cancer}_{ijk} \cr & \quad+ {\rm \beta} _{6i} \times {\rm Heart\,disease}_{ijk} + {\rm \beta} _{7i} \times {\rm Stroke}_{ijk}. }$$
The subscripts i, j, k and l indicate that work capacity is predicted separately for groups by gender (i), age group (j), year (k), level of education (l) as well as scenario of change in functional limitations (m). The β values are obtained from the logistic regression models in the population age 55–59, with the subscript i indicating that these are different for each gender. The values for major limitations and minor limitations are taken from the estimates as described in step two, with the i, j, k, l, m subscripts indicating that these population prevalences (and projections) are specific to gender, age group, year, level of education and scenario of change in functional limitations. The values for obesity, diabetes, cancer, heart disease and stroke are taken from the estimates as described in step two, with the i, j, k subscripts indicating that these population prevalences (and projections) are specific to gender, age group and year.
Applying model of work to projected population to 2050
The fourth step was to estimate the population prevalence of capacity for work by year and level of education by multiplying the age-, year-, gender- and education-specific predicted work capacities estimated in step three by the proportion of individuals in each of those categories in the US population, for years 2010–2050. We simulated eight future populations (four scenarios of disability change each by two levels of education) of 10,000 individuals. The basis for the population age, year, gender and education distribution is the actual US population in 2010 and the projected population in 2020, 2030, 2040 and 2050 using the Social Security Administration Technical Panel on Assumptions and Methods that estimated the number of individuals in the USA in each of these years.
Results
HRS sample characteristics by age and gender
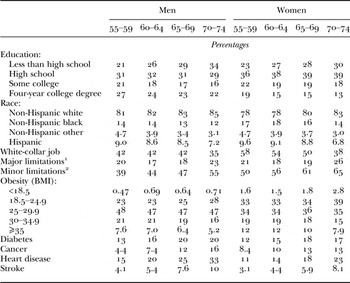
Table 1 shows the distribution (as column percentage) of the HRS population from 1992 to 2010, by gender and age categories.
Population characteristics by age and gender, Health and Retirement Study, 1992–2010

Notes: 1. Major limitation is having at least one deficiency of an activity of daily living or instrumental activity of daily living. 2. Minor limitations is defined as one of the following: inability to (a) walk several blocks, (b) climb a flight of stairs, (c) sit for two hours, or (d) stoop, kneel or crouch. BMI: Body Mass Index.
The regression models of labour force participation were fit on the population of men and women aged 55–59. The age category-specific prevalence in age groups 60–74 were used to create the simulated population characteristics. A number of expected demographic differences were observed in the data: greater age was associated with lower levels of education, lower proportion of Hispanics, lower proportions in white-collar jobs, lower prevalence in high BMI categories, higher major limitations and minor limitations, and higher prevalence of chronic disease.
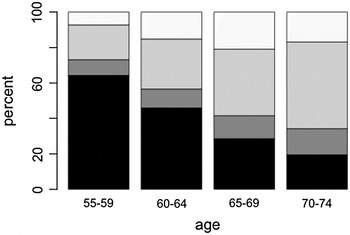
Figures 2 shows the composition of the HRS sample, 1992–2010, by age group, who are working, not working with major impairment, not working with minor impairment and not working with no impairment.
Working and impairment by age, Health and Retirement Study, 1992–2010.

As expected, with greater age the number of individuals working is lower, while the percentage that are not working with a minor impairment generally is higher. The percentage that are not working with a major impairment also is generally higher with greater age. In this age group there is also a slightly lower percentage that are not working but have no impairment. Whether or not minor limitations have an impact on being able to work will depend on the nature of the particular job requirements, while in most cases the experience of major limitations will make it difficult to work for pay. There are a very small number of individuals who are working with major and minor limitations, but these individuals are not delineated because by definition they have the capacity for work.
Predictors of work from gender-stratified prediction models
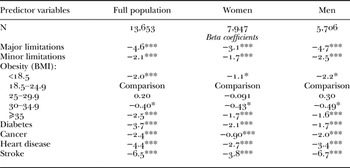
The beta coefficients of the relationship of each predictor variable with work among women and men are presented in Table 2.
Linear mixed-effect model coefficients of relationship to labour force participation among those aged 55–59 in the full population, Health and Retirement Study, 1992–2010

Notes : All coefficients are from separate models except for the coefficients for different levels of Body Mass Index (BMI). All models control for race (black, white, Latino, other), education (less than high school, high school degree, some college, four-year college degree), occupation (blue collar, white collar) and marital status. Models include a random effect term to account for multiple observations per individual over time.
Significance levels : * p < 0.05, *** p < 0.001.
The first column of data presents coefficients in the full population, the second column for women and the third column for men. In the full population and among women and men separately, there are strong and statistically significant (p < 0.05) predictors of work for major and minor limitations, BMI and chronic conditions.
Historical trends in major and minor disability
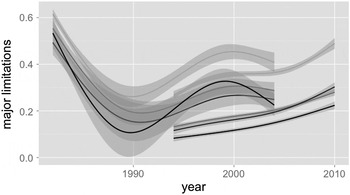
Figure 3 show historical trends in major limitations in the NLTCS and HRS. Trends are shown stratified by level of education.
Major limitations by level of education, National Long Term Care Survey (NLTCS), 1982–2004, and Health and Retirement Study (HRS), 1994–2010.

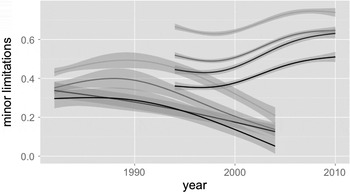
The trends from the NLTCS (the lines to the left of the plot running from 1982 to 2004) show the steep declines in major limitations from 1982 to 1990, and then an increasing trend from 1990 to 2004. Trends follow a similar pattern over time by level of education, with a potential trend towards a more recent decline among individuals with the highest level of education. The population with the lowest level of education consistently had the highest levels of major limitations over the entire period of the data. The more recent stable trends of major limitations can be seen in the HRS data (the lines to the right of the plot running from 1994 to 2010), with a recent potential slightly upward trend among individuals with the lowest levels of education. Despite the identical definition, levels of major limitations are slightly higher in the NLTCS study, likely due to the fact that the NLTCS includes individuals in long-term care facilities, while HRS did not specifically include these individuals in their baseline sample. Figure 4 presents data on minor limitations from the NLTCS (the lines to the left of the plot running from 1982 to 2004) and the HRS (the lines to the right of the plot running from 1994 to 2010). In contrast with major limitations, the NLTCS data show declining trends in minor limitations from 1984 to 2002, for all levels of education.
Minor limitations by level of education, National Long Term Care Survey (NLTCS), 1982–2004, and Health and Retirement Study (HRS), 1994–2010.

Again, levels are consistently higher for individuals with a low level of education. For the overlapping years 1994–2000, HRS data show declining trends, but after 2000, there are some minor increasing trends for all levels of education.
Projected work capacity: 2010–2050
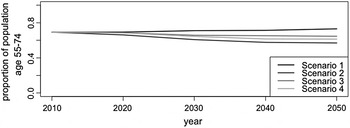
Figure 5 shows the projected proportion of the population of men and women with at least a high school diploma, aged 55–74, with the capacity to work from 2010 to 2050, plotted by scenario.
Projected work capacity, with high school diploma, 2010–2050.

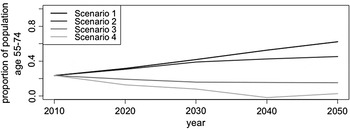
Scenarios 1 and 2 are long- and short-term trends, respectively, from HRS data, and scenarios 3 and 4 are long- and short-term trends, respectively, from NLTCS data. The consideration of the range of these trends, which is modest, shows a relatively stable future trend in capacity to work, around 70 per cent. Figure 6 shows the same projection, but for individuals with less than a high school diploma.
Projected work capacity, without high school diploma, 2010–2050.

Here, the trends are much more variable, depending on the scenario, with a range in 2050 from close to zero to around 60 per cent of the population. In the population with lower levels of education, future population capacity to work will depend greatly on the unclear trends in major and minor disability.
Discussion
Our findings suggest that chronic disease conditions and both major and minor limitations are important correlates of labour force participation. Applying these results to projected future populations out to the year 2050, we find important differences in the population capacity for work depending on level of education. Among individuals with a high school diploma, there is generally a high and consistent level of potential to work based on multiple scenarios of population trends in disability. However, we estimated that for populations with the lowest level of education, there are variable trends depending on the historical basis for projecting trends in major and minor disability. If less favourable trends continue among individuals with a lower level of education, we project that there could be low levels of capacity to work among individuals with low levels of education. These estimates are all based on the assumption that in our study population age 55–59 work capacity can be approximated by labour force participation.
Our findings on correlates of work were generally consistent with results from prior analyses using the first wave of HRS data, with disability and education among the strongest predictors of work (Cutler Reference Cutler2009). In contrast to these findings, however, we did not find a significant interaction between being black and level of disability for predicting labour force participation (data not shown). The fact that our models included a greater number of health outcomes and more recent waves of HRS may explain these differences in findings.
Using a different source of data and examining the population aged 62–64, Cutler, Meara and Richards-Shubik (Reference Cutler, Meara and Richards-Shubik2011) also found substantial work capacity, projecting that labour force participation could rise by 15 per cent. That is, that there is higher capacity for work in the population and that this capacity extended to ages 65 and above, similar to our findings (Cutler Reference Cutler2009). They also found a much lower capacity for work in individuals with lower levels of education. These results were similar to our findings. Thus, together with our results, this suggests that differences in capacity to work by education need to be addressed so that advantages of work in later life (for both economic and health reasons) can be fully and equitably taken advantage of by the full US population. Failure to act on this could result in increasing levels of economic and health inequality due to both lost wage earnings before retirement and lost social security benefits after retirement.
While this prior work took a similar approach to ours, other literature has addressed the question of influences on work capacity taking a different approach. This work used the mortality rate as a proxy for old age health, and examined the extent to which this was correlated with capacity to work in 12 Organisation for Economic Co-operation and Development countries (Milligan and Wise Reference Milligan and Wise2015). An additional paper taking this approach examined the relationship across cohorts in Belgium (Jousten and Lefebvre Reference Jousten and Lefebvre2015). These papers used employment rate as a proxy for work capacity. In contrast to our results, these studies found no relationship between health and capacity to work, although they did similarly find substantial work capacity in older ages beyond levels of employment. Reasons for differences in findings are that there are likely to be many other factors at the country level affecting level of work capacity, and that levels of mortality are not necessarily correlated with levels of physical health that most impact work capacity. For example, in our results we find major and minor limitations to be strong predictors of labour force participation, and the literature has shown that trends in these factors may be very independent of mortality (Crimmins and Beltran-Sanchez Reference Crimmins and Beltran-Sanchez2011; Crimmins, Hayward and Saito Reference Crimmins, Hayward and Saito1994). Another potential reason for differences in findings is that we used labour force participation rate and these analyses used unemployment rate. The primary contribution of our work beyond these papers is to use detailed individual health measures along with extensive demographic data on estimated future population structure in order to project future work capacity both in aggregate and by level of education.
Although our data are from the USA, our findings have important implications beyond the USA because many other liberal welfare states are undergoing analogous processes of demographic shifts associated with an ageing population that may impact population labour force participation (Ilmarinen Reference Ilmarinen2001). Most of these studies have taken a similar approach to ours, examining the relationship between work, health and socio-demographic factors with labour force participation and work capacity using logistic regression models. For one of the key demographic trends driving the model, changes in functional limitations over time, a number of studies in Europe have identified similar ranges of trends as those we identified in the USA (Audureau, Rican and Coste Reference Audureau, Rican and Coste2013; Espelt et al. Reference Espelt, Font-Ribera, Rodriguez-Sanz, Artazcoz, Ferrando, Plaza and Borrell2010; Palacios-Ceña et al. Reference Palacios-Ceña, Jiménez-García, Hernández-Barrera, Alonso-Blanco, Carrasco-Garrido and Fernández-de-las-Peñas2012; van Gool et al. Reference van Gool, Picavet, Deeg, de Klerk, Nusselder, van Boxtel, Wong and Hoeymans2011; Werngren-Elgström, Carlsson and Iwarsson Reference Werngren-Elgström, Carlsson and Iwarsson2008; Zunzunegui et al. Reference Zunzunegui, Nunez, Durban, de Yébenes and Otero2006), further supporting the applicability of our model to Europe. In addition, studies using UK data have found similarly large impacts of disability on labour force participation (Kidd, Sloane and Ferko Reference Kidd, Sloane and Ferko2000). In terms of population impact, workers aged 50 and older will be an even larger proportion of the workforce in Europe than in the USA (Ilmarinen Reference Ilmarinen2001).
The difficulty of projecting population characteristics into the future is well known (Lee Reference Lee2004), and our projections of predictors of work rely on the continuation of current historical trends. There are age, period and cohort effects that may result in currently young workers deviating from the current age trends that are inherent in our model. Even moderate deviation from historical trends of any of our predictors could change the outcomes of our models meaningfully. The strength of our approach is the use of actual population data as a basis for a projection model for an outcome that is correlated with a large number of factors, and using plausible scenarios from two different sources of data when future disability trends are unclear. Apart from trends in disability, one of the most potentially impactful changes on the available future workforce is changes in immigration (Bermingham Reference Bermingham2001). Our estimates of the US population are based on Social Security Panel estimates of population growth that includes estimates specific to each major racial and ethnic groups, including Latinos. While these are the best available, historical trends in immigration have not been constant (Borjas and Katz Reference Borjas, Katz and Borjas2007), and unforeseen fluctuations would have a large impact on the size of the potential workforce. A further influential force on the future trends in capacity to work is technology and the physical structures of work that impact the capacity of individuals with functional limitations to complete work-related tasks. Detrimental impacts of physical and mobility limitations on capacity to work are currently mitigated by use of online technologies (allowing work from home) and changes to the environment (elevators and ramps to allow access previously prevented by stairs). Further future environmental and personal technology changes could allow a greater future workforce. Stagnation or reversion of environmental and technology trends could diminish it. It is very important to emphasise that our current estimates are based on a continuation of current trends of work types.
We base our estimates on parameters from multivariate regression models, and these estimates are not likely to be causal because our models may lack variables that are prior common causes (i.e. confounders) of exposures and outcome (Rothman, Greenland and Lash Reference Rothman, Greenland and Lash2008) and are not completely free of measurement error. Potential confounders may include personality characteristics that lead to both preferences for work and functional limitations (Barrick and Mount Reference Barrick and Mount1991; Borghans et al. Reference Borghans, Duckworth, Heckman and Ter Weel2008; Duberstein et al. Reference Duberstein, Sörensen, Lyness, King, Conwell, Seidlitz and Caine2003; Miller, Campbell and Pilkonis Reference Miller, Campbell and Pilkonis2007), or even genetic factors with yet to be determined pleiotropy (Jack, Reed and Guralnik Reference Jack, Reed and Guralnik2000). In addition, it is unknown whether the relationship between these predictors and work will remain fixed over time, an implicit assumption of our models. We used the best available data and models in the absence of causal estimates from randomised trials or instrumental variable analyses of predictors of work. Our modelling approach is similar to that used previously to predict trends in functional limitations based on changes in levels of education (Freedman and Martin Reference Freedman and Martin1999).
A key assumption of our approach, which allows us to estimate capacity to work in the population aged 60–74, both currently and in the future, is that the factors correlated with work are the same in this population as they are in the population aged 55–59. Our estimates are therefore best understood as a possible scenario of population capacity to work with a high level of individual preference for work, although this could be influenced by social change and economic incentives. In addition, population work capacity will be impacted by changes in the nature of work. For example, changes in the physical requirements of jobs that allow individuals with minor functional limitations to continue to work will impact the capacity for work.
It is a limitation of our analysis that some individuals with work capacity may not be in the labour force due to individual preference for work. We hypothesised that within the context of the US social welfare system, the ability to exercise this preference is limited to people with at least some level of financial assets, as without work they would not be able to meet basic living expenses. We thus performed a sensitivity analysis to estimate the strength of predictors of labour force participation only among individuals with household assets of less than US $50,000, where labour force participation is more likely to be required. We found no meaningful differences in estimated coefficients as compared to the overall sample, consistent with labour force participation being a reasonable approximation of work capacity in this population. Nevertheless, this remains an important limitation when interpreting our findings.
Despite these limitations, the majority of which are inherent to any population projection, our results allow for more informed policies with respect to the future workforce of the USA and more generally for market economies with ageing populations. Our results suggest that there is a reasonable possibility, given past trends, that there will be a substantial number of individuals in the population without the capacity for work at older ages. If the current stagnation of disability continues, or if the decreases in disability in the recent past are reversed by 2050, we could have fewer individuals with the capacity to work than there is potential for work. This lack of capacity for work is greatest in the population with the lowest level of education. One implication for policy is that their needs to be direct attention to decreasing levels of major and minor functional limitations as individuals grow older. Interventions include programmes to increase physical strength (Chandler et al. Reference Chandler, Duncan, Kochersberger and Studenski1998) and multicomponent in-home physical therapy (Gitlin et al. Reference Gitlin, Winter, Dennis, Corcoran, Schinfeld and Hauck2006). While the literature suggests that immediate interventions have an impact (Beswick et al. Reference Beswick, Rees, Dieppe, Ayis, Gooberman-Hill, Horwood and Ebrahim2008), policies that offer benefits across the lifecourse, including higher levels of education, are most likely to be of greatest benefit (Gravseth et al. Reference Gravseth, Bjerkedal, Irgens, Aalen, Selmer and Kristensen2007). The second potential policy to address this is changes in work environments that would allow individuals with certain types of functional limitations to remain in the workforce. That is, our current projections are based on the current relationship between functional limitations and being in the workforce – if those relationships could be altered work capacity could increase. A number of studies suggest that specific adaptations of work environments can allow many individuals to return to work, or continue to keep working despite some increases in functional limitations (Franche et al. Reference Franche, Cullen, Clarke, Irvin, Sinclair and Frank2005). In both of these policy opportunities, our work suggests that the greatest need is for action among individuals with lower levels of education. While our study cannot determine whether changing levels of education could have a role, it suggests that policies that have the greatest impact on individuals with a lower level of education will have the biggest impact on improving the population capacity to work.
Acknowledgements
The study was determined to be exempt from human subjects research review by the Stanford University Committee on human subjects research. All authors have made substantial contributions to the paper in the conception and design of the study and the drafting of the article. All authors approve the current version of the paper. The authors have no conflict of interest to report.