


INTRODUCTION
There are numerous attributes of infant-directed speech (IDS) that differentiate it from adult-directed speech (ADS). A notable feature of IDS is its prosody, which is characterized by a higher mean fundamental frequency, wider pitch range, and slower overall rate of speech (Fernald & Simon, Reference Fernald and Simon1984). Mothers have also been noted to use more dramatic changes in pitch and loudness (Soderstrom, Blossom, Foygel & Morgan, Reference Soderstrom, Blossom, Foygel and Morgan2008) and to prolong the duration of words (Bernstein Ratner, Reference Bernstein Ratner1986) in order to emphasize clause boundaries, making individual syntactic units more obvious and recognizable. Changes in pitch and loudness also occur more often and with a more consistent pattern in IDS when new words are introduced (Fernald & Mazzie, Reference Fernald and Mazzie1991).
There has recently been a resurgence in interest in the acoustic properties of IDS, particularly at the segmental level. ADS tends to be severely under-articulated (Pollack & Pickett, Reference Pollack and Pickett1964), forcing the mature listener to utilize situational, lexical, and syntactic skills to resolve phonetic ambiguity (Lindblom, Reference Lindblom, Hardcastle and Marchal1990). Younger listeners, however, have limited knowledge of potential lexical candidates or grammatical structure, creating a potential “Catch-22” – to decode the speech signal requires linguistic knowledge an early learner does not have access to. Thus, it has been suggested (although inconsistently documented) that adults speak more clearly to infants, making phonetic segments longer and more distinct, a profile some have termed “hyperspeech” (e.g. Fernald, Reference Fernald2000; Cristia, Reference Cristia2013). The distinction between IDS and ADS has also been likened to that between conversational speech and clear speech, a register commonly used in noisy environments or with hearing-impaired or non-native-speaking individuals to improve listener comprehension (Ferguson & Kewley-Port, Reference Ferguson and Kewley-Port2007).
However, despite a growing number of investigations of the phonetic properties of the IDS register (see Cristia, Reference Cristia2013, for partial summary), there is lack of general consensus about its relative acoustic clarity. For consonants, Cristia (Reference Cristia2010) found clarification in the sibilants /s/ and /∫/ in IDS compared to ADS, with greater differentiation between consonant sounds to 12–14-month-olds than to 4–6-month-olds. Mothers have also shown greater voice-onset time (VOT) for initial voiceless stops in IDS compared to ADS when their infants are between the one- and two-word stages of language production (Malsheen, Reference Malsheen, Yeni-Komshian, Kavanagh and Ferguson1980).
Some research has come to similar conclusions when comparing vowel space in IDS and ADS. Infants are sensitive to vowel features relatively early in life; lexical recognition (of the child's own name) appears to be impaired by vowel mispronunciation more than by consonant misarticulation at 5 months of age (Bouchon, Floccia, Fux, Adda-Decker & Nazzi, Reference Bouchon, Floccia, Fux, Adda-Decker and Nazzi2015). Thus, it would be reasonable to expect adults to clarify vowels when speaking to young language-learners. In an early report, Bernstein Ratner (Reference Bernstein Ratner1984) studied nine mother–child dyads longitudinally, at pre-verbal, one-word, and multi-word stages of development. Findings revealed similar vowel space and precision across ADS and IDS at the pre-lingual stage, but larger vowel space with fewer overlapping vowel categories in speech to infants at the one-word stage. The most exaggerated vowel space occurred in both content and function words used in IDS with the oldest group of children, who were combining words.
Kuhl et al. (Reference Kuhl, Andruski, Chistovich, Chistovich, Kozhevnikova, Ryskina, Stolyarova, Sundberg and Lacerda1997) found that English-, Swedish- and Russian-speaking mothers of 2- to 5-month-old infants appeared to clarify vowels in their IDS relative to their ADS, expanding the point vowel space by an average of about 90%. Liu, Kuhl, and Tsao (Reference Liu, Kuhl and Tsao2003) extended these findings to Mandarin, finding expanded vowel space area in IDS to 6–8- and 10–12-month-olds. Xu, Burnham, Kitamura, and Vollmer-Conna (Reference Xu Rattanasone, Burnham and Reilly2013) found expanded vowel space in IDS addressed to 6-month-old infants. Wieland, Burnham, Kondaurova, Bergeson, and Dilley (Reference Burnham, Wieland, Kondaurova, McAuley, Bergeson and Dilley2015) found vowel space to be larger and targets more dispersed in IDS addressed to children from roughly 3–18 months than in their mothers’ ADS. Wang, Seidl, and Cristia (Reference Wang, Seidl and Cristia2015) found increased “peripherality” (enlarged vowel space) in IDS to 4- and 11-month-old children. Liu, Tsao, and Kuhl (Reference Liu, Tsao and Kuhl2009) found that mothers continue to clarify and elongate their vowels to children five years of age, although “acoustic exaggeration” in child-directed speech (CDS) was less than that seen at 7–12 months of age.
But other studies have not found vowel clarification in IDS when contrasted with ADS. In Norwegian IDS, six mothers of infants aged 0–0;6 used vowel space that was the same as or smaller as that in their speech to adults (Englund & Behne, Reference Englund and Behne2006). Xu Rattanasone, Burnham, and Reilly (Reference Xu Rattanasone, Burnham and Reilly2013) found tone but not vowel hyperarticulation in Cantonese IDS at 0;3, 0;6, 0;9, and 1;0. If distinctive, non-overlapping vowel space is a criterion for vowel clarity, Gurindji Kriol IDS likewise does not appear to be characterized by more precise vowel articulation (Jones, Meakins & Muawiyath, Reference Jones, Meakins and Muawiyath2012), since it collapses distinctions among five target vowels to only three evident categories. Similarly, Burnham, Wieland, Kondaurova, McAuley, Bergeson, and Dilley (Reference Burnham, Wieland, Kondaurova, McAuley, Bergeson and Dilley2015), using a book-reading design, found no real changes in IDS vowel quality over the first two years of life. Lahey and Ernestus (Reference Lahey and Ernestus2014) reported articulatory reduction in two frequent words addressed to 0;11-1;0 children, compared to their features in ADS. Similarly, Martin et al. (Reference Martin, Schatz, Versteegh, Miyazawa, Mazuka, Dupoux and Cristia2015) found infant-directed speech to 18- to 24-month-old addressees to be less clarified than ADS when close phonemic contrasts in Japanese (both vowels and consonants) were examined. These last two findings are consistent with an older report by Bard and Anderson (Reference Bard and Anderson1983) that excised words from IDS addressed to children roughly two to three years of age were less intelligible than tokens taken from ADS.
It has been speculated that age, linguistic maturity, or other listener-specific variables may account for differences seen among studies. Other than the general (but not universal) finding that distinctiveness of vowel articulation may diminish as child addressees get older, a few studies have directly examined the hypothesis that presumed linguistic competence and listener need determine the use of a hyperarticulation register. For example, Xu et al. (Reference Xu, Burnham, Kitamura and Vollmer-Conna2013) compared vowel articulation in ADS, IDS, and dog- as well as parrot-directed speech. IDS was characterized by the most clarification, and ADS and dog-addressed speech the least, with parrots, presumed to have some degree of linguistic competence, receiving vowels less clarified than seen in IDS, but more clarified than when adults spoke to other adults or a dog. The authors speculate that “linguistic potential” is a determinant of hyperarticulation, in addition to listener feedback. Providing an infant listener with a maximally informative signal would seem to be a reasonable motivator for hyperarticulation. Attempts to examine this hypothesis, either naturalistically or experimentally, have also produced inconsistent results. For example, Lam and Kitamura (Reference Lam and Kitamura2010) found that a mother's speech to her normal hearing twin infant was characterized by clearer articulation than her speech to its hearing-impaired sibling. Similarly, Lam and Kitamura (Reference Lam and Kitamura2012) found that mothers’ vowel space was maximally distinct when they believed that their child could hear them well, when compared to speech produced when they were told that the infant could not hear them well. These findings raise the potential that parents might clarify speech only to those listeners who they feel might actually hear such clarification, rather than trying to clarify speech to a listener with special processing challenges (as has been found in the clear speech register to older listeners with hearing loss). In contrast to Lam and Kitamura's findings, Wieland et al. (Reference Wieland, Burnham, Kondaurova, Bergeson and Dilley2015) found that mothers expanded vowel space fairly equally to infants with and without hearing loss. Taken together, it is still not clear whether there are general tendencies for vowel clarification in IDS, or reliable predictors of its change over time or language development.
Do the acoustical properties of IDS influence later language skills?
A more crucial question, we believe, is whether the acoustical characteristics of IDS serve a functional purpose. It is of both practical as well as theoretical interest to explore possible impacts of adults’ speech modifications on children's developing language skills, particularly if adults do not appear to spontaneously modify articulation when a child may have a special need for more distinctly articulated input (Wieland et al., Reference Wieland, Burnham, Kondaurova, Bergeson and Dilley2015).
Some data suggest an indirect avenue by which the acoustic signal in IDS could impact child language learning. Researchers agree that IDS is more successful than ADS in getting and maintaining the attention of infants in communication-based activities (Fernald, Reference Fernald1985; Cooper, Abraham, Berman & Staska, Reference Cooper, Abraham, Berman and Staska1997), and some evidence has emerged to suggest that IDS tangibly benefits infants. Thiessen, Hill, and Saffran (Reference Thiessen, Hill and Saffran2005) created two versions of an artificial language; one set employed the prosodic characteristics of IDS and the other was spoken in an ADS register. Results showed that infants were able to discriminate legal words from illegally formed words when exposed to IDS, but not after hearing ADS, suggesting that the acoustic characteristics of IDS may actually help infants discover new word boundaries. Singh, Nestor, Parikh, and Yull (Reference Singh, Nestor, Parikh and Yull2009) found that a large cohort of 7·5-month-old infants listened longer to passages containing words that were familiarized in IDS than those familiarized in ADS. Thus, infants appear to learn new words better in IDS, and similar effects have been found for toddlers (Ma, Golinkoff, Houston & Hirsh-Pasek, Reference Ma, Golinkoff, Houston and Hirsh-Pasek2011).
Changes in IDS vowel space have also been linked to infants’ speech discrimination abilities. Liu, Kuhl, and Tsao (Reference Liu, Kuhl and Tsao2003) found that infants scored much higher on speech discrimination tasks when their mothers had larger vowel spaces, suggesting that the acoustic characteristics of IDS can influence some basic aspects of communicative development. Song, Demuth, and Morgan (Reference Song, Demuth and Morgan2010) found that 19-month-old infants were approximately 500 ms faster to look at a target object when they listened to IDS characterized by vowel space characteristics identical to those in Liu et al. (Reference Liu, Kuhl and Tsao2003). Infants showed slowed response times when words were delivered in ADS. Both studies suggest that vowel clarification in IDS helps to facilitate infants’ word recognition.
Despite these promising results, far less is known about how IDS might encourage subsequent language learning, or long-term encoding of information (rather than experimental performance). Nor is much known about whether IDS fine-tuning to infants of different ages might have differential impacts on acquisition.
Thus, given the heterogeneous findings of past studies that have examined acoustical properties of the IDS register, and the paucity of research linking features of IDS to differential outcomes in children's language development, we asked the following questions:
-
1. Are vowels produced more clearly in IDS than ADS, and do patterns of vowel clarification change over the course of infant development?
-
2. Do children exposed to clearer vowel articulation in IDS demonstrate better early language outcomes than children whose mothers’ vowel articulation is less clear?
METHOD
Participants
Participants were mother–infant dyads who were part of a larger longitudinal study at the University of Maryland. All mothers and their infants were native English-speakers, and all infants had been born within three weeks of their due dates and had not been previously diagnosed with developmental disorders or delays. Each dyad reported to the University of Maryland for visits when the child was 0;7, 0;10, 0;11, 1;6, and 2;0, but the data for the present study were only selected from their visits at 0;10–11, 1;6, and 2;0.
Initially, thirty-five mother–infant dyads had been chosen for this study because they had completed all of their visits. Ten dyads were later excluded because they did not meet the criterion for the minimum number of matched tokens (criterion explained under ‘Acoustic data selection procedure’), or because of distortions in the mothers’ speech or noise that made the required minimum number of tokens acoustically un-analyzable. An additional ten mothers provided sufficient tokens for a function word articulation analysis (not reported here), but not sufficient content words, and were also excluded. After the exclusions, fifteen mother–infant dyads were included in this study.
IDS and ADS speech samples
Vowels used in acoustic analyses were extracted from audio-recordings of unstructured play sessions between mothers and infants, using a large standard set of toys, and subsequent interviews between the mothers and an experimenter. Play sessions between mother–child dyads and adult interviews between the mother and an experimenter were recorded at each visit. We were unable to find sufficient matches across all ages within parent–child dyads and so excluded speech in the 0;7 condition. The 0;10 and 0;11 recordings were considered equal in terms of child language stage, so target vowels from both ages were combined together for acoustic analysis. Tokens for each of the three target vowels (/i/, /ɑ/, /u/) were first selected from the 0;11 play sessions, and if there were not enough to meet criteria (fewer than 4), additional tokens were taken from the 0;10 play session. All adult-addressed recordings, taken at each visit, were also considered equal.
Tokens were elicited in each of the play sessions by providing the mothers with a broad variety of toys whose names contained one of the target vowels. Experimenters instructed each mother to play with her child as she did at home for approximately 15 minutes, and did not reveal that maternal speech was one focus of the main study. Following the play session, a research assistant interviewed each mother about their play preferences in an attempt to obtain an ADS sample that contained some of the same tokens that were present in the mother's speech to her child. Mothers wore an Audio Technica Lavalier microphone during each interaction, and each speech sample was recorded as an uncompressed WAV file using a Marantz PMD660 Professional Portable Digital Recorder at a sampling rate of 44·1 kHz. Mothers were debriefed at study termination and offered the option to decline their data for analysis. None chose to decline participation in this aspect of the study design.
Transcription methods
Each sound file was orthographically transcribed using Sonic CHAT (MacWhinney, Reference MacWhinney2015). Sonic mode allows audio to be linked to every line of transcription, which makes it easier to locate and extract words for acoustic analysis, using the program's direct export function to Praat (Boersma & Weenink, Reference Boersma and Weenink2015).
Acoustic data selection procedure
Following transcription, a frequency count of all of the content words spoken by each mother was used to identify potential target words in the transcripts that contained each of the point vowels. We selected content (open-class) words for analysis because function words tend to be characterized by shorter durations and reduced vowel space (Bell, Brenier, Gregory, Girand & Jurafsky, Reference Bell, Brenier, Gregory, Girand and Jurafsky2009). Words containing a target vowel that carried stress in the first syllable of the word were selected for analysis (e.g. beaver, sushi, doctor, etc.) and grouped by vowel category. Only mothers who had at least four tokens in each vowel category were included from the larger cohort of parents. An attempt was made to match tokens across addressee conditions within each participant according to phonetic environment, because the consonants surrounding a vowel have been shown to influence its formant frequency values (Stevens & House, Reference Stevens and House1963). We considered matched phonetic environments to be words in which the target vowel was surrounded by the same classes of phonemes. For example, ball could be matched with doll, and shoe could be matched with zoo. Word families (i.e. see, seeing, sees) were also used interchangeably. Each individual participant had a matched set of tokens that shared the same word root or number of syllables within vowel categories that were used for acoustic analysis. However, we allowed for an uneven number of matched tokens within and across vowel categories, with a minimum of four but top limit of ten, in an effort to collect the maximum number of tokens for each vowel. Words were plotted in separate vowel triangles to compare vowel space and vowel variability across each listener group.
Acoustic analysis
Praat was used to acoustically analyze each token. CLAN permits tagged utterances to be exported directly to Praat. Using the derived spectrogram and auditory signal, the vowel was isolated from the word. After visual inspection of the spectrogram, frequency values for the first and second formants (F1 and F2) for each target vowel were collected at the midpoint of the steady-state of the vowel. Praat was set to identify formants using a 50-ms Gaussian window over the range from 0 to 5500 Hz with a +6 dB/octave pre-emphasis. If a vowel was located next to a glide or a liquid, formants were measured at the midpoint of the steady state portion of the target vowel that was located farthest away from where formant met consonant. Rounded productions of /u/ that began as an /i/ and ended as a /u/ were measured at the end of the vowel when there was a steady state that was more typical of /u/ frequency values (the word you was always excluded because coarticulation made it likely that the /u/ would be realized as a rounded /i/). Tokens were excluded if the acoustic signal was disrupted or degraded by ambient noise or overlapping speech, if the vowel was too short to identify a steady state, or if clear formants were not present due to whispered speech or glottal fry. Praat was also used to measure the vowel durations of each token. Once a vowel was isolated from the token word that contained it, the duration was measured to the nearest thousandth of a second.
After selection of F1 and F2 values for each token, an R script (R Development Core Team, 2008) was used to plot the area of the vowel triangle that resulted from mapping the full vowel space. This program calculated the variability for each vowel as well by obtaining the standard deviations of F1 and F2 for each vowel category and inserting them into the following formula: pi*2sdF1*2sdF2. The resulting measure represented the general spread of tokens within a particular vowel category. To get an overall measure of vowel variability, the measures for each vowel category were then averaged for each participant in each addressee condition.
We took three summary measures of mothers’ vowel productions:
-
1. Vowel space. Following procedures used by Liu et al. (Reference Liu, Kuhl and Tsao2003), we defined vowel space as the area of the vowel triangle created by the means of formants 1 and 2 for the ‘point vowels’ (i.e. /i/, /ɑ/, and /u/); space was calculated using the same formula used by Liu et al.:
Vowel space area = ABS{[F1i*(F2ɑ − F2u) + F1ɑ*(F2u − F2i) + F1u*(F2i − F2ɑ)]/2}
where ‘ABS’ is the absolute value, ‘F1i’ is the F1 value of the vowel /i/, ‘F2ɑ’ refers to the F2 value of vowel /ɑ/,Footnote 1 etc. Maximally distinct vowels should have mean F1 values that are low for /i/ and /u/, and higher for /ɑ/; maximally distinct F2 values should be high for /i/ and /ɑ/, and low for /u/. In contrast, less distinct vowels should be characterized by centralization of F1 and F2 formant frequencies, characteristic of reduced vowels such as schwa.
-
2. Vowel duration was defined as the mean of the average durations for the three point vowels. We made the assumption that longer vowel duration assists the infant in mapping the vowel formant properties.
-
3. Vowel variability. This measure essentially asked how large the vowel space was for a particular vowel. The variability measure for each of the point vowel categories was calculated by obtaining the standard deviations of F1 and F2 for each vowel category and inserting them into the formula referenced earlier. This resulted in the area of an ellipse in F1/F2 space that encloses the majority of productions of a target vowel. This is an indication of the amount of variance that existed in that category; large ellipses suggest variability in the speaker's approximations of a target vowel, while smaller ones suggest that the speaker uses a constrained set of F1/F2 values in producing a vowel target. Values for all three point vowels were averaged together to create a measure of ‘vowel variability’ for each mother in each speaking condition.
Child language outcome measures
Child language outcome measures at 2;0 included the standard score on the Expressive One Word Vocabulary Test (EOWVT) (Martin & Brownell, Reference Martin and Brownell2010) and the Peabody Picture Vocabulary Test (PPVT) (Dunn & Dunn, Reference Dunn and Dunn2007 Footnote 2 ) raw score. Mothers also completed the MacArthur-Bates Communicative Development Inventory (MCDI) (Fenson et al., Reference Fenson, Dale, Reznick, Thal, Bates, Hartung, Pethick and Reilly1993), a parent report of the child's total estimated expressive vocabulary. Children's language was also appraised during free play. However, we confined our analyses reported here to three norm-referenced vocabulary measures: two objective measures of expressive and receptive one-word vocabulary, and one parent report measure of attempted vocabulary. While language samples could yield any number of grammatical indices, we had no a priori hypothesis as to which might show benefits of clearer maternal vowel articulation. We hypothesized that clearer articulation would be most helpful in mapping to lexical referents in the child's environment.
Reliability
To determine inter-rater reliability for the acoustic analyses, a proportion of the tokens were reanalyzed by a second researcher. To accomplish this, every tenth token from each transcript utilized in the study was selected for reanalysis. This resulted in a total of 360 (roughly 10·6%) of the tokens measured twice. Reliability was calculated with Pearson correlation coefficients between each rater's values for F1, F2, and vowel duration. All measures were significantly correlated across raters, and substantial levels of inter-rater reliability were observed between measures of vowel duration and F1 values (r(vowel duration) = 0·853; r(F1) = ·85; r(F2) = 0·657, all p <.0001). The inter-rater reliability between measures of F2 values was lowest, but still considered to be acceptable (Multon, Reference Multon and Salkind2010). Statistics were computed using NCSS (8th edition; <www.ncss.com>). Vowel plots and ellipses were generated from an R script.
RESULTS
Vowel clarity summary data
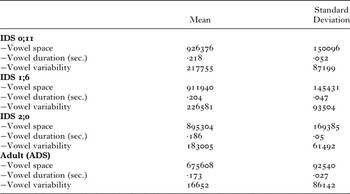
Vowels were analyzed in four conditions (IDS at 0;11, IDS at 1;6, IDS at 2;0, and ADS). We analyzed an average of 30 tokens per speaker/condition. Mean values for vowel duration and vowel variability were calculated for each vowel and then averaged across point vowels. Descriptive statistics for vowel clarity measures are shown in Table 1. A full table of mean values for vowel measurements and outcome measures by mother–child dyad is provided as supplementary material in the ‘Appendix’ (available at <http://dx.doi.org/10.1017/S0305000916000520>).
Descriptive statistics of mothers’ vowel features by addressee

Comparison among vowel clarity measures
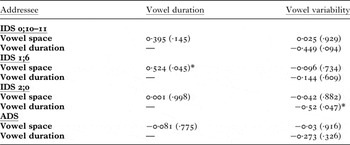
We next explored if correlations existed among acoustic measures of vowel clarity. Pearson product–moment correlations were used to determine the level of relationship among the acoustic measures of vowel space, vowel duration, and vowel variability (see Table 2). This analysis revealed a significant positive relationship between vowel space and vowel duration in words addressed to infants aged 1;6 (r(13) = 0·524, p < ·05); as vowel length increased, vowel space became larger in IDS to 18-month-old toddlers. However, this relationship was not observed in any other addressee condition. A significant negative relationship was observed between vowel duration and vowel variability in words addressed to children at 2;0 (r(13) = –0·52, p < ·05), indicating that, as vowel duration increased, vowel variability decreased. Although correlations between duration and variability did not reach significance in any other conditions, there was a fairly consistent negative trend throughout the data between duration and variability, such that, as duration increased, variability decreased across different listener conditions, likely as a function of more time available to reach target vowel formants. There was no statistically significant relationship between vowel space and vowel variability at any age.
Correlations (p) among different measures of vowel clarity

note: * p < ·05.
Vowel clarity measures by addressee
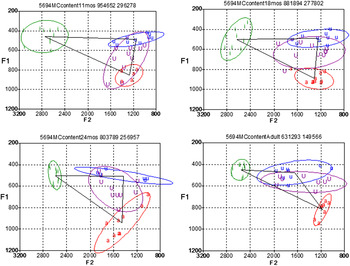
After establishing relationships among purely acoustic measures within groups of addressees, we used a Kruskal–Wallis test for each of the vowel clarity measures across all listener groups to identify how listener groups differed from one another in terms of the quality of vowels addressed to them. Because we were now examining relationships among variables with unknown homogeneity of variance (acoustic measures vs. child age), we utilized non-parametric measures for this analysis. ADS was found to be characterized by a significant difference in vowel space compared to each individual IDS condition (F = 11·7, p < ·001). This finding supports a visual analysis of all of the vowel plots, in which 14 out of the 15 mothers demonstrated a smaller vowel space in the ADS condition compared to all of the IDS conditions (see Figure 1 for a representative pattern of vowel clarification). We also found a significant difference in vowel duration between IDS at 0;11 and ADS (F = 2·84, p = ·046). Although vowel duration decreased consistently across the different time-points, large variances contributed to a lack of significant findings at intermediate age-points.
Example of a mother who exhibited vowel space enlargement in IDS at three ages (top left: 0;11; top right: 1;6; bottom left: 2;0) compared to ADS (bottom right).

There was no main effect of addressee on vowel variability (F = 1·76, p = ·166). The areas of the ellipses surrounding each vowel category did not differ significantly by addressee. Additionally, there were no significant differences found across IDS conditions for any hypothetical measure of vowel clarity (vowel space, duration, variability). Thus, there was a general pattern of vowel clarification in IDS when contrasted with ADS, but there does not appear to be a single age-point (at least in these data) at which mothers exhibit a heightened level of vowel clarification in their speech that is significantly different from the signal they provide at other stages in their child's language development.
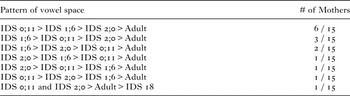
A visual inspection of vowel plots revealed a number of different trends, some linear and some non-linear, the most prominent one being the shrinkage of vowel space over time (see Figure 1). In other words, the older the listener, the more compressed the vowel space. A summary of these trends can be found in Table 3.
Vowel space changes by addressee

Despite the fact that differences among IDS conditions were not significant, there appears to be a general pattern of a reduction in vowel space across listener age, contrary to our initial predictions. Overlapping ellipses between point vowels (which should indicate a less clear distinction between neighboring vowels) were also noted in eight out of the fifteen mothers’ vowel plots for at least one age/listener; this occurred four times in IDS at 0;11, three times each in IDS at 1;6 and 2;0, and twice in ADS. However, at each age group, only a minority of mothers showed obvious overlap among vowel space characteristics when speaking to their young children. Moreover, the general reduction of vowel space with listener age did not (apparently) lead to greater degrees of point vowel overlap.
Relationship between IDS vowel clarity and 2;0 language outcomes
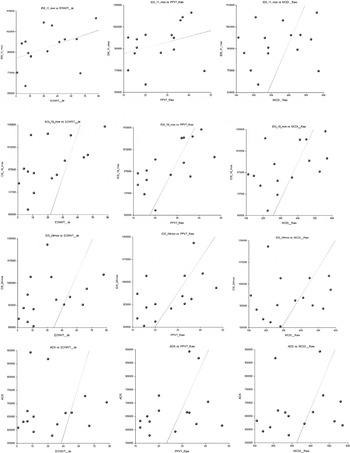
The large number of potential vowel quality measures, age-points and outcome measures made formal correlational analysis inadvisable. We inspected scatterplots to appraise potential patterns worthy of further investigation. The most obvious trend was that vowel space measures appeared positively related to child language outcomes in all IDS conditions, although weakly so when children were 0;10–11, or as a function of the mothers’ typical vowel space when speaking to an adult (see Figure 2). Vowel articulation variability appeared to display the opposite relationship, producing primarily weak but negative correlations across the board among all IDS registers (but not the mothers’ typical ADS) and all language outcomes. In other words, the larger the variability in maternal vowel articulation, the lower the child's scores were at 2;0 on the three language outcome measures. No obvious trends were observed between vowel duration and any child language outcome measures.
Scatter plots of maternal vowel space averages and toddler language outcomes. Rows (top to bottom) = IDS 0;10-0;11, IDS 1;6, IDS 2;0, and ADS. Columns (left to right) = EOWVT percentile, Peabody Raw Score, MCDI Raw score.

Group comparison of 24-month language outcomes
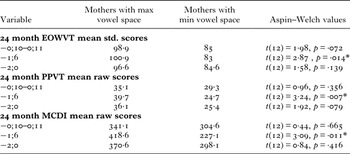
Given the relatively small number of subjects in this study, to formally gauge the potential impact of maternal vowel clarification on child language outcomes, we employed a group analysis. Mothers were divided into ‘maximum’ and ‘minimal’ vowel clarification groups. Mothers were ranked based on the area of their overall vowel space in each IDS condition; the participants with the seven highest vowel space measures were labeled as ‘max vowel space’ mothers, while the participants with the seven lowest vowel space measures were labeled as ‘min vowel space’ mothers. (The mother with the median vowel space was excluded from analysis.) This process was repeated in each IDS condition, because some mothers exhibited an enlarged vowel space at one age and not others. For all comparisons, assumptions about homogeneity of variance were met, and therefore an equal-variance t-test score was computed. Average group language outcome scores and statistical results are reported in Table 4.
Maternal vowel space and child language outcomes

note: * Bonferroni-adjusted alpha p < ·017.
Results show that the children who were exposed to a larger vowel space at 1;6 had language outcomes across all three assessments that were significantly higher than the scores of children whose mothers exhibited a smaller vowel space in child-directed speech, even after Bonferroni adjustment. Receptive vocabulary advantage (PPVT) for the children whose mothers utilized larger vowel space was roughly 15 points; expressive vocabulary advantage on the EOWVT was 18 points, and parent-reported advantage on the MCDI was almost 200 attempted vocabulary words. The children who received relatively clarified speech input from their mothers consistently outperformed the group receiving less clarified speech on all three language assessment measures at all time periods in comparisons based on vowel space characteristics, even when such differences did not reach statistical significance.
DISCUSSION
The purpose of the present study was to identify and compare longitudinal patterns in maternal IDS vowel clarification across three different measures of vowel clarity: vowel space, vowel duration, and vowel variability. More importantly, we also sought to determine whether any measures of maternal vowel clarity relate to children's expressive and receptive language outcomes at 2;0. Analyses of ADS and IDS at 0;10–11, 1;6, and 2;0 yielded several findings that further inform previously gathered data on the subject of maternal speech clarity.
We predicted that mothers would exhibit larger vowel space, longer vowel durations, and increased vowel variability in IDS than in ADS. This hypothesis was generally supported: measurements of vowel space and vowel duration followed the predicted trend. Vowel space was significantly greater in IDS than ADS. When compared to ADS, words in IDS are characterized by vowel space expansion and longer vowel duration. However, variability was larger in IDS than ADS. Indeed, if mothers selectively overarticulate, or emphasize some words in utterances rather than others, to get the child's attention or highlight new vocabulary, we may expect to see more variability in IDS than ADS, in general. Overall, the mothers in this study did appear to ‘clarify’ their speech when addressing their language-learning children.
Given some past research on vowel articulation in IDS (e.g. Bernstein Ratner, Reference Bernstein Ratner1984; Xu, Burnham, Kitamura & Vollmer-Conna, Reference Xu, Burnham, Kitamura and Vollmer-Conna2013; Wieland et al., Reference Wieland, Burnham, Kondaurova, Bergeson and Dilley2015), we expected to see a trend of increasing vowel clarification across IDS conditions as the child grew older and developed more language skills, but measures of vowel clarity did not significantly differ by IDS stage. However, for approximately half of the participants, the younger the listener, the larger the maternal vowel space they were exposed to in IDS.
These results are in partial agreement with Bernstein Ratner (Reference Bernstein Ratner1984), who found both content and function word vowel space expansion to children at her oldest stage (1;5–1;9); those children had MLUs between 2 and 3·5. However, she did not perform a statistical analysis, and used many more vowels than the point vowels selected here. Consistent with Bernstein Ratner, we found content word vowel space expansion for children at the one-word stage. A post-hoc review of the language abilities of the 1;6 children studied here showed that eleven of them had MLUs best placing these children at the one-word stage, while younger children did not average an identifiable word per turn, and most older children were well above the one-word stage. However, our overall trend for vowel clarification in this study was for vowel space to diminish fairly linearly with child age for a large proportion of our study mothers (6/15), while Bernstein Ratner found the opposite trend.
One obvious difference in design is that we used child age to group addressees, rather than child linguistic ability. Some of our children crossed in age with the twenty normally hearing one- to two-year-old children studied by Wieland et al. (Reference Wieland, Burnham, Kondaurova, Bergeson and Dilley2015), who also examined speech to children with cochlear implants and slightly older children. We do note that our 1;6 group, for whom maternal vowel clarity (as defined by vowel space) differentiated outcomes at age 2;0, was itself somewhat variable in terms of the children's language abilities, at least in terms of expressive vocabulary. For instance, in the mother–child interactions at 1;6, the number of words produced by the child ranged from 2 to 109, and the number of word types ranged from 2 to 61, although MLU only ranged between 1 and 1·435, meaning that few children were combining words into phrases. While grouping children by linguistic skill might seem to be an appropriate next step, it is not clear how such divergent skills are best captured. Nor could we assume that mothers adjust their own speech based on what their children say, as opposed to what they understand, something we could not systematically appraise in the children at 1;6.
Our study does not replicate results obtained by Burnham et al. (Reference Burnham, Wieland, Kondaurova, McAuley, Bergeson and Dilley2015), who found little obvious change in vowel features across a number of time periods in the first two years of life. However, that study utilized repeated readings of a storybook text to the study children, rather than the spontaneous play samples used in this study. Wang et al. (Reference Wang, Seidl and Cristia2015) were primarily concerned with F0 and vowel duration, which did not appear to differ remarkably in their samples of speech to 0;4 and 0;11 infants and an adult listener.
On our initial visual inspection of our small set of data, the total area used by the mother in producing the point vowel targets in IDS at 1;6 and 2;0 appeared to be associated with child language outcomes. To evaluate this finding, mothers were grouped by the size of their vowel space alone in each IDS condition (e.g. those with largest and smallest vowel space profiles). Very evident differences emerged from this analysis. The children in the ‘max vowel space’ group out-scored the ‘min vowel space’ speech group on all three standardized outcomes measured: the EOWVT, the PPVT, and the MCDI; the differences between group language outcomes were most evident and highly significant when the vowel space measurements were taken from IDS at 1;6. Mothers who most clearly differentiated between vowel sounds in IDS at 1;6 had children whose language skills were significantly stronger when measured six months later. Prior findings that larger vowel space corresponds with increased vowel intelligibility (cf. Ferguson & Kewley-Port, Reference Ferguson and Kewley-Port2007) supports the notion that maternal clarification in some way positively impacts a child's language development. It makes theoretical ‘sense’ that clarified speech would make it easier for a child to understand new words, and recognize words used repetitively in conversation as instances of the same lexical type, and would in turn make language acquisition a faster process than it might be for a child who receives more acoustically degraded (centralized) or variable speech input. It also appears reasonable to us that such impacts would be evident at the earliest productive stages of language production, the best description of the 1;6 sampling session, rather than at earlier and later points in development. Before one year of age, most children had limited expressive ability; by two years of age, most children were firmly on the road to utterance construction.
Exploring vowel variability as a measure of vowel clarity
A standard definition of ‘vowel clarity’ has yet to emerge, but it has been theorized that vowel clarity could be defined as a function of three factors: an enlarged vowel space, elongated vowel duration, and with an unknown contribution of vowel variability. Our correlations indicate that mothers who exhibited a larger vowel space when their children were 1;6 tended to have longer vowel durations and less vowel variability. Conversely, mothers who exhibited a smaller vowel space had shorter vowel durations and more vowel variability. However, vowel space was the only measure that appeared to relate positively, by visual inspection, to child language outcomes.
It is possible that vowel variability only becomes a problem when it causes vowel categories to overlap (Kuhl et al., Reference Kuhl, Andruski, Chistovich, Chistovich, Kozhevnikova, Ryskina, Stolyarova, Sundberg and Lacerda1997). Overlapping vowel categories should pose the real problem for children trying to map the phonemic representations of words in the input. The majority of the overlap between vowel categories was observed in plots of mothers’ ADS register. Unfortunately, we do not know of any way to statistically compute the degree of vowel formant overlap; no prior research appears to have treated this problem computationally. We suspect that our measure of vowel space was in part a proxy for overlap; as overall vowel space increases, overlap among individual vowel phoneme realizations should become less frequent. Variability, which was basically the standard deviation for each individual vowel's F1/F2 area, was virtually uncorrelated with mothers’ use of overall vowel space in our data.
Few studies have analyzed trends of vowel variability across addressee conditions in IDS, so there are several conflicting theories about its effect on language learning. One might hypothesize that too much variability or compressed vowel space might impair a child's ability to recognize repeated variants of the same word as referring to the same lexical item. It has been shown that repetition aids tremendously in lexical development (e.g. in this dataset, Newman, Rowe & Bernstein Ratner, Reference Newman, Rowe and Bernstein Ratner2016), but if the child cannot recognize that the same word is being repeated multiple times, she presumably will not benefit from this. On the other hand, some researchers believe that increased variation in input representations should help child language-learning (Kirchhoff & Schimmel, Reference Kirchhoff and Schimmel2005), and infants do appear to exploit cues that might lead them to create larger and more variable acoustic categories, such as those that might characterize accented speech (Schmale, Seidl & Cristia, Reference Schmale, Seidl and Cristia2015). It has been well established that before they can develop language, infants need to first learn how to process what they hear and hone their ability to map variations of the same sound into the same phonetic category. Thus, it seems possible that the child of a mother who exhibits a broader use of vowel space in her IDS would have more highly developed auditory processing skills when tackling the task of assigning linguistic identity to conversational samples, and could therefore be better equipped to process new words.
Limitations of the present study
The main limitations of this study lie in the number of spoken words that had to be excluded from acoustic analysis, as well as the limited number of word types that mothers used in speech across all sampling conditions. An unfortunate negative consequence of analyzing naturalistic speech samples is the risk of not eliciting enough lexical tokens to match the same words spoken to different participants (listeners). We empathize with prior studies of acoustic features of IDS that have used book-reading or a small subset of items to be named by women speaking to both infants and adults. While our design might have greater ecological validity, it severely reduced the number of tokens we were able to analyze across the registers to a small number of the many thousands of words spoken during the mothers’ visits.
It is also becoming clear that different tasks and settings meant to elicit ‘clear speech’ register can lead speakers to adopt very different phonological strategies. A recently observed example is Mazuka, Igarashi, Martin, and Utsugi (Reference Mazuka, Igarashi, Martin and Utsugi2015), who found vowel devoicing differences between read speech and IDS. It might be useful for future studies to compare multiple tasks within the same speakers, such as book-reading as well as natural speech, to resolve ambiguity about the role that task differences play in generating differing reports of whether and how speech is clarified in an infant-directed register.
The limited number of matched tokens in this study could have also contributed to the lack of findings related to vowel duration. An emphasis was placed on matching target vowels according to phonetic environment, in order to obtain consistent and reliable formant frequency values. As a result, the selection of token words was not as constrained by the numerous characteristics that are known to affect the durational characteristics of vowels (see Cristia & Seidl, Reference Cristia and Seidl2014, for discussion). Even beyond differences in prosodic boundaries in IDS and ADS, matching bee and beet was considered to be acceptable for our analyses, since it is likely that the formant values for /i/ would be similarly affected in both contexts. However, the duration of /i/ could be considerably shorter in the word beet, since the vowel precedes a stop consonant. It is possible that selecting inequitable tokens that did not control for contexts that affect vowel duration may have obscured any potential relationship between vowel duration and child language outcomes.
Directions for future research
Results of the present study support the presence of a relationship between one potential measure of vowel clarity in IDS – vowel space – and child language outcomes. However, to confirm the results of the present study and to more clearly outline the longitudinal trends that occur across IDS conditions, more research is warranted. Future investigations of this topic might focus on the longitudinal differences between vowel clarity measures at broadly different stages of child language development, as opposed to chronological ages, grouping infants based on their expressive and receptive language abilities and/or mean length of utterance (MLU).
Finally, in the debate about whether IDS is best described as a hyper-articulated register driven either by adults’ desire to provide a maximally beneficial learning signal to their children, or is simply a by-product of a more “holistic, and dyadic view of the register” (e.g. McMurray, Kovack-Lesh, Goodwin & McEchron, Reference McMurray, Kovack-Lesh, Goodwin and McEchron2013; Cristia & Seidl, Reference Cristia and Seidl2014), it might be useful to ask the parents themselves (after obtaining their speech samples) whether or not they believe they are making adjustments when they speak to the infant, and why they believe they do this. Some of the discrepant results appearing in the literature may have less to do with universal features of IDS than individual beliefs about what parents think they are achieving by talking to their children in ways they would never do to an adult listener. The fact that we were able to divide mothers into groups showing very different profiles of acoustic clarification shows that not all parents use the IDS register in equivalent ways. This fact may have consequences that go beyond any influences of articulatory style that we were able to observe, and likely involve many other features of IDS, such as lexical, grammatical, and prosodic adjustments, not to mention pragmatic variables. We already know from prior work with these parents and children that diversity and repetition of vocabulary is one such variable associated with differences in language outcomes, even when such differences were observed at 0;7, and then assessed for impacts much later on 2;0 outcomes (Newman et al., Reference Newman, Rowe and Bernstein Ratner2016). Whether or not some additional adjustments are in fact facilitative of children's language development is a question deserving of further study.
SUPPLEMENTARY MATERIALS
For supplementary materials for this paper, please visit <https://doi.org/10.1017/S0305000916000520>.