1. Mechanisms and Submechanisms
Although disciplines often have special depictions of causal systems, such as circuit diagrams in electronics, in many scientific applications causal mechanisms are now routinely represented by directed graphs whose vertices represent variable features of a system (where the possible variation may be as simple as the presence or absence of a feature) and whose directed edges represent (relative to the other represented variables) a direct causal connection between the variables. These representations are abstract in several ways. While the graph topology characterizes a set of conditional independence relations via the well-known Markov condition, the graph itself does not fully specify a joint probability distribution on the variables represented as vertices and gives no indication of the strengths or even algebraic signs of influences, the variables represented need not be spatially localized, and the topology of the graph does not necessarily correspond to a spatial layout. Thus, a switch that is physically between an input and an output would not be represented graphically by input → switch → output but rather by input → output ← switch.Footnote 1 Our concern here is with another aspect of abstraction: the graphs do not represent what is going on in the process or processes represented by a directed edge. “Inside” a directed edge there may be a submechanism, and two or more submechanisms “inside” different directed edges may have causal connections with one another. Gebharter (Reference Gebharter2014b) proposed simple rules for obtaining the graphical depiction of the less detailed mechanism, or superstructure, by marginalizing out some variables and their relations from the more detailed structure. His proposal is, as he notes (Gebharter Reference Gebharter2014a), a special case of the widely used mixed ancestral graph representation introduced a dozen years ago by Richardson and Spirtes (Reference Richardson and Spirtes2002). Williamson and Gabbay (Reference Williamson, Gabbay and Gillies2005) propose a quite different graphical representation. Gebharter’s proves to be useful.
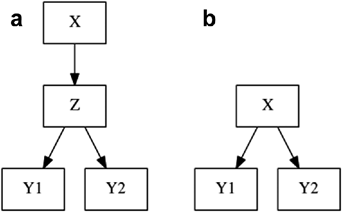
In Gebharter’s representation, unobserved causal chains and unobserved common causes are “marginalized out.” Thus, when X, Y are recorded variables and Z is not, and the graph with unobserved variables is X → Z → W, the marginal representation becomes X → Y. When there is a common unobserved cause X ← Z → W, the marginal representation becomes X ↔ Y. If the full structure is as in figure 1a, then the marginal structure is figure 1b.
Figure 1

These marginalizations of graph structure preserve the conditional independence and dependence relations among the observed variables implied by the Markov condition for the full detailed structure. Representation is one thing; it is quite another to extract information about the unobserved mechanism from data about the observed variables if the truth is among the representations, and that is the concern of this article.
Abstract representation—by graphical models or otherwise—is of scientific value only if the representations are somehow useful. One use is in calculating values of some variables from values of others when a representation is known or assumed as a hypothesis. Thus, Ohm’s law permits the calculation of voltage drops given a circuit, various updating algorithms permit the calculation of conditional probabilities in directed acyclic graphs with a probability distribution satisfying the Markov condition (Pearl Reference Pearl1988), and still other algorithms permit the calculation of conditional probabilities upon exogenous interventions (Pearl Reference Pearl2000; Spirtes, Glymour, and Scheines Reference Spirtes, Glymour and Scheines2000; Tian and Pearl Reference Tian and Pearl2002). Zhang (Reference Zhang2008) shows when and how mixed ancestral graphs, including those Gebharter proposes, can be used to compute the effects of interventions in a system without knowledge of its submechanisms. The problem of predicting with graphical causal models that are superstructures over unknown submechanisms is essentially solved. The problem of discovering those submechanisms from information about their superstructures is not.
Another use of appropriate abstract representations is in discovering mechanisms.Footnote 2 A computational procedure for discovery requires a mathematically precise object for which to search, whether it is a real number (as in statistical parameter estimation), a differential equation (as in system identification), or a directed graph. Efficient computational procedures are indispensable when the “space” of alternative hypotheses is large, as it is in statistical estimation of parameters, cellular biology, brain connectivity, and other areas. (Imagine trying to estimate by trial and error the maximum likelihood value of a statistical parameter as simple as the mean or variance.) “Thick” descriptions of a system are important in limiting the search space, in knowing what the measurements mean, how to conduct them, and how to intervene on the system, but for discovery from data, once a search space is specified what matters is the mathematical features of representations for which efficient search is possible.
Philosophical discussions of mechanisms and submechanisms have illustrated representational issues with simple machines (e.g., a water cooler), but the identification of submechanisms is serious science. The cellular pathways between transcription of genes and the production of proteins, for example, form an important aspect of the fundamental biology of cancer, where novel pathways are created or normal ones altered by novel genetic anomalies, and distinct tumor types vary in their pathways. Research has discovered novel entities and conditions, such as microRNA and protein complexes, that play roles in transcription, in the splicing of RNA, and in translation of RNA into proteins. Discovering the causal relations of these factors in the development of tumors is a prominent area of contemporary research, but in many data sets variables that are thought to be relevant intermediaries are unmeasured. Again, in psychological research, so-called MIMIC (Multiple Input Multiple IndiCator) models postulate unmeasured intermediate variables (and their causal connections) between input (“stimulus”) and output (“response”). MIMIC models have been used to estimate models of executive function (Hughes et al. Reference Hughes, Ensor, Wilson and Graham2009). In economics, a number of researchers have used MIMIC models to estimate the size of the shadow economy (Tedds Reference Tedds1998; Giles Reference Giles1999). In public policy, MIMIC models were used to estimate what factors led to the successful settlement of immigrants (Lester Reference Lester2008).
2. Existing Search Procedures: Accuracy and Complexity
A variety of computerized search procedures for causal relations have appeared in the last quarter century and have found increasing application in the sciences, especially in biomedicine and genomics. They vary in the conditions on causal structure (represented by directed graphs), probability distribution families, and sampling regimes for which sufficient conditions for their asymptotic (large sample limit) correctness are known. Necessary and sufficient conditions for correctness are not known for any available search procedure. Proposed methods face two requirements for applicability to “big data” or “high dimensional” problems that arise in genomics, climate research, and elsewhere: accuracy and computational tractability. Even without “latent”—unmeasured—common causes, all known methods that are correct under the Causal Markov and Faithfulness conditions (i.e., all conditional independence relations in a probability distribution satisfying the Markov condition for a graph are those implied by the Markov condition; Spirtes et al. Reference Spirtes, Glymour and Scheines2000) increase exponentially in complexity in the worst case (i.e., the true graph is complete—every pair of variables is connected by a directed edge) as the number of variables increases; successful causal search is possible only for systems whose causal relations are relatively sparse. Simplicity is less a metaphysical assumption than an epistemological boundary: if the causal relations we are interested in are too many and too complex, we will not discover most of them.
The method most commonly used for MIMIC models is factor analysis. Factor analysis estimates common causes of output variables, and it is assumed that the investigator knows which input variables influence which inferred unobserved (latent) causes of the output variables. Factor models are known to be underdetermined and have no asymptotic proof of causal correctness even up to the class of underdetermined alternatives. In section 6 below, we compare our procedure with factor analysis on a number of alternative models.
The procedures that come closest to solving the problem of unobserved intermediate structure as in MIMIC models and gene expression are the FCI (fast causal inference) algorithm (Spirtes et al. Reference Spirtes, Glymour and Scheines2000) and its speedups, notably the RFCI (really fast causal inference algorithm; Kalisch et al. Reference Kalisch, Mächler, Colombo, Maathuis and Bühlmann2012) and a series of procedures for identifying latent causal structure (Silva et al. Reference Silva, Scheines, Glymour and Spirtes2006; Kummerfeld and Ramsey Reference Kummerfeld and Ramsey2015). Despite its name, the FCI algorithm is not tractable for problems with very large numbers of variables; an alternative CI (causal inference; Verma and Pearl Reference Verma and Pearl1992) algorithm is much slower still. RFCI, which in most but not all cases returns the same information as FCI, will run on at least several hundred variables with sparse graphs. An analysis of runtime and memory demands of RFCI as a function of the complexity of the graph from which data are generated is not available. (The lowest complexity bound on any search method using, as is common, correlations is a quadratic increase in the number of computational steps as a function of the number of variables, because even the computation of simple covariances of pairs of measured variables increases at that rate, and covariance is about the computationally easiest measure of association there is.)
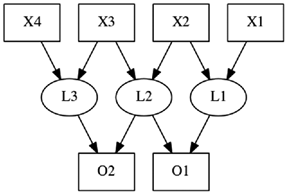
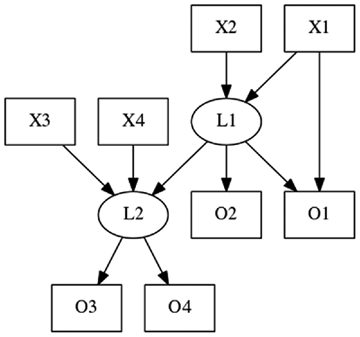
FCI and RFCI are not suitable for our problem because while they return true information, it is not the information we seek. For example, suppose the true structure is as in figure 2.Footnote 3 With the background information that X1, X2, X3, and X4 are inputs (exogenous), FCI and RFCI will return the information that X1, X2, and X3 are causes of O1, and X2, X3, and X4 are causes of O2, and O1 and O2 share a common unobserved cause. All of that is true, but it does not tell us how many latent intermediate variables there are or how they are connected to the input variables (X), the output variables (O), or each other.
Figure 2

A procedure that is closer to our aim has been provided by Kummerfeld and Ramsey (Reference Kummerfeld and Ramsey2015). The procedure, improving on Silva et al. (Reference Silva, Scheines, Glymour and Spirtes2006), finds, if such exist, a collection of subsets of measured variables, each subset having at most two direct, unmeasured common causes, with no direct causal connections between measured variables within a subset or between measured variables in different subsets. The collection is not necessarily a partition of the set of measured variables—some observed variables may be discarded by the procedure. For input/output systems it is sufficient (but not necessary) for the correctness of the procedure (assuming as well the Markov and Faithfulness conditions and identically, independently distributed variables) that output variables depend linearly on latent variables and that every latent variable have at least three observed effects. The procedure exploits rank constraints on the correlation matrix of the observed variables.Footnote 4 The practical computational limits of the procedure are well understood.
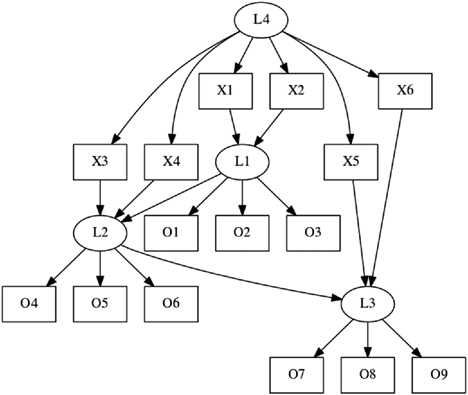
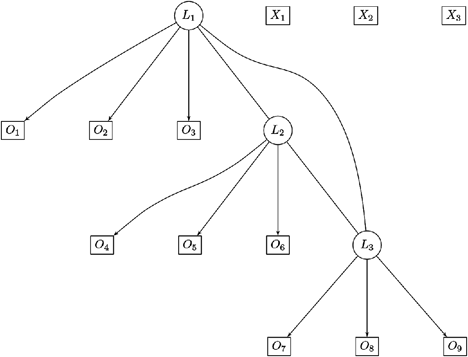
Suppose the true structure is as in figure 3. The procedure will find no aspect of the true graph. If the true graph is like figure 3 but without the causal connections from L4 to the X variables (i.e., the X variables are jointly independent), the procedure will find the three clusters of output variables in figure 3 and that one (and only one) of the input variables to each latent is its cause. It will find that there are causal connections among L1, L2, and L3 but will not be able to determine the directions of influence among those variables.
Figure 3

3. Strategies
We will describe and prove correct, assuming a restrictive condition on the causal structure, a fast algorithm for identifying the structure of input/output systems with endogenous latent variables. Then we show that the restrictive condition is not a necessary connection and note that certain feedback relations between measured and unmeasured variables represented by cyclic directed graphs can be discovered. First, however we describe three methodological ideas that drive our algorithms.
3.1. Sober’s Criterion
Sober (Reference Sober1998) addressed an aspect of discovering submechanisms. Sober pointed out that if in input variable X has separate, noninteracting mechanisms through which it influences two (or more) variables Y, Z, which are not otherwise causally connected, then Y, Z should be independent conditional on X, but if there are no such separate mechanisms but instead X influences Y and Z through an intermediate variable U that is a common cause of Y and Z, then Y and Z should not be independent conditional on X. The first claim is a simple application of the Causal Markov condition (Spirtes et al. Reference Spirtes, Glymour and Scheines2000) to the graph Y ← X → Z. The second claim is less obvious but is a consequence of the Faithfulness condition, which implies that values of endogenous variables are not uniquely determined by values of their represented direct causes. Granting the assumptions, Sober’s criterion provides some information when there are more complex structures. Consider the alternative MIMIC models in figures 4, 5, and 6.
Figure 4

Figure 5

Figure 6

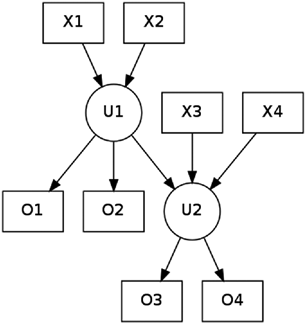
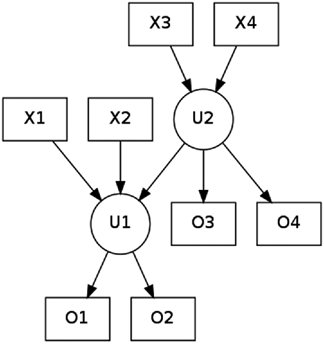
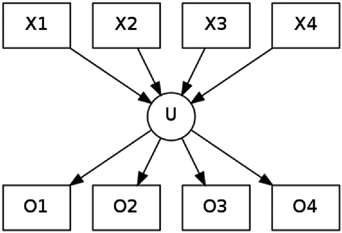
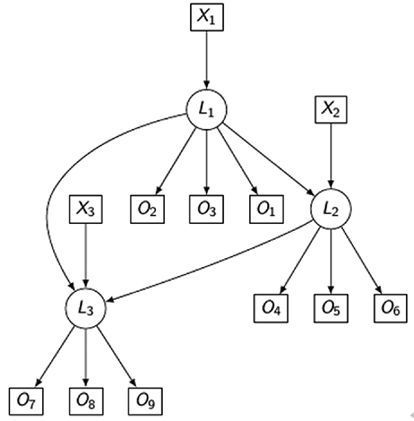
Assuming it is known which input variables in these figures influence (directly or indirectly) which output variables, Sober’s criterion tells us different information for the three structures: for figure 4, for each pair of O variables, X1 has an unmeasured U intermediate and so does X2, and for O3 and O4, every X variable has an unmeasured intermediate; for figure 5 the implications are different but parallel, with obvious permutations of the variables; for figure 6, every X has an unmeasured U for every pair of variables. This suggests that Sober’s criterion, with the assumptions and prior information noted, could be used to identify the unobserved structure. But Sober’s criterion can only be applied if it is known which input variables influence which output variables, and it will not tell us in figure 6 how many unobserved intermediate variables there are, and in figures 4 and 5 it will not tell us the direction of influence between the unobserved variables. Nonetheless, in each case the algorithm we will describe recovers this information from measurements of the X and O variables.
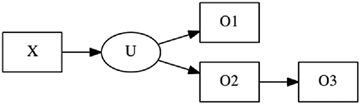
Sober’s criterion does not work if output variables caused by the unobserved intermediates also directly affect one another. Further, there can be measured outputs that are not directly influenced by unobserved intermediates, as in figure 7. Sober’s criterion implies that there is an unmeasured common cause of O3 and O2, and of O3 and O1, but would not reveal that the unobserved variable influences O3 only through O2. The upshot is that to use Sober’s criterion in an informative search procedure for complex systems, the space of hypotheses has to be carefully contoured, and Sober’s criterion will need to be embedded in a more elaborate algorithm.
Figure 7

3.2. The Inclusion Criterion
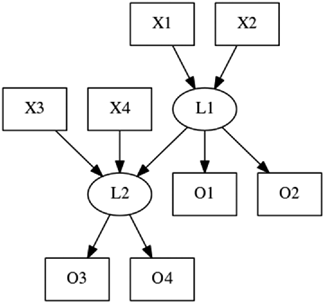
Consider the structure in figure 8: X3 and X4 are associated with O3 and O4, while X1 and X2 are associated with all four output variables. The inclusion relations among the sets of output variables inform us about which input variables directly influence a latent common cause of a set of outputs and about the directions of influence between the latents. Thus, assuming an input/output model with endogenous causes of the outputs, the inclusion relations for figure 8 tell us that X3 and X4 are parents of a latent variable that is a cause of O3 and O4, but not of O1 and O2, and that X1 and X2 are causes of another latent that causes O1 and O2 and tells us the direction of influence between the latents. This works if there is at most a single causal path between any two variables and in certain other cases we later describe.
Figure 8

3.3. d-separation
The d-separation condition (Pearl Reference Pearl1988) provides a graphical criterion for conditional independence relations implied by a directed, acyclic graph and any probability distribution on the variables satisfying the Markov condition for that graph.Footnote 5 It is exploited in a class of search algorithms, including the PC and FCI and RFCI algorithms, which use a series of conditional independence tests, the Bayesian greedy equivalence search (GES), which updates prior probabilities sensitive to conditional independence relations, and many other algorithms. For input/output systems in which the inputs are independent of one another but unknown, and there are at least two inputs to each latent and each observed variable is the effect of a latent variable, these search procedures can quickly distinguish inputs from outputs via the collider principle: if X1 → L, L2 → L, and L → O, then X1 and X2 are dependent conditional on O. The collider principle lies behind the famous Monte Hall problem (Rosenhouse Reference Rosenhouse2009). For systems in which the inputs are previously distinguished from the outputs, d-separation allows application of the inclusion criterion by conditioning, for each input and all of the other input variables. For systems in which some observed variables, say O3 are causes of other observed variables, say O5, that are not directly caused by latent variables or inputs, search procedures such as GES and PC allow identification of the O3 → O5 connection.
4. Simple Search
Suppose we are given data on a collection of variables and we know that some of them, the inputs X, are potential causes of others, the outputs O, but we have no prior knowledge of which inputs cause which outputs. We assume the otherwise unknown causal structure is that of a MIMIC model. Here is a summary of a search procedure, which we call detect.mimic, or DM.
Start with a completely disconnected graph having X vertices and O vertices. Identify the inputs (X). With routine statistical tests we can find which X and O variables are dependent on one another. Let OUT(X) be the set of O variables dependent on variable X, and let IN(O) be the set of X variables dependent on variable O. Partition the X variables by Xi ∼ Xj if and only if OUT(Xi) = OUT(Xj). For each such equivalence class, Xi, insert a latent variable, Ui, and add edges from each X in Xi to Ui. Partially order the OUT(Xi) by inclusion. For each leaf (terminal element) in that ordering, OUT(Xk), of the partial order, add a directed edge from Uk to each member of OUT(Xk). Remove OUT(Xk) from the set of observed variables and repeat. If OUT(Xk) ⊂ OUT(Xj) add a directed edge from Uk to Uj unless there exist distinct Or ∊ OUT(Xj)\OUT(Xk) and Os ∊ OUT(Xk) that are independent conditional on some subset of Xk ∪ Xj. Use the PC (Spirtes and Glymour Reference Spirtes and Glymour1991) or other search algorithm to find any O variables that are influenced by X variables only via other O variables and to find the causal relations among them. Remove edges from latent variables to those O variables.
In steps:
1. Start with a completely disconnected graph having X vertices and O vertices. Identify the inputs (X) by means of a procedure such as PC, discarding variables whose direction cannot be estimated by that procedure (i.e., true output variables that are caused by only one input variable and true input variables that cause a single output variable). (This step is unnecessary if inputs are previously distinguished from outputs, which is often the case.)
2. With routine statistical tests find which X and O variables are dependent on one another.
3. Let OUT(X) be the set of O variables dependent on variable X, and let IN(O) be the set of X variables dependent on variable O. Partition the X variables by Xi ∼ Xj if and only if OUT(Xi) = OUT(Xj).
4. For each such equivalence class, Xi, insert a latent variable, Ui, and add edges from each X in Xi to Ui.
5. Partially order the OUT(Xi) by inclusion. For each leaf, OUT(Xk), of the partial order, add a directed edge from Uk to each member of OUT(Xk).
6. Remove OUT(Xk) from the set of observed variables and repeat step 5.
7. If OUT(Xk) ⊂ OUT(Xj) add a directed edge from Uk to Uj
8. If there exist Or ∊ OUT(Xj)\OUT(Xk) and Os ∊ OUT(Xk) that are independent conditional on some subset of Xk ∪ Xj, remove the edge between the latent causes of Or and Os.
9. Use the PC or other search algorithm to find any O variables that are influenced by X variables only via other O variables and to find the causal relations among them. Remove edges from latent variables to those O variables, and add any adjacencies to their fellow O variables using the pattern outputted by PC or some other search algorithm.
Pseudocode for the procedure is given in appendix A.
Sufficient conditions for this procedure to find the true structure are very restrictive:
1. Every causal path from an input to an output is through an unobserved variable;
2. Every output variable has an unobserved cause that is an effect of an input variable;
3. There are no closed directed paths (i.e., no cycles);
4. Each unobserved variable has at least one observed effect and at least one observed cause (when there is no prior classification of variables into input and output, each latent variable must have at least two observed causes);
5. The true structure is simply connected (i.e., there is at most one directed path between any two variables;
6. The input variables are jointly independent;
7. The Causal Markov condition holds;
8. The sample cases are independently and identically distributed.
9. Nondeterminism: values of endogenous variables are not determined uniquely by values of variables that are their direct causes.
Under these conditions, the procedure returns the true structure given true facts about conditional independence and dependence of observed variables. A proof is given in appendix B. We show later that not all of these conditions are necessary. We emphasize that the procedure is “nonparametric”—it is not restricted to any functional form (e.g., linearity) for the relations between variables or to any family of probability distributions for the variables.
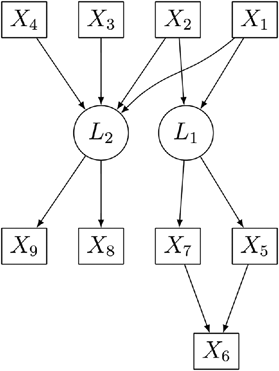
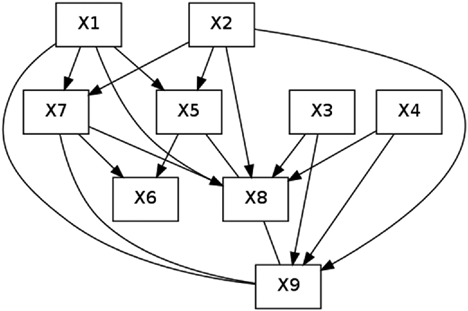
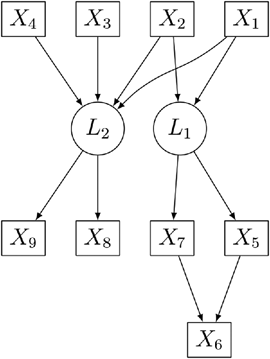
An Illustration.—We assume probability relations are generated in accord with the Markov condition for the graph shown in figure 9, and we show how the algorithm we have described recovers the structure.
True graph.

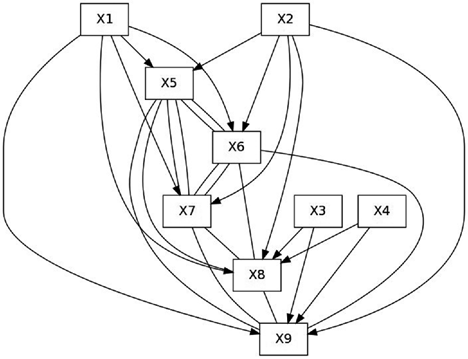
Step 1: We begin by applying the PC algorithm to the data set (generated from fig. 9). The PC algorithm starts with a complete graph and uses conditional independence facts to remove edges and direct remaining edges. Here, we need only use unconditional independence facts. Using the pattern returned by PC (fig. 10),Footnote 6 we check each node’s indegree. If a node has an indegree (i.e., the number of arrows “into” it) of 0, then we classify it as an input. Otherwise, we classify the node as an output. In figure 10, we can see that nodes X1–X4 are inputs, while nodes X5–X9 are outputs.
Pattern after running the PC algorithm to find unconditional independence relations.

Step 1 can be skipped if, as is often the case, it is already known which variables are inputs and which are outputs.
Step 2: The identification of correlated inputs and outputs is a result of step 1.
Step 3: In figure 10, there are edges between every output variable and nodes X1 and X2, but nodes X3 and X4 only have edges to outputs X8 and X9. If we think of this in terms of sets, we have an IN(〈X1, X2〉), or input set, connected to the output set OUT(〈X5, X6, X7〉). We also have another set, IN(〈X1, X2, X3, X4〉) connected to OUT(〈X8, X9〉).Footnote 7
Step 3a: The equivalence classes of input variables are IN(〈X1, X2〉) and IN(〈X3, X4〉).
Step 4: Insert a latent variable for each equivalence class.
Step 5: Now that the number of latents is known, we cluster outputs around their respective latents. In the case of the example, IN(〈X1, X2〉) is a proper subset of IN(〈X1, X2, X3, X4〉) and is a leaf in the ordering. We add edges to L1 for X1 and X2.
Step 6: We remove X1, X2 from IN(〈X1, X2, X3, X4〉) and add edges from X3, X4 to L2.
Step 7: We use the information from steps 5 and 6 to introduce and orient a latent-to-latent edge from IN(〈X1, X2〉)’s latent to IN(〈X1, X2, X3, X4〉)’s latent.
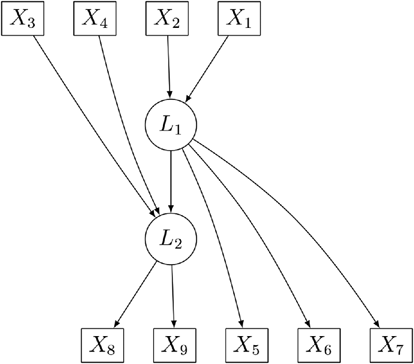
Doing all of this gives us figure 11. Note that there are two mismatches between the true graph and figure 11. There should not be a latent-to-latent edge connecting L1 to L2. Instead, X1 and X2 should have edges connecting them to L2. Additionally, X6 should not be directly connected L1. These mismatches are corrected in the next several steps.
After step 7, before running Sober’s step.

Step 8: Node X9 is independent of X5 when X1 and X2 are conditioned on. We can therefore conclude that X9 and X5 are only connected via a path through the inputs X1 and X2, rather than via an L1 to L2 edge (else by Sober’s criterion, conditioning would not have blocked the path from X9 to X5). Therefore, we remove the latent-to-latent edge.
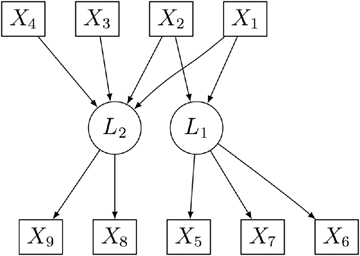
This gives us figure 12. All that remains is to remove the incorrect edge directly connecting L1 to X6.
After applying Sober’s step. Note the absence of the L1 to L2 edge.

Step 9: Run the PC algorithm on the data set again, with no bound on how many variables are conditioned on. This gives us figure 13. We now check the pattern in figure 13 for any output variables that have no directed edges from input variables. If an output lacks such edges, we know that it cannot be directly connected to a latent but must instead only be connected via its fellow output variables. In figure 13, the output variable X6 has no edges from input variables but remains connected to outputs X5 and X7. We therefore remove the edge from L1 to X6, in figure 13 and add edges connecting X6 to X5 and X7. For the new output-to-output edges, we use the direction reported in figure 13. In some cases, this means that the added edges will not have directions as the pattern returned by PC may fail to orient some edges.
Pattern returned by PC. Note the absence of an edge from any input variable to X6.

Step 10: The algorithm ends, and we return the discovered graph (depicted in fig. 14).
Final graph, returned by the algorithm.

5. An Empirical Application
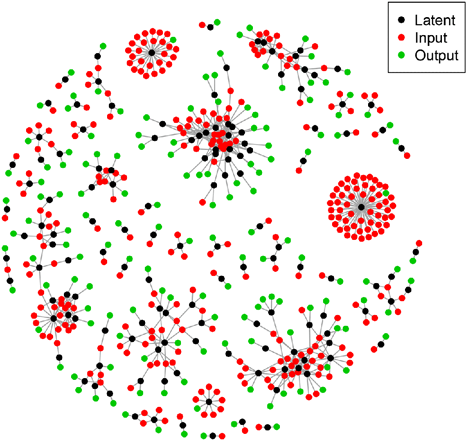
Currently, researchers are interested in unobserved protein pathways connecting genes to measurable concentrations of RNA. One possible use of such information is the study of cancer. Using normal distribution tests, we applied our algorithm to a data set of patients with ovarian cancer, which returned the results displayed in figure 15.Footnote 8 While the true graph is likely both cyclical and multiply connected, violating two of our algorithm’s assumptions, some information can still be obtained.
Protein signaling network reported after running the DM algorithm on a 4,369 variable subset (of an almost 30,000 variable set) of a genomic data set. Black nodes represent latents, red nodes inputs (genes), and green nodes outputs (gene expressions). Note that some edges can overlap others in the picture.

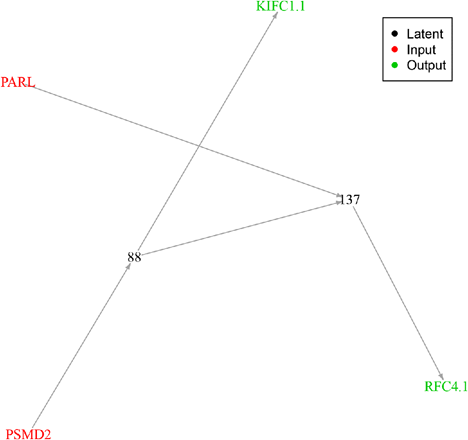
In figure 15 there are a number of distinct subgraphs in the overall graph, as well as three subgraphs where many genes appear to be regulating a single gene expression. It is not implausible that somatic mutations (the inputs) are independent, but the appearance of multiple gene regulators for a single gene expression could also result from reducing the number of variables in the very large data set of highly correlated gene expression measurements—all but one may be removed in the variable reduction procedure, which can in some cases undermine the correctness of the algorithm because the partial ordering requires at least one direct measured effect for each latent variable.Footnote 9 Assuming figure 16 is correct, the conditions we prove sufficient for correctness of the algorithm are not met, but the structure is nonetheless uniquely identifiable by our algorithm because the inputs and outputs are segregated before running the search procedure.
Enlarged subgraph, where a latent-to-latent edge was found. Black numbers are latents while the red labels are genes and the green labels are gene expressions.

The example is a demonstration of feasibility rather than of empirical correctness for the case. We are currently working on identifying independently known cellular pathways on which to test the procedure and the generalizations discussed below. The example required 43 minutes to run on a single Core laptop, and on serious computers much larger systems could be analyzed. Except for the last step of the algorithm where PC is run with an “infinite” depth, the time complexity of the procedure increases quadratically with the number of variables.
6. Comparison with Factor Analysis
Factor analysis combined with guesswork or knowledge about which input variables influence which output variables is the most common method in practice for finding submechanisms with endogenous unmeasured variables (i.e., MIMIC models). So we compare accuracies of factor analysis—merely for finding the number of latent variables.
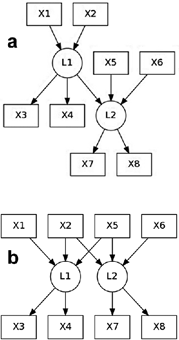
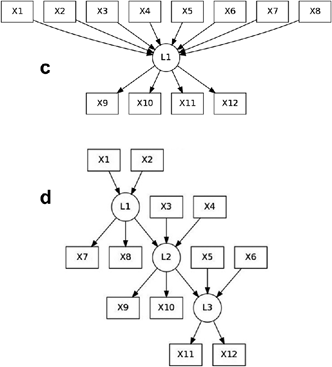
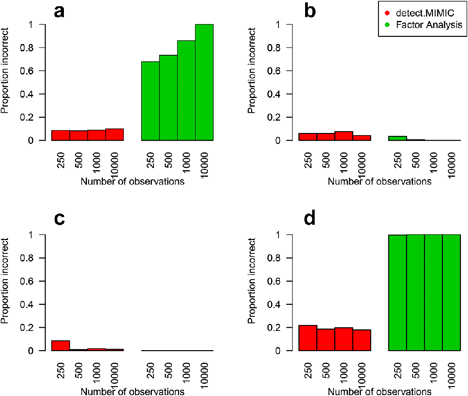
Data sets were generated 500 times from each of the graphs in figure 17. Every variable was created by adding the values generated for its parents plus an additional error term that followed a standard normal distribution. Factor analysis and DM were then run on each data set, and the number of times each algorithm reported an incorrect number of latent variables was recorded. The factor analysis program (in R) uses four different nongraphical versions of a scree plot to determine the number of latents.Footnote 10 Each method was given a vote for the number of latent variables, and the number with the most votes was chosen. In the event of a tied vote, the smallest number in the tie was selected.
Various causal structures from which data were simulated. Note that L1, L2, and L3 are all latents.


Figure 18 illustrates that factor analysis is an unreliable tool for correctly identifying the number of latent variables. While in some cases it performs reasonably well (as in the case of figs. 18b and 18c), for other structures factor analysis is almost always mistaken (fig. 18d). In one case (fig. 18a), it performed worse as sample size increased. In practice, when the true underlying structure is unknown, one cannot have any reasonable confidence that the factor analysis output is correct.
Proportion of cases (out of 500) where an algorithm returned a model with the incorrect number of latent variables. DM algorithm is depicted in red (on the left), while factor analysis is depicted in green (on the right). Data generated from figure 17 graphs a–d.

7. Generalizations
As written, the DM algorithm will identify substructures of some structures that are not simply connected. For example, for the elaboration of figure 8 shown in figure 19 we find the structure in figure 8, leaving out the X1 → O1 edge. The same is true if, in figure 19, edges are added from X1 or X2 or both to L2. The procedure will not find a correct singly connected substructure, however, if in figure 8 or 19 a directed edge is added from X3 or X4 or both to L1. In that case, X3 or X4 or both will be clustered with X1 and X2.
Figure 19

In cases such as that shown in figure 3, the problem can be solved by modifying step 2 of the DM algorithm so that in finding the output variables influenced by any input, X, the other input variables are conditioned on. This step is not without risks, however, because if X and some other measured variable Xm both influence a third variable, say Xn, then conditioning on Xn will create an association between X and the output variables influenced by Xn—another example of the collider problem illustrated by the Monty Hall Problem. Automated search is an aid, not a full replacement for investigators’ prior knowledge.
8. Merging
Silva et al. (Reference Silva, Scheines, Glymour and Spirtes2006) and Kummerfeld and Ramsey (Reference Kummerfeld and Ramsey2015) have developed other methods for finding substructure. Their procedures have both advantages and disadvantages. To advantage, they are not limited to singly connected systems. Instead, they find subsets of measured variables that are singly connected to one or two latent variables, if such exist. The graphical causal relations among the latent variables do not have to be singly connected. The disadvantages are linearity restrictions on the connections between output variables and latent variables (although not among the latent variables themselves), that the procedures cannot identify all of the input causes of a latent variable, and that the causal order of latent variables may be underdetermined. The advantages help with the DM algorithm, since their procedures provide a guarantee that the measured variables in each selected subset have a common cause and are otherwise unconfounded by direct effects from other measured variables or extra common causes, and the latent-to-latent causal relations need not be singly connected. The methods we have described can help as well, because they can aid in identifying which input variables influence which latent variables directly and can sometimes direct edges between latent variables left undirected by the Silva and Kummerfeld algorithms.
Figure 20 shows the output of the Silva or Kummerfeld algorithms for an example in which X1, X2, and X3 are causes of L1, L2, and L3, respectively. These procedures can, however, be combined with steps in our algorithm. Step 2 can be applied to estimate which measured variables influence which latent variables, and step 3 can be applied to determine the directions of edges between the latent variables. The result is shown in figure 21.
Produced by the Silva procedure that fails to cluster input variables and does not find the directions for latent-to-latent edges.

True causal structure, discovered after using step 2 of the DM algorithm to cluster the inputs and step 3 to orient the latent-to-latent edges.

9. Open Problems
One problem with our algorithm, or its combination with the Silva or Kummerfeld algorithms, is that these procedures cannot identify direct influences from input to output variables, which was part of the aim of Sober’s procedure. A second issue is the restriction to singly connected networks, which, as figure 21 illustrates, is relieved in part by combining our procedure with Silva’s or Kummerfeld’s.
A third, fascinating, problem is discovering feedback structure involving latent endogenous variables. In genomic processes, for example, mRNA is transcribed from gene sequences of DNA by a process regulated by, among other things, proteins. The mRNA, after a lot of subsequent processing, is translated into proteins. Some of these proteins may regulate transcription of the gene from which they descend. The process may therefore involve a feedback relation between measured effects and unmeasured causes.
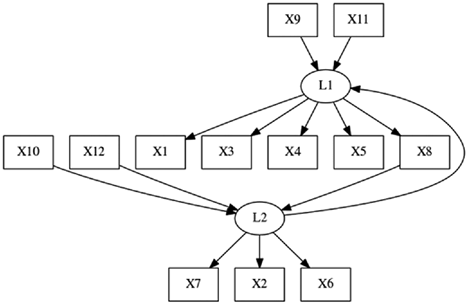
Using rank constraints, we have been able to show that in linear systems some cyclic feedback relations between measured and latent variables can be identified, as in figure 22, when it is known that there are no direct causal connections between output variables. We leave the details to another place, but clearly the topic begs for further research.
Causal system for which the cyclic structure is identifiable assuming linearity and the absence of output-output connections.

10. Conclusion
While most of the metaphysical and conceptual analysis of mechanisms is of little if any potential aid to science, two aspects are prediction and discovery. The “thin” representation provided by graphical causal models, supplemented where possible by estimates of the strengths of effects, can be useful, even essential, for prediction and discovery provided the representations also imply statistical constraints that can be exploited to identify causal relations. With these representations, problems of prediction with and without interventions have largely been solved, but many problems about discovery remain open. Using Gebharter’s representation for such structures and exploiting an insight of Sober’s, d-separation, and an inclusion principle, we have addressed one class of such problems for structures with intermediate or endogenous unmeasured structure. Scientifically important problems of search and discovery for related structures remain to be solved.
Appendix A: Algorithm Pseudocode
See Murray-Watters (Reference Murray-Watters2014).
Algorithm: DM(Data)
Step 1.
PC:= A function returning the pattern produced by the PC algorithm.
inputs:=NULL {The set of inputs.}
outputs:=NULL {The set of outputs.}
X:= Data
pc.pattern:= PC(X, depth = 0)
N:= Nodes(pcpattern)
For each n in N
If adjacency(n) ∼ == 0
then if adjacency(n) = outdegree(n)
add n to inputs
else
add n to outputs
Input.Parents(n):= PAR(n, pc.pattern) ∩ inputs
Step 2.
Latents:= NULL
Latents (L):= 〈IN(L), OUT(L), LC(L)〉
For all L, Latents(L): = 〈NULL, NULL, NULL〉
Input.Parents: The set of cluster assignments. Each member of Latents (i.e., a specific latent) contains 〈IN = set of inputs for the latent, OUT = set of outputs, and LC = set of latent children (i.e., a latent descendant).〉
For all x in outputs
If there exists a y in latents such that Input.Parents(x) == IN(y)
OUT(y):= OUT(y) ∪ {x}.
else
Create a new member, z, of Latents, with Latents(z):=
〈IN(z):= Input.Parents(x),
OUT(x) ∪ {x},
NULL〉
Step 3.
For each x, y in Latents
If IN(x) is a proper subset of IN(y), and IN(x) is the largest such subset, then
LC(x):= LC(x) ∪ {y};
for all z in Latents,
IN(z):= IN(z)\IN(x)
Step 4.
For each x, y in Latents,
If LC(x) == y and OUT(x)_‖_OUT(y)|(IN(x) and IN(y))
LC(x):= NULL
Let z be the smallest subset of IN(x) ∪ IN(y) such that OUT(x)_‖_OUT(y)|(z)
IN(x):= IN(x) ∪ {z}
IN(y):= IN(y) ∪ {z}
Step 5. pc.pattern.infinite:= PC(X, depth = infinite)
Step 6. Examine the graphs produced in steps 4 and 5 (name these G4 and G5, respectively).
For each output variable Oi in G4 such that there is no direct edge between Oi and any input variables in G5, remove the edge between Oi and its latent. Add any adjacencies (from G5) between Oi and the outputs connected to Oi’s former latent.
Step 7. Return the graph from the end of step 6.
Appendix B: Proof of Algorithm Sufficiency
See Murray-Watters (Reference Murray-Watters2014).
Assumptions
A1. Markov Assumption: Every variable is independent of its nondescendants given the variable’s parents.
A2. Faithfulness: A graph and a probability distribution are faithful to one another if all the (un)conditional independence relations in the probability distribution are entailed by the graph and the Markov Assumption.
A3. The true graph is acyclic.
A4. The true graph is singly connected.
A5. Every latent has at least two inputs and one output.
A6. No input has a path to an output except through a latent.
A7. Inputs are probabilistically independent of one another.
Note: Generalizations of the algorithm are possible without this assumption (A7), but the information recovered may be reduced.
A8. Every measured variable is an input, an output, or a descendant of (an) output(s).
Proof of Correctness for Step 1
Because of assumptions A1, A2, and A3, the PC algorithm will produce a pattern consistent with the unconditional independence relations true of the measured variables in the true graph. Using this pattern, every input variable from the generating graph will only have adjacencies connecting it to output variables in the generating graph (as assumption A7 forbids adjacencies between input variables).
For every pair of variables that are inputs in the true graph, there will be no adjacency between the two variables in the PC pattern (by A7). For every variable that is an input in the true graph and every output that is a descendant of that input, there will be an adjacency in the pattern returned by PC (by A6).
All of these adjacencies in the pc.pattern will ultimately be a directed edge from an input to an output variable, as the only paths from inputs to outputs in the PC graph output will be through unshielded colliders (because of assumptions A5 and A6). Therefore, every input will have a total degree of no more than 0. Finally, because of assumption A8, every output variable must have an indegree greater than 0. So step 1 correctly classifies the input and output variables.
Proof of Correctness for Step 2
As every edge connecting an input to an output in pc.pattern must be the result of a path through a latent in the true graph (because of A6) and every output variable is a descendant of a latent (A8), there must be at least one latent (assuming the PC graph is not empty). If there are sets of outputs whose members only have edges (in the pc.pattern) to some subset of the inputs, then there must be more than one latent (because of A6), and each of these sets of outputs must have its own latent, as the only path from an input to an output is through a latent (A6), thus giving the correct number of latents.
Proof of Correctness for Step 3
If the input set of a latent (a) is a subset of the input set of another latent (b), and a is the largest such subset, then it must be the case that a is a latent cause of b (or latents a and b share some inputs). Otherwise, the inputs of a would have to have a path to the outputs of b via a nonlatent (forbidden by A6) or via some latent between a and b (which is forbidden by the “largest subset” condition).
Proof of Correctness for Step 4
If step 3 reports an edge between two latents, then either that edge exists in the true graph or the latents share some input variables (A4 forbids both being true simultaneously). Therefore, if there is not an edge connecting the two latents in the true graph, then OUT(x)_‖_OUT(y)|(IN(x) and IN(y)), as there would be no open path connecting OUT(L1) and OUT(L2). If there is an edge between L1 and L2 in the true graph, then OUT(x)_\‖\_OUT(y)|(IN(x) and IN(y)).
Proof of Correctness for Step 5
PC can be used because of A1, A2, and A3.
Proof of Correctness for Step 6
If an output variable has no paths to an input variable (in the pc.infinite pattern), then that output variable must be a child of only other output variables, else conditioning on observed variables would be insufficient to block all paths between the output variable and the input variables.