Implications
Rapid analytical methods such as visible reflectance spectroscopy and visible-near-infrared reflectance spectroscopy have been shown to be of interest for discriminating between pasture-fed and stall concentrate-fed lamb carcasses. However, animal feeding regimes are often more complicated in practice, which may make authentication of dietary history of animals more difficult. The present work aimed at testing and comparing the ability of these two spectroscopic methods for discriminating among carcasses of lambs from three feeding regimes (pasture-feeding, stall-feeding, and 28 days stall-finishing after pasture-feeding) in order to enlarge its application in the field.
Introduction
Grassland-based systems are regarded as more environmentally and animal-welfare friendly (Hocquette et al., Reference Hocquette, Botreau, Picard, Jacquet, Pethick and Scollan2012) and can impart healthier fatty acid composition in ruminant meat (Aurousseau et al., Reference Aurousseau, Bauchart, Calichon, Micol and Priolo2004). Also, consumers are showing increased interest in the origin and method of production of their food, and demand clear information in this regard (Prache et al., Reference Prache, Cornu, Berdagué and Priolo2005). Robust methods for ruminant meat are therefore required to authenticate the dietary history of the animals.
A number of specific compounds in the meat have been identified as biomarkers of pasture-feeding, such as carotenoid pigments (Prache and Thériez, Reference Prache and Thériez1999; Serrano et al., Reference Serrano, Prache, Chauveau-Duriot, Agabriel and Micol2006; Alvarez et al., Reference Alvarez, Vicario, Meléndez-Martínez and Alcalde2014), fatty acid composition (Aurousseau et al., Reference Aurousseau, Bauchart, Calichon, Micol and Priolo2004 and Reference Aurousseau, Bauchart, Faure, Galot, Prache, Micol and Priolo2007) and volatile compounds (Priolo et al., Reference Priolo, Cornu, Prache, Krogmann, Kondjoyan, Micol and Berdagué2004; Serrano et al., Reference Serrano, Cornu, Kondjoyan, Agabriel and Micol2011). Assay of these different components necessitates various analytical techniques, and the data often have to be further combined to overcome confounding factors and the possibility of fraud (Prache et al., Reference Prache, Kondjoyan, Delfosse, Chauveau-Duriot, Andueza and Cornu2009). However, it has been recently demonstrated that the reflectance spectrum of an animal tissue can provide a global signature of the tissue’s composition, reflecting the conditions under which the animal has been raised, and alone may contain sufficient discriminative power for the reliable authentication of the feeding regime (Dian et al., Reference Dian, Andueza, Jestin, Prado and Prache2008; Osorio et al., Reference Osorio, Downey, Moloney, Röhrle, Luciano, Schmidt and Monahan2013). Besides being reliable, these techniques are currently drawing much scientific attention because they are also rapid, cheap, noninvasive and more environment-friendly than traditional chemical methods.
Promising breakthroughs have been made in the use of spectroscopic methods on fat to discriminate pasture-fed and concentrate-fed animals. First, the measurement of the reflectance spectrum of fat tissue in the region of light absorption by carotenoid pigments (450 to 510 nm) was shown to be useful for authenticating pasture-feeding in sheep and cattle (Prache and Thériez, Reference Prache and Thériez1999; Serrano et al., Reference Serrano, Prache, Chauveau-Duriot, Agabriel and Micol2006). The investigation of the spectral signature of the fat was extended to wavelengths between 400 and 700 nm (visible region) using a portable spectrocolorimeter, and to wavelengths between 400 and 2500 nm (visible-near-infrared region) using laboratory instrumentation in combination with chemometric techniques (Dian et al., Reference Dian, Andueza, Barbosa, Amoureux, Jestin, Carvalho, Prado and Prache2007a and Reference Dian, Andueza, Jestin, Prado and Prache2008). These spectroscopic methods correctly classified the pasture-fed lambs at rates of 90.8% and 97.5% for visible reflectance spectroscopy (Vis RS) and visible-near-infrared spectroscopy (Vis-NIR RS) respectively, and the concentrate-fed lambs at rates of 98.6% and 97.8% respectively.
Nevertheless, the feeding conditions are often more complicated in practice, which may make diet authentication more difficult. For example, forage shortage at pasture may lead to a change in the feeding regime of initially pasture-fed lambs, which are often grain-finished indoors with low-carotenoid diets. Recently, Huang et al. (Reference Huang, Andueza, Oliveira, Zawadzki and Prache2015) obtained a global correct classification rate of 95.9% when using Vis RS on carcass fat to distinguish pasture-fed, concentrate-fed and concentrate-finished pasture-fed lambs. As Vis-NIR RS of perirenal fat proved more reliable than Vis RS of perirenal fat for discriminating pasture-fed lambs and stall-fed lambs (Dian et al., Reference Dian, Andueza, Jestin, Prado and Prache2008), the objective of the present study was to compare the reliability of the two spectroscopic methods (Vis RS and Vis-NIR RS) for discriminating among carcasses of lambs from three feeding regimes: pasture-feeding, stall-feeding, and 28-day stall-finishing after pasture-feeding. These treatments reflect different common lamb production systems in France and elsewhere, ranging from grazed grass to stall-feeding concentrate, and a combination of the two.
Material and methods
This study, lasting 6 years (2008 to 2013), took place at two experimental farms, Unité Expérimentale des Monts d’Auvergne (UEMA) and Unité Expérimentale des Ruminants de Theix (UERT), run by the Clermont-Ferrand/Theix INRA Centre in France. The animals were handled by specialized personnel who ensured their welfare in accordance with European Union Directive No. 609/1986.
Animals, diets and slaughter procedures
We used 189 Romane male lambs reared with three different feeding regimes: 69 were fattened outdoors with pasture (pasture-feeding) for at least 60 days (P), 55 were fattened on commercial concentrate and straw in stalls (S), and 65 were pasture-fed for at least 60 days, followed by an abrupt switch to stall-feeding with concentrate and straw for 28 additional days (PS).
The P lambs were born in spring (from 2008 to 2013), and PS lambs were born in spring 2010 and 2011. P and PS lambs were turned out to pasture from early April to late June. They were offered green grass ad libitum for at least 60 days, in line with the rate of variation of the spectral features of perirenal fat on changing from a low to a high dietary carotenoid level observed by Oliveira et al. (Reference Oliveira L, Carvalho and Prache2012). The P lambs were fattened with pasture until slaughter, which took place when they had reached a satisfactory degree of fatness. The PS lambs grazed grass until the appropriate live weight (LW) for switching to the stall diet was reached. The stall-feeding for PS lambs started between July and September for 2010, and in June for 2011. We chose a 28-day duration for the stall finishing period of PS lambs to match common on-farm management practices. Stall-finished pasture-fed lambs were expected to gain on average 7.0 kg LW during this finishing period. The pasture-feeding period lasted 101 days on average (range 60 to 146 days) for P lambs and 84 days (range 61 to 128 days) for PS lambs. S lambs were born in 2008, 2010 and 2011. They were fed ad libitum a commercial concentrate containing no green vegetative matter and corn straw. These feeds were given to PS lambs from the time of switching to the stall diet until slaughter.
Lambs were transported by truck to the abattoir located 500 m from the UERT farm and 25 km from the UEMA farm. They were electrically stunned and slaughtered by throat cut. The carcasses were stored in the dark at 4°C until 24 h postmortem.
Measurements
Animal and carcass characteristics
All lambs were weighed at birth and before slaughter. The P and PS lambs were weighed at turning-out to pasture to calculate their live weight gain (LWG) during the pasture-feeding period. The PS lambs were weighed at the time of the switch to the stall diet to calculate their LWG during the finishing period. At 24 h postmortem, carcass weight was measured, and perirenal fat was removed from the carcass and weighed. Finally, subcutaneous dorsal fat thickness was measured.
Visible reflectance spectrum of the fat (Vis RS, 400 to 700 nm)
A MINOLTA CM-700d portable spectrocolorimeter (D65 illuminant, observer angle 10°) was used to measure the reflectance spectrum of perirenal fat at wavelengths between 400 and 700 nm at 10 nm intervals. This measurement was made at 24 h postmortem, directly in the abattoir. For each sample, five replicates of the measurement were made.
Visible-near-infrared reflectance spectrum of the fat (Vis-NIR RS, 400 to 2500 nm)
For each lamb, a perirenal fat sample was taken at 24 h postmortem and packed in aluminum foil, placed in a plastic bag under vacuum, and stored at −20°C before Vis-NIR RS scanning, which was performed within 3 months post-collection. The samples were thawed at room temperature for ~2 h. The blood vessels and connective tissue were removed, and the samples were comminuted to particle sizes of ~2 to 3 mm with a Moulinex type 320 chopper. The samples were then scanned in reflectance mode (400 to 2500 nm) in a NIRSystem 6500 scanning monochromator (NIRSystems, Silver Spring, MD, USA) using the ISI software, version 3.01, from Infrasoft International (Infrasoft International, South Atherton St., State College, PA, USA). Each spectrum was averaged from 32 scans. Reflectance data were recorded at 2 nm intervals and stored as log (1/reflectance).
Plasma and fat carotenoid concentrations
Blood samples were taken from the jugular vein of each lamb at 0800 h on the day of slaughter for all the lambs, and on the day of switch to the stall diet for PS lambs, in order to measure plasma carotenoid concentration (PCC). Plasma was stored at −20°C until assay. Carotenoids were extracted from the plasma within 3 months post-collection. Full details of the estimation of PCC are given in Dian et al. (Reference Dian, Andueza, Barbosa, Amoureux, Jestin, Carvalho, Prado and Prache2007).
The fat reflectance spectrum (RS) data measured by the MINOLTA CM-700d portable spectrocolorimeter were used at wavelengths between 450 and 510 nm to calculate an index quantifying light absorption by carotenoid pigments in the fat. The reflectance spectrum was translated (TRS) to give a reflectance value at 510 nm of zero. On the TRS, the integral value (I 450–510) was calculated as follows:
 $$\eqalign{ {I_{{\rm 45}0{\minus}{\rm 51}0}} &=({\rm TRS}_{{{\rm 45}0}} /{\rm 2}{\plus}{\rm TRS}_{{{\rm 46}0}} {\plus}{\rm TRS}_{{{\rm 47}0}} \cr&{\plus}{\rm TRS}_{{{\rm 48}0}} {\plus}{\rm TRS}_{{{\rm 49}0}} {\plus}{\rm TRS}_{{{\rm 5}00}} {\plus}{\rm TRS}_{{{\rm 51}0}} /{\rm 2}){\times}\rm 10$$
where TRS i is the reflectance value of the reflectance spectrum at i nm.
I 450–510 was averaged over the five measurements. Since the mean I 450–510 values were all negative, the absolute value of the mean integral (AVMI 450–510) was used.
Statistical analysis
Animal and carcass characteristics
Animal performance variables, carcass characteristics, PCC and AVMI 450–510 all underwent ANOVA using the R software (2.15.0) to examine differences between feeding treatments. We used the Tukey test for pairwise comparisons. When necessary, data variance was stabilized using the natural logarithmic transformation; otherwise the data were analysed using non-parametric statistics (Wilcoxon and Krustall–Wallis tests).
Methods used to authenticate the dietary history of lambs
In Vis RS, the perirenal fat reflectance spectrum data measured by the MINOLTA spectrocolorimeter at wavelengths in the range 400 to 700 nm (R i , with i ranging from 400 to 700 nm) were averaged over the five replicates, transformed as absorbance values (log (1/R i )) and exported into Win ISI II version 1.6 software (Infrasoft International) for multivariate analysis. The raw absorbance spectra of samples representing the three feeding treatments underwent discriminant analysis using a partial least squares discriminant analysis (PLS-DA) approach (Tenenhaus, Reference Tenenhaus1998). In Vis-NIR RS, the perirenal fat reflectance data measured by the NIRSystems 6500 scanning monochromater at wavelengths between 400 and 2500 nm were used to discriminate P, S and PS lambs. The absorbance (log (1/reflectance)) data underwent a scatter correction using standard normal variate and detrend transformation. The first derivatized absorbance spectra underwent discriminant analysis using the PLS-DA method. Analyses were performed using Win ISI II version 1.6 software (Infrasoft International).
In both spectroscopic methods, PLS-DA was used as a classification method using dummy Y-variable values of 2 for the target category and 1 for the other categories being discriminated. Applying this procedure separately to each feeding treatment (P, S and PS) produced three models. The models were tested using a cross-validation procedure, in which a quarter of randomly chosen samples were temporally removed from the initial data set to be used for validation. Sample assignment to a feeding regime was made on the basis of the predicted Y-value, the value closest to 2 indicating the feeding regime to which the sample should be attributed. Before chemometric analysis, the data were normalized. The results of the PLS-DA analysis were expressed as correct classification rates. The identification of the wavelengths that most contributed to the models was performed using the variable importance for the projection (VIP) scores (Tenenhaus, Reference Tenenhaus1998).
A similar procedure was used to discriminate between only two feeding regimes, that is P and S lambs, P and PS lambs and S and PS lambs, using both spectroscopic methods.
A principal component analysis performed beforehand was used to rank the reflectance spectra from each feeding treatment according to the Mahalanobis distance (H) from the average reflectance spectrum in order to detect sample outliers (H>3). None were found. The number of lambs correctly and incorrectly classified underwent a χ 2 test to compare the ability of Vis RS and Vis-NIR RS to discriminate the three feeding regimes.
Results
Animal characteristics
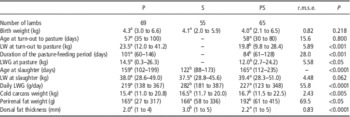
Animal characteristics for P, S and PS lambs are summarized in Table 1. Age at turn-out to pasture did not differ significantly between P and PS lambs, averaging 57 and 58 days. Live weight at turn-out to pasture, duration of the pasture-feeding period and LWG at pasture (LWGp) were higher for P lambs than for PS lambs (P<0.001, <0.001 and <0.05). For PS lambs, LWG during the stall-feeding period (LWGf) averaged 7.5 (s.d. 2.7) kg, ranging from 1.5 to 13.5 kg.
Animal and carcass characteristicsFootnote *

P=pasture-feeding; S=stall-feeding with concentrate and straw; PS=pasture-feeding followed by stall-finishing with concentrate and straw for 28 days; LW=live weight; LWG=live weight gain.
Values within a row with different superscripts differ significantly at P<0.05.
* Mean (min–max).
Plasma and fat carotenoid concentrations
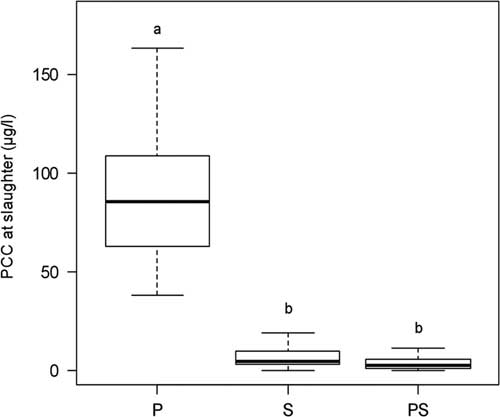
Plasma carotenoid concentration at the end of the grazing period was not significantly different between P and PS lambs (P=0.597): it averaged 90.5 µg/l (range 38.1 to 193.5 µg/l) in P lambs and 87.5 µg/l (range: 23.7 to 172.7 µg/l) in PS lambs. PCC at slaughter was affected by the feeding treatment (P<0.0001, Figure 1), being higher for P than for S (P<0.0001) and PS lambs (P<0.0001), the two latter groups being not significantly different (P=0.623). It averaged 90.5 µg/l (range 38.1 to 193.5 µg/l) in P lambs, 7.0 µg/l (range 0 to 27.2 µg/l) in S lambs, and 3.2 µg/l (range 0 to 11.4 µg/l) in PS lambs.
Boxplot of the plasma carotenoid concentration (PCC) at slaughter. The box represents the middle 50% of the data (between the 25th and 75th percentiles); the line in the box represents the median, the upper and lower lines represent the extreme values. Box plots not bearing a common letter differ significantly at P<0.05. P=pasture-fed lambs; S=stall-fed lambs; PS=stall-finished pasture-fed lambs.

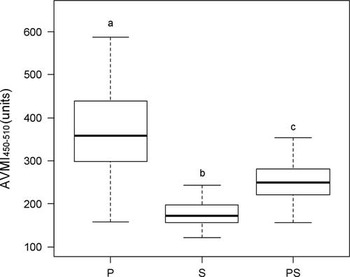
The AVMI 450–510 of perirenal fat was affected by the feeding treatment (P<0.001, Figure 2), it averaged 364.2, 181.1 and 256.0 for P, S and PS lambs, all pairwise differences being significant (P<0.001).
Boxplot of the absolute value of the mean integral (AVMI 450–510) calculated from fat reflectance spectrum data at wavelengths between 450 and 510 nm. The box represents the middle 50% of the data (between the 25th and 75th percentiles); the line in the box represents the median, the upper and lower lines represent the extreme values. Box plots not bearing a common letter differ significantly at P<0.05. P=pasture-fed lambs; S=stall-fed lambs; PS=stall-finished pasture-fed lambs.

Using visible spectroscopy (Vis RS) on perirenal fat to authenticate the dietary history of lambs
The two first PLS components explained 38% of the total variance of the absorbance data for all the lambs, PLS1 and PLS2 components explaining 21% and 17% of variability, respectively. The highest VIP scores were situated at 410 to 420 nm and 460 to 510 nm for PLS1, 460 to 520 nm and 600 to 610 nm for PLS2 (Figure 3). The PLS-DA analysis allowed a correct classification rate of 98.6%, 94.5% and 92.3% of the P, S and PS lambs, respectively (i.e. 95.1% on average).
Variable importance for the projection (VIP) scores for the first two partial least squares components (PLS1 and PLS2) for visible reflectance spectra of perirenal fat.

When considering the pairwise discriminations between only two feeding regimes, PLS-DA analyses allowed a correct classification rate of 100%, 99.2% and 96.7% when discriminating between P and S lambs, P and PS lambs and S and PS lambs, respectively.
Using visible-near-infrared spectroscopy (Vis-NIR RS) on perirenal fat to authenticate the dietary history of lambs
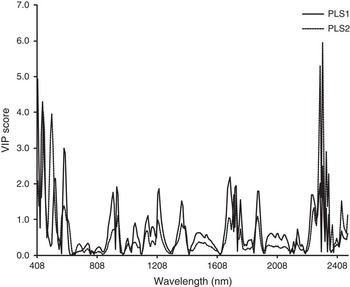
Vis-NIR RS resulted in a higher overall correct classification rate than Vis RS (99.0% v. 95.1%, P<0.05). The two first PLS components explained 35% of the total variance of the absorbance data for all lambs. PLS1 and PLS2 components explained 26% and 9% of variability, respectively. The highest VIP scores were situated at 408 to 419, 432 to 456, 584 to 592, 1208 to 1224, 1680 to 1688 and 2288 to 2304 nm for PLS1; 408, 440 to 456, 488 to 512 and 2280 to 2344 nm for PLS2 (Figure 4). The PLS-DA analysis allowed a correct classification rate of 98.6%, 100.0% and 98.5% for the P, S and PS lambs, respectively.
Variable importance for the projection (VIP) scores for the first two partial least squares components (PLS1 and PLS2) for visible-near-infrared reflectance spectra of perirenal fat.

When considering the pairwise discriminations between only two feeding regimes, PLS-DA analyses allowed a correct classification rate of 100%, 99.3% and 97.5% of lambs when discriminating between P and S lambs, P and PS lambs and S and PS lambs, respectively.
Discussion
Our study was based on measurements of carcasses sampled over 6 years and 5 months and in two geographical locations for P lambs, in order to encompass the major sources of variability, such as differences in the grazing season, grazing location and level of herbage intake by lambs at pasture. For PS lambs also, although the duration of the stall-finishing period was the same for all lambs, the large number of animals used enabled us to encompass the between-animal variability in LWGf, always inherent to this production system.
This study demonstrates that Vis-NIR RS on perirenal fat coupled with multivariate analysis is a powerful tool to authenticate the dietary history of lambs. By measuring the perirenal fat reflectance spectrum at wavelengths between 400 and 2500 nm at 2 nm intervals, and using PLS-DA as a classification method, we correctly classified 98.6%, 100% and 98.5% of P, S and PS lambs respectively. This method was therefore able to detect a 28-day dietary shift from pasture-feeding to concentrate-feeding at the end of the fattening period, and to reliably discriminate between three lamb production systems, that is from grazed grass at pasture to concentrate fed in stalls and a combination of pasture-feeding and 28-day concentrate-finishing. The ability of Vis-NIR RS for differentiating between the three feeding regimes (P, S and PS) in the present study was even better than that we observed in a previous study which aimed to differentiate only the two contrasting feeding regimes (P and S) (Dian et al., Reference Dian, Andueza, Jestin, Prado and Prache2008). The correct classification rate was 98.6% on average in the present work, against 97.7% in Dian et al. (Reference Dian, Andueza, Jestin, Prado and Prache2008). This may be explained by (i) a lower carotenoid level in the stall diet of the present study, the forage used being straw instead of hay in Dian et al. (Reference Dian, Andueza, Jestin, Prado and Prache2008), (ii) a breed effect, the Romane breed (used in the present study) probably being more able to absorb and store carotenoid pigments than the Limousine breed (used in Dian et al., Reference Dian, Andueza, Jestin, Prado and Prache2008) (Prache et al., unpublished results), and (iii) a sex effect, Dian et al. (Reference Dian, Andueza, Jestin, Prado and Prache2008) having used male and female lambs, which may have increased the variability of the animal response, whereas we used only male lambs in this work.
The overall ability of the discrimination was higher using Vis-NIR RS than using Vis RS. More precisely, the proportion of correctly classified lambs was higher for S lambs and for PS lambs using Vis-NIR RS than using Vis RS, increasing from 94.5% to 100% for S lambs and from 92.3% to 98.5% for PS lambs. The proportion of correctly classified P lambs was similar for the two methods, reaching 98.6%. It is noteworthy that the performance of Vis-NIR RS was therefore more stable across the three feeding regimes.
Examination of VIP scores of the first two partial least squares components indicates the wavelengths responsible for the differentiation of the three feeding regimes. In Vis RS, the VIP scores of the PLS1 and PLS2 components in the range 460 to 520 nm and the VIP scores of the PLS1 component at 410 to 420 nm and of the PLS2 component at 600 to 610 nm confirm the importance of carotenoid and haem pigments in the discrimination of the three feeding regimes (Prache et al., Reference Prache, Aurousseau, Thériez and Renerre1990). This result is in line with previous studies (Dian et al., Reference Dian, Andueza, Barbosa, Amoureux, Jestin, Carvalho, Prado and Prache2007a and Reference Dian, Andueza, Jestin, Prado and Prache2008; Huang et al., Reference Huang, Andueza, Oliveira, Zawadzki and Prache2015). Regarding carotenoid pigments, a study by Huang et al. (Reference Huang, Andueza, Oliveira, Zawadzki and Prache2015) using Romane male lambs demonstrated that the intensity of light absorption by carotenoids stored in the perirenal fat of previously pasture-fed lambs decreases exponentially with LWG during the stall-finishing period. A previous study demonstrated that this effect was mediated via a dilution of carotenoid pigments stored in the fat during the pasture-feeding period within whiter fat deposited during the stall-finishing period (Prache et al., Reference Prache, Priolo and Grolier2003a). The model proposed by Huang et al. (Reference Huang, Andueza, Oliveira, Zawadzki and Prache2015) predicts that mean AVMI 450–510 of the fat of previously pasture-fed lambs will decrease to a level similar to stall-fed lambs after 15.8 kg LWG on average on the stall-finishing diet. This corresponds to about 59 days when lamb daily LWG during the finishing period is 268 g/day (the present study). As the optical properties of the fat changes during fattening of lambs due to corresponding changes in fat composition, the ability of Vis RS to detect a dietary shift from pasture-feeding to concentrate-feeding need to be further investigated for various durations before slaughter. The change in carotenoid concentration after a dietary shift from pasture-feeding to concentrate-feeding is slower in perirenal fat than in plasma (Prache et al., Reference Prache, Priolo and Grolier2003a and Reference Prache, Priolo and Grolier2003b, Huang et al., Reference Huang, Andueza, Oliveira, Zawadzki and Prache2015). This explains why although all three pairwise comparisons between feeding regimes were significant for AVMI 450–510 of perirenal fat in the present study, there were no differences in PCC at slaughter between S and PS lambs.
Regarding haem pigments in perirenal fat, they are probably linked to residual haemoglobin after slaughter (Irie, Reference Irie2001). Their absorbance bands are located at wavelengths 415 to 435 nm (Soret band) and at wavelenths 540 to 580 nm (Prache et al., Reference Prache, Aurousseau, Thériez and Renerre1990; Irie, Reference Irie2001). In haemoglobin derivates, the absorbance bands are located at wavelengths 430 and 555 nm for deoxyhaemoglobin and 418, 540 to 542 and 576 to 578 nm for oxyhaemoglobin, the loss of oxygen being associated with a shift in the Soret band to a slightly higher wavelength and the loss of the bicuspid shape of the secondary peak around 555 nm (Irie, Reference Irie2001). The VIP scores of the PLS2 component at 600 to 610 nm may be due to differences in haeminic pigments’ oxidation level (Prache et al., Reference Prache, Aurousseau, Thériez and Renerre1990). A possible explanation for the implication of haem pigments in the discrimination between P, S and PS lambs could be differences between feeding regimes in the sensitivity of animal tissues, cell membranes and pigments to oxygen radicals. Oxygen radicals induce oxidation of lipid and haem pigments present in the fat, decrease the proportion of light reflected by the fat and increase the fragility of red blood cells (Aurousseau et al., Reference Aurousseau2002). A high level of nutrition, as is the case with S feeding regime, increases the level of oxidative damage to animal tissues and cell membranes and the sensitivity to postmortem oxidation; it has been shown to induce brown colour defects in lamb adipose tissue (Prache et al., Reference Prache, Aurousseau, Thériez and Renerre1990; Aurousseau et al., Reference Aurousseau2002). On the reverse, pasture-feeding results in the transfer of radical trapping agents (vitamin E and carotenoid pigments) from forage to animal tissues (Descalzo et al., Reference Descalzo, Insani, Biolatto, Sancho, Garcia, Pensel and Josifovich2005; Ripoll et al., Reference Ripoll, González-Calvo, Molino, Calvo and Joy2013), which protect animal tissues, cell membranes and pigments from oxygen radicals (Aurousseau et al., Reference Aurousseau2002).
In Vis-NIR RS, in addition to carotenoid and haem pigments (VIP scores for PLS1 and PLS2 components at wavelengths in the range 408 to 592 nm), the VIP scores of the PLS1 and PLS2 components at wavelengths in the ranges 1208 to 1224, 1680 to 1688 and 2280 to 2344 nm suggest the implication of molecular groups related to fatty acids of perirenal fat in the discrimination. The fatty acid composition of the fat actually strongly depends on the feeding regime. Compared with stall-feeding, pasture-feeding leads to a higher content of healthy fatty acids (FAs) such as alpha-linolenic acid and conjugated linoleic acids and lower n-6 polyunsaturated FAs/n-3 polyunsaturated FAs, together with a lower content of palmitic acid, which is pro-atherogenic (Aurousseau et al., Reference Aurousseau, Bauchart, Calichon, Micol and Priolo2004). In a further study, Aurousseau et al. (Reference Aurousseau, Bauchart, Faure, Galot, Prache, Micol and Priolo2007) demonstrated the extent to which the FA composition of the fat changed after an abrupt change in the feeding regime (from pasture-feeding to concentrate-feeding indoors), depending on the duration of the finishing period indoors.
Even though the experimental design was prone to produce variability between replicates, particularly for P and PS lambs, only two of the 189 lambs used in this study were misclassified by Vis-NIR RS. We have considered some possible explanations for these misclassifications. One of these lambs belonged to the P feeding regime, the second to the PS feeding regime. The P lamb incorrectly classified as belonging to the PS feeding regime had a low carotenoid content in perirenal fat, as indicated by the value of the index quantifying light absorption by carotenoid pigments in the fat (231 units for AVMI 450–510, which is closer to the mean value for PS lambs than to the mean value for P lambs). As it has been shown, in lambs fed controlled levels of carotenoid pigments, that AVMI 450–510 increased linearly with PCC (Dian et al., Reference Dian, Andueza, Jestin, Prado and Prache2007b), misclassification of this P lamb may therefore be partly explained by a low ability of absorption of carotenoid pigments, as its PCC at slaughter was relatively low (64.4 µg/l, whereas the mean value for P lambs was 90.5 µg/l). The PS lamb incorrectly classified as belonging to the S feeding treatment had a low carotenoid content in perirenal fat at slaughter (168 units for AVMI 450–510, which is closer to the mean value for S lambs (181 units) than to the mean value for for PS lambs (256 units)). This lamb had a relatively high LWGf (9.0 kg, whereas the mean value for PS lamb was 7.5 kg), which has been shown to negatively affect AVMI 450–510 due of a dilution of carotenoid pigments stored in the fat during the pasture-feeding period within whiter fat deposited during the stall-finishing period (Huang et al., Reference Huang, Andueza, Oliveira, Zawadzki and Prache2015); additionally this lamb had a relatively low PCC at the end of the grazing period (67.2 µg/l, whereas the mean value for PS lambs was 87.5 µg/l), indicating a relatively low ability to absorb carotenoid pigments. Misclassification of this PS lamb may therefore be partly explained by both a relatively low ability of absorption of carotenoid pigments and a relatively high dilution of pigments stored in the fat.
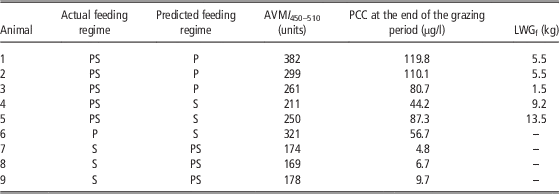
There were nine misclassifications observed using Vis RS (Table 2); three PS lambs (Animals 1, 2 and 3) were incorrectly classified as belonging to the P feeding regime. Animal 1 had a relatively high carotenoid content in perirenal fat, as indicated by the value of the index quantifying light absorption by carotenoid pigments in the fat (382 units for AVMI 450–510, which is closer to the mean value for P lambs than to the mean value for PS lambs). Misclassification of this P lamb may be partly due to both a relatively high ability of absorption of carotenoid pigments (as indicated by a relatively high PCC at the end of the grazing period before the switch to the stall diet) and a relatively low dilution of pigments stored in the fat (as indicated by a relatively low LWGf.). Similar explanations may be put forward to explain misclassification of Animal 2. Regarding Animal 3, its ability to absorb carotenoid pigments was average (as indicated by the value of PCC at the end of the grazing period before the switch to the stall diet, which is very close to the mean value for PS lambs). Misclassification of this PS lamb may be partly due to a very low dilution of pigments stored in the fat, the value of LWGf for this lamb (1.5 kg) being the lowest observed among the 65 PS lambs. Two other PS lambs were incorrectly classified as belonging to the S feeding regime. Animal 4 had a relatively low carotenoid content in perirenal fat, as indicated by the value of AVMI 450–510 (211 units, whereas the mean value for PS was 256). Misclassification of this PS lamb may be partly due to both a relatively low ability of absorption of carotenoid pigments (as its PCC at the end of the grazing period before the switch to the stall diet was relatively low) and a relatively high dilution of pigments stored in the fat (as its LWGf was relatively high). Regarding Animal 5, its ability to absorb carotenoid pigments was average (as indicated by the value of PCC at the end of the grazing period before the switch to the stall diet, which is very close to the mean value for PS lambs). Misclassification of this PS lamb may be partly due to a very high dilution of pigments stored in the fat, the value of LWGf for this lamb (13.5 kg) being the highest observed among the 65 PS lambs. The one P sample incorrectly classified as belonging to the S feeding regime (Animal 6) had a relatively low carotenoid content in perirenal fat, as indicated by the value of AVMI 450–510 (321 units, whereas the mean value for P lambs was 364). One of the reason for misclassification of this lamb may be a relatively low ability to absorb carotenoid pigments (as its PCC at slaughter was 56.7 µg/l, whereas the mean value for P lambs was 90.5 µg/l). For the three S lambs incorrectly classified as belonging to the PS feeding regime, there were no obvious reasons for misclassification, the values of AVMI 450–510 and PCC at slaughter being close to the average values for S lambs.
Characteristics of the animals misclassified using visible reflectance spectroscopy

P=pasture-feeding; S=stall-feeding with concentrate and straw; PS=pasture-feeding followed by a stall-finishing for 28 days; AVMI 450–510=absolute value of the mean integral of the translated spectrum between 450 and 510 nm; PCC=plasma carotenoid concentration; LWGf=live weight gain during the stall-finishing period.
Conclusion
The present study demonstrates the huge potential of spectroscopic methods combined with the application of chemometrics for the authentication of the animal’s dietary history in ruminant meat. Both spectroscopic methods successfully discriminated between perirenal fat of lambs reared with three different feeding regimes matching common on-farm management practices, ranging from grazed grass at pasture to a concentrate diet indoors and a combination of pasture-feeding followed by concentrate-finishing for 28 days. Vis RS and Vis-NIR RS succeeded in correctly assigning 95.1% and 99.0% of the perirenal fat samples to their feeding regime, and were therefore able to detect a 28-day dietary shift from pasture-feeding to concentrate-feeding. The higher proportion of correctly classified lambs using Vis-NIR RS compared with Vis RS is most likely due to the fact that Vis-NIR RS provides more complete optical information than Vis RS. As the optical properties of the fat probably changes during fattening of lambs due to corresponding changes in fat composition, future research will be targeted at evaluating the ability of Vis RS and Vis-NIR RS to detect a dietary shift from pasture-feeding to concentrate-feeding for various durations before slaughter.
Acknowledgements
The authors thank L. Lavelle, J. Ballet, T. Devincenzi, P. Payard, D. Roux, C. Coustet, S. Faure, F. Picard and all the staff of the INRA, UE1153 Unité Expérimentale des Monts d’Auvergne and of the INRA, UE1354 Unité Expérimentale des Ruminants de Theix for their cooperation in this work. This work was carried out with the financial support of the ‘ANR- Agence Nationale de la Recherche - The French National Research Agency’ under the ‘Programme Agriculture et Développement Durable’, project ‘ANR-05-PADD-012, Promotion du Développement Durable par les Indications Géographiques PRODDIG’ and of the European Community under the Seventh Framework Program for Research, Technological Development and Demonstration Activities, for the Integrated Project LOWINPUTBREEDS FP7-CP-IP 222623. L. de Oliveira thanks the Brazilian Ministry of Education ‘Coordenação de Aperfeiçoamento de Pessoal de Nível Superior’ (CAPES) for financial assistance via CAPES/COFECUB Project 684/10. F. Zawadzki thanks the Brazilian Ministry of Science and Technology ‘Conselho Nacional de Desemvolvimento Cientifíco e Tecnológico’ (CNPq) for financial support via CNPq Project grant 201094/2011-8.