1 Introduction
It may appear that the continuous vector fields of fluid flow are not good candidates for the identification of individual structures, but the search for features that explain a substantial fraction of the flow dynamics while covering a relatively small fraction of the volume has been a recurrent theme in fluid mechanics. We intuitively recognise waves in the sea, eddies in rivers, and clouds in the sky. The identification is harder in the chaotic velocity distributions of turbulent flows, but even there the description of the dynamics in terms of ‘eddies’ began early (Richardson Reference Richardson1920), and accelerated with the advent of numerical simulations. The structural view of turbulent shear flows has recently been reviewed by Brown & Roshko (Reference Brown and Roshko2012) away from walls, and by Jiménez (Reference Jiménez2018) near them. Curiously, the structures of the nominally simpler case of homogeneous turbulence have been investigated less, and, while vortices have been considered often (Vincent & Meneguzzi Reference Vincent and Meneguzzi1991; Jiménez et al. Reference Jiménez, Wray, Saffman and Rogallo1993), there is clear evidence of larger kinetic-energy structures (Cardesa, Vela-Martín & Jiménez Reference Cardesa, Vela-Martín and Jiménez2017) which are not necessarily related to the vorticity.
However, the way in which these structures were initially identified deserves some discussion. Consider the case of wall turbulence. Its best-known structures are streaks and quadrants. Both are known to be dynamically significant (Jiménez Reference Jiménez2018), but neither was originally identified from dynamical considerations. Streaks were educed from the behaviour of scalar tracers (Kline et al. Reference Kline, Reynolds, Schraub and Runstadler1967) and quadrants were proposed because they are intense concentrations of a quantity, the tangential Reynolds stress, whose mean value is dynamically significant (Lu & Willmarth Reference Lu and Willmarth1973). Both approaches are valid, but they raise the question of whether these really are the most significant structures in the flow, and even whether we may be missing other dynamically relevant features.
The purpose of this paper is to discuss whether it is possible to decide, at least in principle, if some parts of the flow are more significant than others, and to explore means of identifying them. We should first distinguish between representativeness and significance. Most of the examples mentioned above are structures chosen as representative of some property, in the sense, for example, that flow regions with a particularly high kinetic energy may be considered to be representative of the kinetic energy of the flow. This is connected with the concept of intermittency, in which a substantial fraction of some intensive quantity is concentrated in a small fraction of the volume. Intermittency is probably related to the relevance of those regions to the dynamics, but the two concepts are different. For example, it was noted by Jiménez (Reference Jiménez2018) that the intermittency of a variable depends on how it is processed. The modulus of the velocity is much less intermittent than its square (i.e. the kinetic energy), even if both represent the same physical quantity. We define significance as the influence of a feature on the future evolution of the flow. Specifically, after preparing an initial condition, we define significant subsets with a given volume as those whose modification produces a large divergence in the flow behaviour after some time.
Inspired by the recent proliferation of large-scale data analyses, we discuss a strategy of ‘blindly’ choosing subsets of the flow, determining their significance, and examining the properties of those found to be most significant.
This approach is not entirely novel. Modification of parts of a system and observation of the consequences is a classical approach in the natural sciences. An early example in free-shear flows is the work of Cimbala, Nagib & Roshko (Reference Cimbala, Nagib and Roshko1988), where the coherent structures of a turbulent wake were artificially damped to test whether they were due to a local instability or leftovers from transition. In wall turbulence, Jiménez & Pinelli (Reference Jiménez and Pinelli1999) modified different terms of the evolution equations in simulations of turbulent channels to observe their effect. Both cases can be considered to be examples of ‘a posteriori’ testing, in which structures believed to be significant are tested to be so. In contrast, the procedure in this paper could be considered to be ‘a priori’, in the sense that parts of the flow are tested blindly and, if especially significant ones are identified, their properties are examined.
Our approach is a variant of unsupervised reinforcement machine learning, although it will become clear that part of the learning loop is still reserved for the human researcher. In the more common supervised approach, an algorithm is trained with samples of a known pattern, e.g. pictures, and asked to recognise that pattern in subsequent cases. In unsupervised learning, there is no training set, and the algorithm is expected to identify patterns ‘without guidance’. Even in this case, a goal has to be specified. A common approach is to define a ‘correct’ answer in the form of a reward, and instruct the algorithm to maximise it. The best-known examples are strategy games, such as chess or Go (Silver et al. Reference Silver, Schrittwieser, Simonyan, Antonoglou, Huang, Guez, Hubert, Baker, Lai, Bolton, Chen, Lillicrap, Hui, Sifre, van den Driessche, Graepel and Hassabis2017), in which the winning criterion is part of the rules, and the machine is instructed to improve its strategy by playing against itself. In our case, the correct answer is codified in the similarity of two flow fields, one of which is defined to be correct, and the rules of the ‘game’ are the equations of motion.
The main difficulty of this programme is cost, because many candidate subsets have to be tested, and the procedure is only useful if it is applied to enough flow fields to permit meaningful statistics. If we assume, for example, that the flow field is divided into
 $N$
cells, and that subsets involve
 $n<N$
cells, the number of possible combinations is the binomial coefficient
 $\binom{N}{n}$
, which soon becomes impractically large. Luckily, the tests on different cases are independent of one another, and, depending on the particular search algorithm employed, the same is true for individual subsets. This means that they can be trivially parallelised in multiprocessor computers.
Some simplifications are still required for the sake of economy, and we use an approximate search related to the ‘random forest’ schemes used in automatic classification (Breiman Reference Breiman2001). However, our emphasis is not on optimising the search algorithm, for which many references exist (LeCun, Bengio & Hinton Reference LeCun, Bengio and Hinton2015), but on testing whether the machine-aided learning strategy gives reasonable answers in the context of flow evolution. To make the problem tractable, we use the example of homogeneous two-dimensional turbulence in a periodic box, whose simulation is reasonably cheap. Its significant structures, compact vortices, are also believed to be well understood (McWilliams Reference McWilliams1990), providing a convenient check for the performance of the algorithm. Section 2 details the identification algorithm. Its application to two-dimensional turbulence is discussed in § 3, and § 4 concludes. Algorithmic and performance details are deferred to appendix A.
2 Proper labelling
The result of applying the above strategy to a given flow field is its segmentation into subsets labelled as more or less significant for some particular application, and we will refer to labellings that are optimal in this sense as ‘proper’. We consider the following algorithm.
(PL1) Construct a reference initial flow field,
 $g_{ref}(\boldsymbol{x},t=t_{ref})$
, and choose a target time,
$t=t_{ref}+T$
.
(PL2) Create a test field
$\widetilde{g}$
by substituting
$g_{ref}$
by something else over a subset
$A$
covering a fixed fraction of the domain volume, e.g.
$\widetilde{g}(A,t=t_{ref})=0$
.(PL3) Evolve both
$g_{ref}$
and
$\widetilde{g}$
to
$t=t_{ref}+T$
, using the equations of motion.(PL4) Iterate over
$A$
, and label as most significant the subset maximising (or minimising) the magnitude of the resulting perturbation,
$\unicode[STIX]{x1D700}(T)=\Vert \widetilde{g}(t_{ref}+T)-g_{ref}(t_{ref}+T)\Vert$
.






This definition is ambiguous in several respects, the most obvious being the freedom of how to modify the test field in step PL2. This freedom is not absolute, because the resulting flow field has to satisfy, for example, continuity, but the way in which such constraints are enforced only adds choices to the procedure. Another choice is the perturbation norm in PL4. We use in this paper the
 $L_{2}$
norm of the velocity field, but enstrophy or some measure of scalar mixing could be equally valid, and would probably give different results.
Another question is whether to consider as significant the subsets resulting in the maximum or the minimum deviation. Both cases are interesting, because one of the questions to be answered is whether there really exist parts of the flow that are more significant than others. The ratio between the two extreme deviations,
 $R_{\unicode[STIX]{x1D700}}=\unicode[STIX]{x1D700}_{max}/\unicode[STIX]{x1D700}_{min}$
, is a figure of merit that characterises the existence of significant structures, and therefore the coherence properties of the flow field as a whole. Finally, the above algorithm labels a single reference initial condition. The most interesting questions depend on applying it to many such cases, and abstracting from the results the statistical characteristics that define significant subsets.
The above procedure is related to the Lyapunov analysis of dynamical systems, whose aim is to identify the maximum growth rate of infinitesimal perturbations. However, it differs from it in three important aspects. In the first place, our perturbations are not infinitesimal, since they are intended to model the nonlinear evolution of turbulence. The mathematical theory for finite-amplitude perturbations is not as developed as for infinitesimal ones (Eckmann & Ruelle Reference Eckmann and Ruelle1985), but they have been used to characterise predictability (Cencini & Vulpiani Reference Cencini and Vulpiani2013). Second, Lyapunov analysis searches for properties of the dynamical system in the long-time limit, while we are interested in labelling significant regions of individual realisations after a finite evolution time. Any information is thus linked to a particular flow field and a given time horizon, and generic properties only arise after ensemble averaging over many realisations (Ding & Li Reference Ding and Li2007). Lastly, and most importantly, Lyapunov analysis seeks to identify optimal perturbations, while we restrict ourselves to perturbations within the prescribed support of the subset
 $A$
. This is required to represent individual structures, of which several may exist in any given flow realisation, but the perturbation growth is necessarily suboptimal.
(a) Premultiplied vorticity spectra of the simulations at the two times used as references. The wavelength,
 $\ell =2\unicode[STIX]{x03C0}/k$
, is defined from the wavenumber magnitude
 $k$
; ——,
 $t=0$
; – – –,
 $\unicode[STIX]{x1D714}_{0}^{\prime }t=11$
; – ⋅ – ⋅ –,
 $\unicode[STIX]{x1D714}_{0}^{\prime }t=26$
. The line with symbols is the premultiplied energy spectrum at
 $\unicode[STIX]{x1D714}_{0}^{\prime }t=11$
. (b) Velocity and vorticity magnitude of the reference field at
 $\unicode[STIX]{x1D714}_{0}^{\prime }t=11$
. The overlaid grid is used to select the test subsets. (c) As in (b), for
 $\unicode[STIX]{x1D714}_{0}^{\prime }t=26$
.

3 Application to two-dimensional turbulence
To illustrate the procedure, we apply it to the relatively simple case of identifying the most and least significant features of decaying isotropic two-dimensional turbulence. Simulations are performed in a doubly periodic square box of side
 $L=2\unicode[STIX]{x03C0}$
using a standard spectral Fourier code dealiased by the
 $3/2$
rule. Time advance is third-order Runge–Kutta. The flow is defined by its velocity field
 $\boldsymbol{u}=(u,v)$
as a function of
 $\boldsymbol{x}=(x,y)$
. The one-component vorticity is
 $\unicode[STIX]{x1D714}=\unicode[STIX]{x2202}_{x}v-\unicode[STIX]{x2202}_{y}u$
and the rate of strain tensor is
 $\unicode[STIX]{x1D634}_{ij}=(\unicode[STIX]{x2202}_{i}u_{j}+\unicode[STIX]{x2202}_{j}u_{i})/2$
, where the subindices of the partial derivatives range over
 $(x,y)$
and those of the velocity components over
 $(u,v)$
. Its magnitude is defined by
 $S^{2}=\unicode[STIX]{x1D634}_{ij}\unicode[STIX]{x1D634}_{ij}$
, where repeated indices imply summation. The natural time and velocity scales are respectively the root-mean-square vorticity magnitude
 $\unicode[STIX]{x1D714}^{\prime }=\langle \unicode[STIX]{x1D714}^{2}\rangle ^{1/2}$
, where the time-dependent average
 $\langle \cdot \rangle$
is taken over the full computational box, and
 $q^{\prime }=(u^{\prime 2}+v^{\prime 2})^{1/2}$
. A Taylor length scale can be defined as
 $\unicode[STIX]{x1D706}=q^{\prime }/\unicode[STIX]{x1D714}^{\prime }$
.
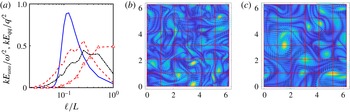
The flow is initialised with a fixed spectrum and random Fourier phases, and allowed to evolve until structures have established themselves (figure 1). To investigate the scaling of the different quantities, two initial reference times are used,
 $\unicode[STIX]{x1D714}_{0}^{\prime }t_{11}=11$
and
 $\unicode[STIX]{x1D714}_{0}^{\prime }t_{26}=26$
, where the subindex denotes the moment at which a variable is measured. As the simulation proceeds, the vorticity decays to
 $\unicode[STIX]{x1D714}_{11}^{\prime }/\unicode[STIX]{x1D714}_{0}^{\prime }=0.67$
and
 $\unicode[STIX]{x1D714}_{26}^{\prime }/\unicode[STIX]{x1D714}_{0}^{\prime }=0.47$
. The kinetic energy decreases more slowly, and the Taylor scale grows from
 $\unicode[STIX]{x1D706}_{0}/L=0.03$
to
 $\unicode[STIX]{x1D706}_{11}/L=0.04$
and
 $\unicode[STIX]{x1D706}_{26}/L=0.05$
. Comparing these values with the vorticity fields in figure 1(b,c) and the spectra in figure 1(a),
 $\unicode[STIX]{x1D706}$
corresponds to the thickness of the thinnest vorticity filaments, and is a few times smaller than the structures containing most of the enstrophy. The kinematic viscosity
 $\unicode[STIX]{x1D708}$
is set to
 $q_{0}^{\prime }L/\unicode[STIX]{x1D708}=2500\,(q_{11}^{\prime }\unicode[STIX]{x1D706}_{11}/\unicode[STIX]{x1D708}\approx 90)$
and the simulation uses
 $85^{2}$
complex Fourier modes. The numerical resolution expressed in terms of Fourier modes improves from
 $\unicode[STIX]{x0394}x/\unicode[STIX]{x1D706}=0.14$
at
 $t_{11}$
to 0.11 at
 $t_{26}$
, and there are approximately eight grid points across the smallest vorticity structures during the time of the experiment. The energy spectrum included in figure 1(a) shows that the scale disparity between energy and enstrophy is approximately half a decade.
As shown in figure 1(b,c), the field is divided into a regular grid for the modification step PL2, and subsets of a given number of cells of this grid are tested by zeroing their vorticity at time
 $T=0$
. This is convenient in two-dimensional flow because vorticity is not subject to continuity constraints, but spatial periodicity requires that
 $\langle \unicode[STIX]{x1D714}\rangle =0$
. This is enforced by adding an appropriate constant,
 $\unicode[STIX]{x1D714}_{00}$
, to the whole flow field,
 $$\begin{eqnarray}\displaystyle \widetilde{\unicode[STIX]{x1D714}}=\left\{\begin{array}{@{}ll@{}}\unicode[STIX]{x1D714}_{00} & \text{in}~A,\\ \unicode[STIX]{x1D714}_{ref}+\unicode[STIX]{x1D714}_{00} & \text{otherwise}.\end{array}\right. & & \displaystyle\end{eqnarray}$$
To test the effect of cell size, we use grids with
 $N=16~(4\times 4)$
,
 $N=36~(6\times 6)$
and
 $N=100~(10\times 10)$
. The effect of changing the modification strategy is discussed in § 3.1.
(a) Evolution of the largest (solid) and smallest (dashed) deviation norms after deleting subsets of ○,
 $n=1$
; ▫, 3; ▵, 7 cells, out of 36. The bars show the standard deviation of the variability over 48 initial conditions (192 for
 $n=1$
). (b) As in (a), for the significance ratio
 $R_{\unicode[STIX]{x1D700}}=\unicode[STIX]{x1D700}_{max}/\unicode[STIX]{x1D700}_{min}$
. The dashed line with circles is
 $n=1$
, with cells deleted by zeroing the velocity instead of the vorticity, as in (3.3). (c) Outlined in white is the most significant subset of
 $n=3$
cells out of
 $N=36$
, defined at
 $\unicode[STIX]{x1D714}_{11}^{\prime }(t-t_{11})=3.4$
and overlaid on the vorticity magnitude. The least significant subset is outlined in red. (d) As in (c). Darkened cells belong to at least one of the 10 most significant subsets. The two cells heavily outlined in white belong to all of them.

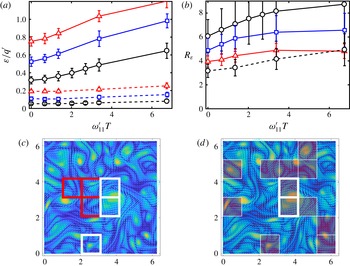
Figure 2(a) shows the evolution of the perturbation magnitude for the most and least significant subsets of
 $n$
cells in an
 $N=36$
test grid. It suggests that significance is largely a matter of representation, and that the deviation after some time is roughly proportional to the representation difference at
 $T=0$
, but figure 2(b) tells a slightly different story. It shows that the ratio
 $R_{\unicode[STIX]{x1D700}}$
between the largest and smallest deviation norms from subsets of a given size is relatively large, and that it increases with the evolution time at which it is measured, at least up to
 $\unicode[STIX]{x1D714}^{\prime }T\approx 4$
. The former proves that there are flow regions that are substantially more significant than others, while the latter shows that significance to the flow evolution involves more than initial representativeness. There are flow regions that have a stronger effect on the evolution of the flow than what could be expected from the energy that they contain. Figure 2(b) also shows that the subsets that are most effective in determining significance are the smallest ones,
 $n=1$
. This is reasonable, at least on average, because there would be in general a most and a least significant grid point in each flow field, and modifying more grid points dilutes their significance.
Figure 2(c) shows an example of the most and least significant subsets with
 $n=3$
and
 $N=36$
, measured at
 $\unicode[STIX]{x1D714}_{11}T=3.4$
, and illustrates the tendency of even these small subsets to be formed by collections of smaller ones. It turns out that there are often several subsets with very similar significance. For the case in figure 2(c,d),
 $\unicode[STIX]{x1D700}_{max}/\unicode[STIX]{x1D700}_{min}=5.45$
, but the ratio between the lowest and the 10th lowest deviation (out of approximately 7000 possible combinations) is approximately 1.1, and that between the highest and the 10th highest deviation is 1.07. This is a common feature of optimisation over many degrees of freedom (LeCun et al.
Reference LeCun, Bengio and Hinton2015), but, at least in this particular case, it appears to be connected with the sharing of significant substructures among subsets. Figure 2(d) shows the union of the 10 most significant subsets. Their component cells are scattered across the flow, but the two cells heavily outlined in white are present in all of the subsets, suggesting that the search algorithm identifies individual significant cells and forms with them larger connected composite substructures.
Connected substructures of more than one cell form by chance even in Poisson-distributed sets of cells, and how different significant sets are from random ones can be characterised by comparing the probability distribution (p.d.f.) of the number,
 $n_{s}$
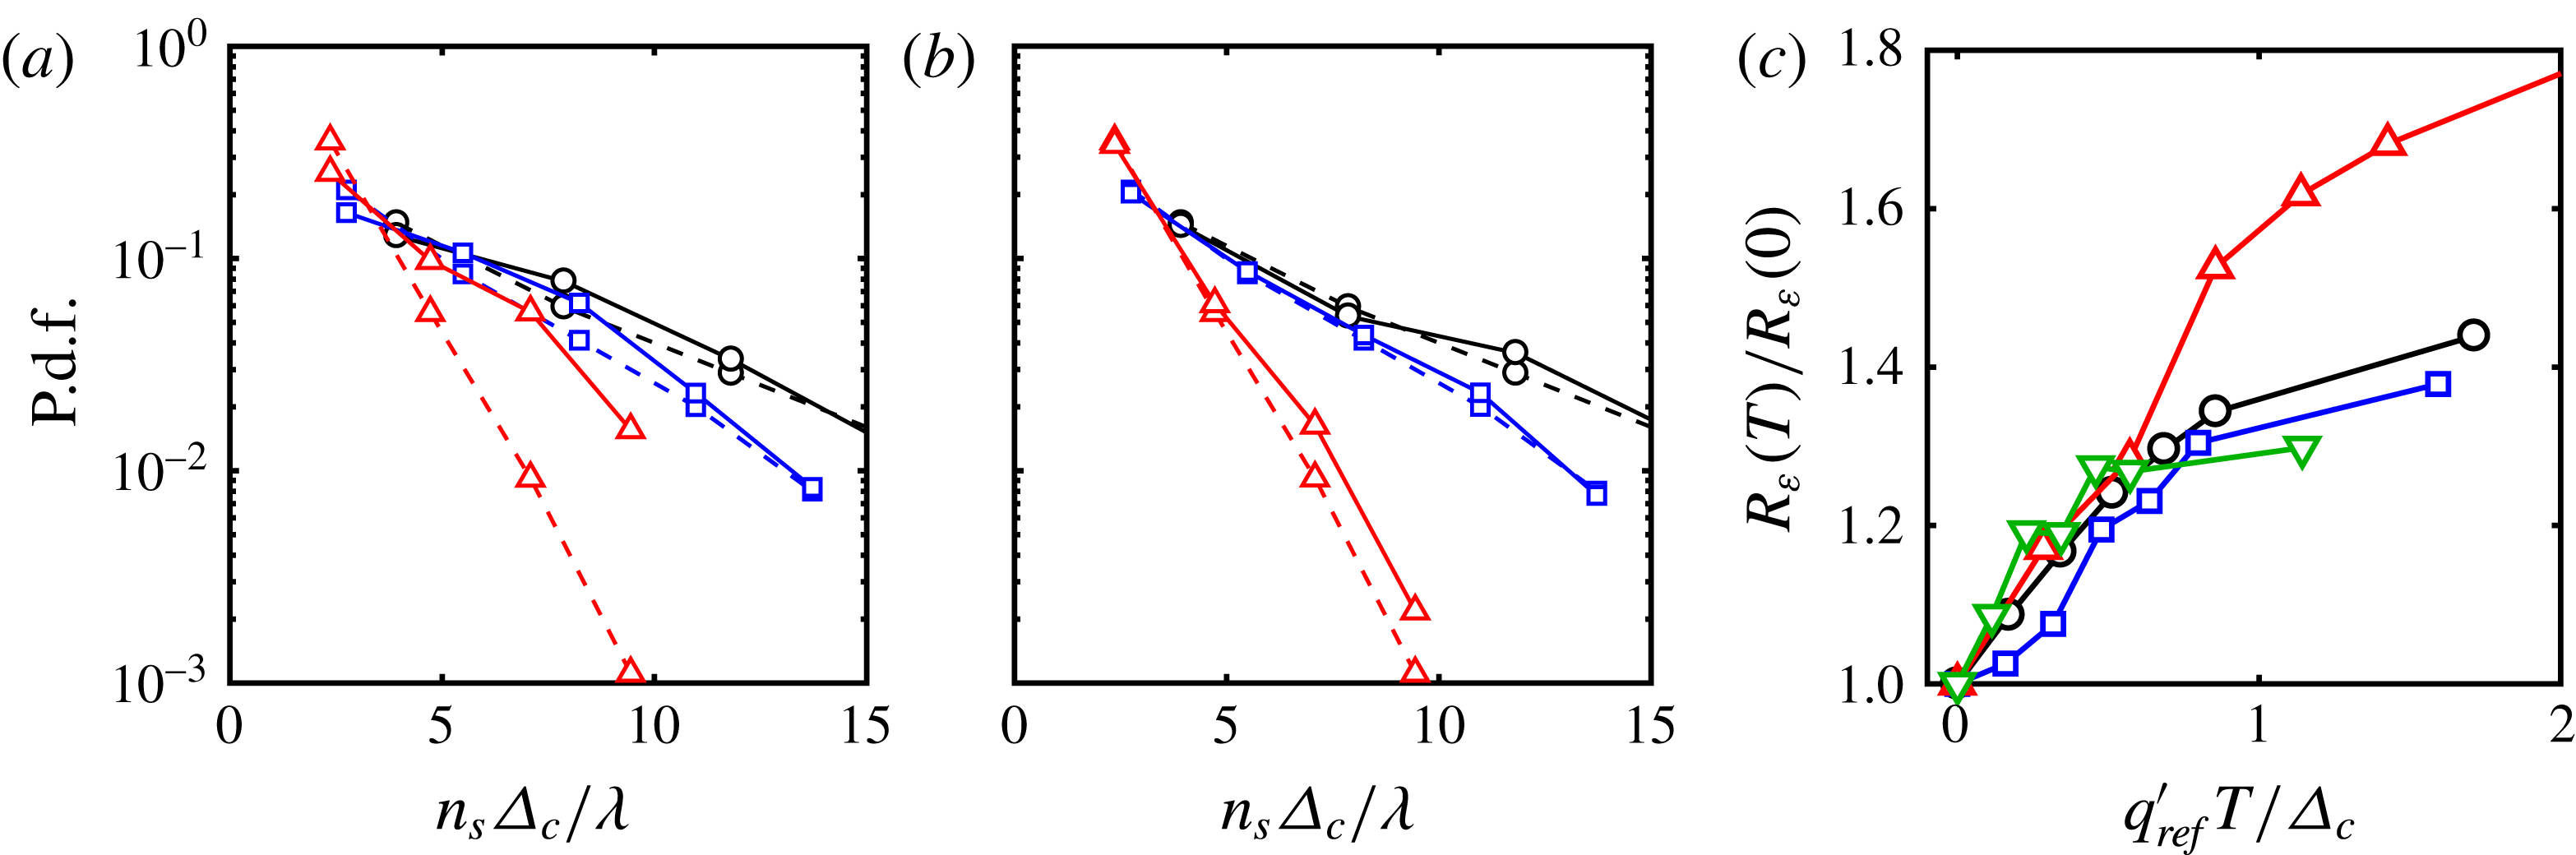
, of cells in their connected substructures. Defining connectivity by the eight nearest neighbours, this is done in figure 3(a,b) for the most and least significant subsets respectively. They behave differently. Figure 3(a) shows that the connected substructures of the most significant sets tend to be larger than random ones. This difference scales best with the ratio of the length
 $n_{s}\unicode[STIX]{x1D6E5}_{c}$
to the Taylor microscale, where
 $\unicode[STIX]{x1D6E5}_{c}=L/N^{1/2}$
is the cell size, and is maximum for intermediate sizes of the order of the diameter of individual vortices. Not shown in the figure is another interesting difference. If the inertial tensor of a connected substructure is computed by substituting cells by unit point masses, an elongation can be defined by the ratio of its two principal moments of inertia. Random sets tend to be approximately circular, with elongations close to unity, but the most significant subsets are more elongated. This is especially true for the grid that is finest with respect to the Taylor scale, which is also the one in which the distribution of component size differs most from the random case (triangles in figure 3
a). The simplest interpretation is that finer grids are able to adapt the shape and size of significant sets to the shape of the strained vortices seen in figure 1. The tendency to group cells into linear filaments is also reflected in the empirically best scaling length for the abscissae in figure 3(a,b), which is the linear length of
 $n_{s}$
elements of size
 $\unicode[STIX]{x1D6E5}_{c}$
, rather than the diameter,
 $n_{s}^{1/2}\unicode[STIX]{x1D6E5}_{c}$
, of a blob with the same number of elements.
Figure 3(b) shows that most of these observations do not apply to the least significant subsets, whose distribution of connected substructures is essentially the same as for Poisson sets. It is also true that their elongations are much closer to unity than for the most significant subsets. The comparison suggests that, while the most significant sets reflect the structure of the flow, with specific geometries and sizes, the least significant ones tend to be random collections of background cells.
The effect of deleting cells is not simply additive. Different cells tend to cancel one another, and the effect of a small number of cells is weaker than the sum of its individual components. Additivity improves for longer test times, presumably because the effect of different components decorrelates. For example, in the cases in figure 2, the effect at
 $T=0$
of deleting the most significant subset of three cells is approximately 1.6 times weaker than the sum of the effects of the three most significant single cells, but that factor is 1.3 for
 $\unicode[STIX]{x1D714}_{11}T=3.4$
and almost unity for
 $\unicode[STIX]{x1D714}_{11}T=6.7$
.
(a) Size distribution of the connected components in the 10 most significant subsets with
 $n=5$
(solid), compared with the equivalent distribution for random sets of cells (dashed). (b) As in (a), for the 10 least significant subsets. (c) Significance ratio measured at
 $T=t-t_{ref}$
, normalised with its value at
 $T=0$
. Here,
 $n=1$
. Time is scaled with the eddy turnover at the cell size,
 $\unicode[STIX]{x1D6E5}_{c}$
. In all panels: ▵,
 $(N,t_{ref},\unicode[STIX]{x1D6E5}_{c}/\unicode[STIX]{x1D706})=(100,t_{11},2.4)$
; ▫,
 $(36,t_{26},2.8)$
; ○,
 $(36,t_{11},4)$
; ▿,
 $(16,t_{11},6)$
.

Figure 3(c) shows the temporal evolution of the significance ratio with the test time
 $T$
for several test cases and
 $n=1$
. It follows from figure 2(b) that the evolution of this ratio is relatively independent of
 $n$
, although its absolute value depends strongly on the size of the subset and on other details of the initial conditions. To compensate for this dependence, the ratio is normalised in figure 3(c) with its value at
 $T=0$
. The time in this figure scales best with the turnover time associated with the cell size,
 $\unicode[STIX]{x1D6E5}_{c}$
, rather than with the blob diameter,
 $n_{s}^{1/2}\unicode[STIX]{x1D6E5}_{c}$
, especially for times of the order of a turnover. This suggests that the labelling procedure isolates features of the order of
 $\unicode[STIX]{x1D6E5}_{c}$
, implying again thin filaments rather than blobs.
3.1 The effect of different modification strategies
Up to now we have discussed tests in which the whole flow field is modified in step PL2 of the labelling algorithm, following (3.1). A different option would be
 $$\begin{eqnarray}\displaystyle \widetilde{\unicode[STIX]{x1D714}}=\left\{\begin{array}{@{}ll@{}}\unicode[STIX]{x1D714}_{00} & \text{in}~A,\\ \unicode[STIX]{x1D714}_{ref} & \text{otherwise},\end{array}\right. & & \displaystyle\end{eqnarray}$$
where only the test subset is changed. This was found to make no appreciable difference with respect to (3.1), most probably because
 $\unicode[STIX]{x1D714}_{00}$
is typically much smaller than
 $\unicode[STIX]{x1D714}^{\prime }$
.
A more interesting possibility is to zero the velocity field within the chosen cells, in which case continuity has to be taken into account because streamlines are truncated at the edge of the cell. This option was also tested, projecting the modified field onto the solenoidal subspace by means of a pressure-like gradient,
 $$\begin{eqnarray}\displaystyle \widetilde{\boldsymbol{u}}=\left\{\begin{array}{@{}ll@{}}\unicode[STIX]{x1D735}p & \text{in}~A,\\ \boldsymbol{u}_{ref}+\unicode[STIX]{x1D735}p & \text{otherwise},\end{array}\right. & & \displaystyle\end{eqnarray}$$
where
 $p$
is adjusted so that
 $\unicode[STIX]{x1D735}\boldsymbol{\cdot }\widetilde{\boldsymbol{u}}=0$
. It turns out that this procedure is less effective than (3.1). The resulting significance ratio for
 $n=1$
is included as a dashed line with circles in figure 2(b), and is approximately two times weaker than the comparable solid line for (3.1). The reason is that zeroing the velocity within a cell does not modify the surrounding cells, and, in particular, it does not change the circulation around the cell being modified. The vorticity originally contained in the cell is merely displaced to a sheet along its edge, which the irrotational gradient added in (3.3) cannot modify. Therefore, zeroing the velocity is equivalent to the less effective process of rearranging the vorticity, instead of deleting it.
This option is not explored further in this paper, although the results are used in the next section, but an equivalent choice has to be faced in generalising the present procedure to three-dimensional flows. Not only are the length scales of velocity and vorticity typically farther apart in three dimensions than in two, but vorticity itself is subject to a solenoidality constraint.
3.2 Properties of the significant regions
(a) P.d.f.s of the ratio of mean vorticity to mean rate of strain over individual significant cells, for 192 initial conditions with
 $n=1,N=36,\unicode[STIX]{x1D714}_{11}^{\prime }(t-t_{11})=3.4$
. The vertical dashed line is the global average that separates vortex- from strain-dominated regions,
 $\langle \unicode[STIX]{x1D714}^{2}\rangle /\langle S^{2}\rangle =2$
; ——, the 10 most significant cells for each initial condition; – – –, the 10 least significant cells; – - – - –, random cells. Lines without symbols are initialised using (3.1). Those with symbols use (3.3). (b) As in (a), for the kinetic energy,
 $q^{2}=u^{2}+v^{2}$
.

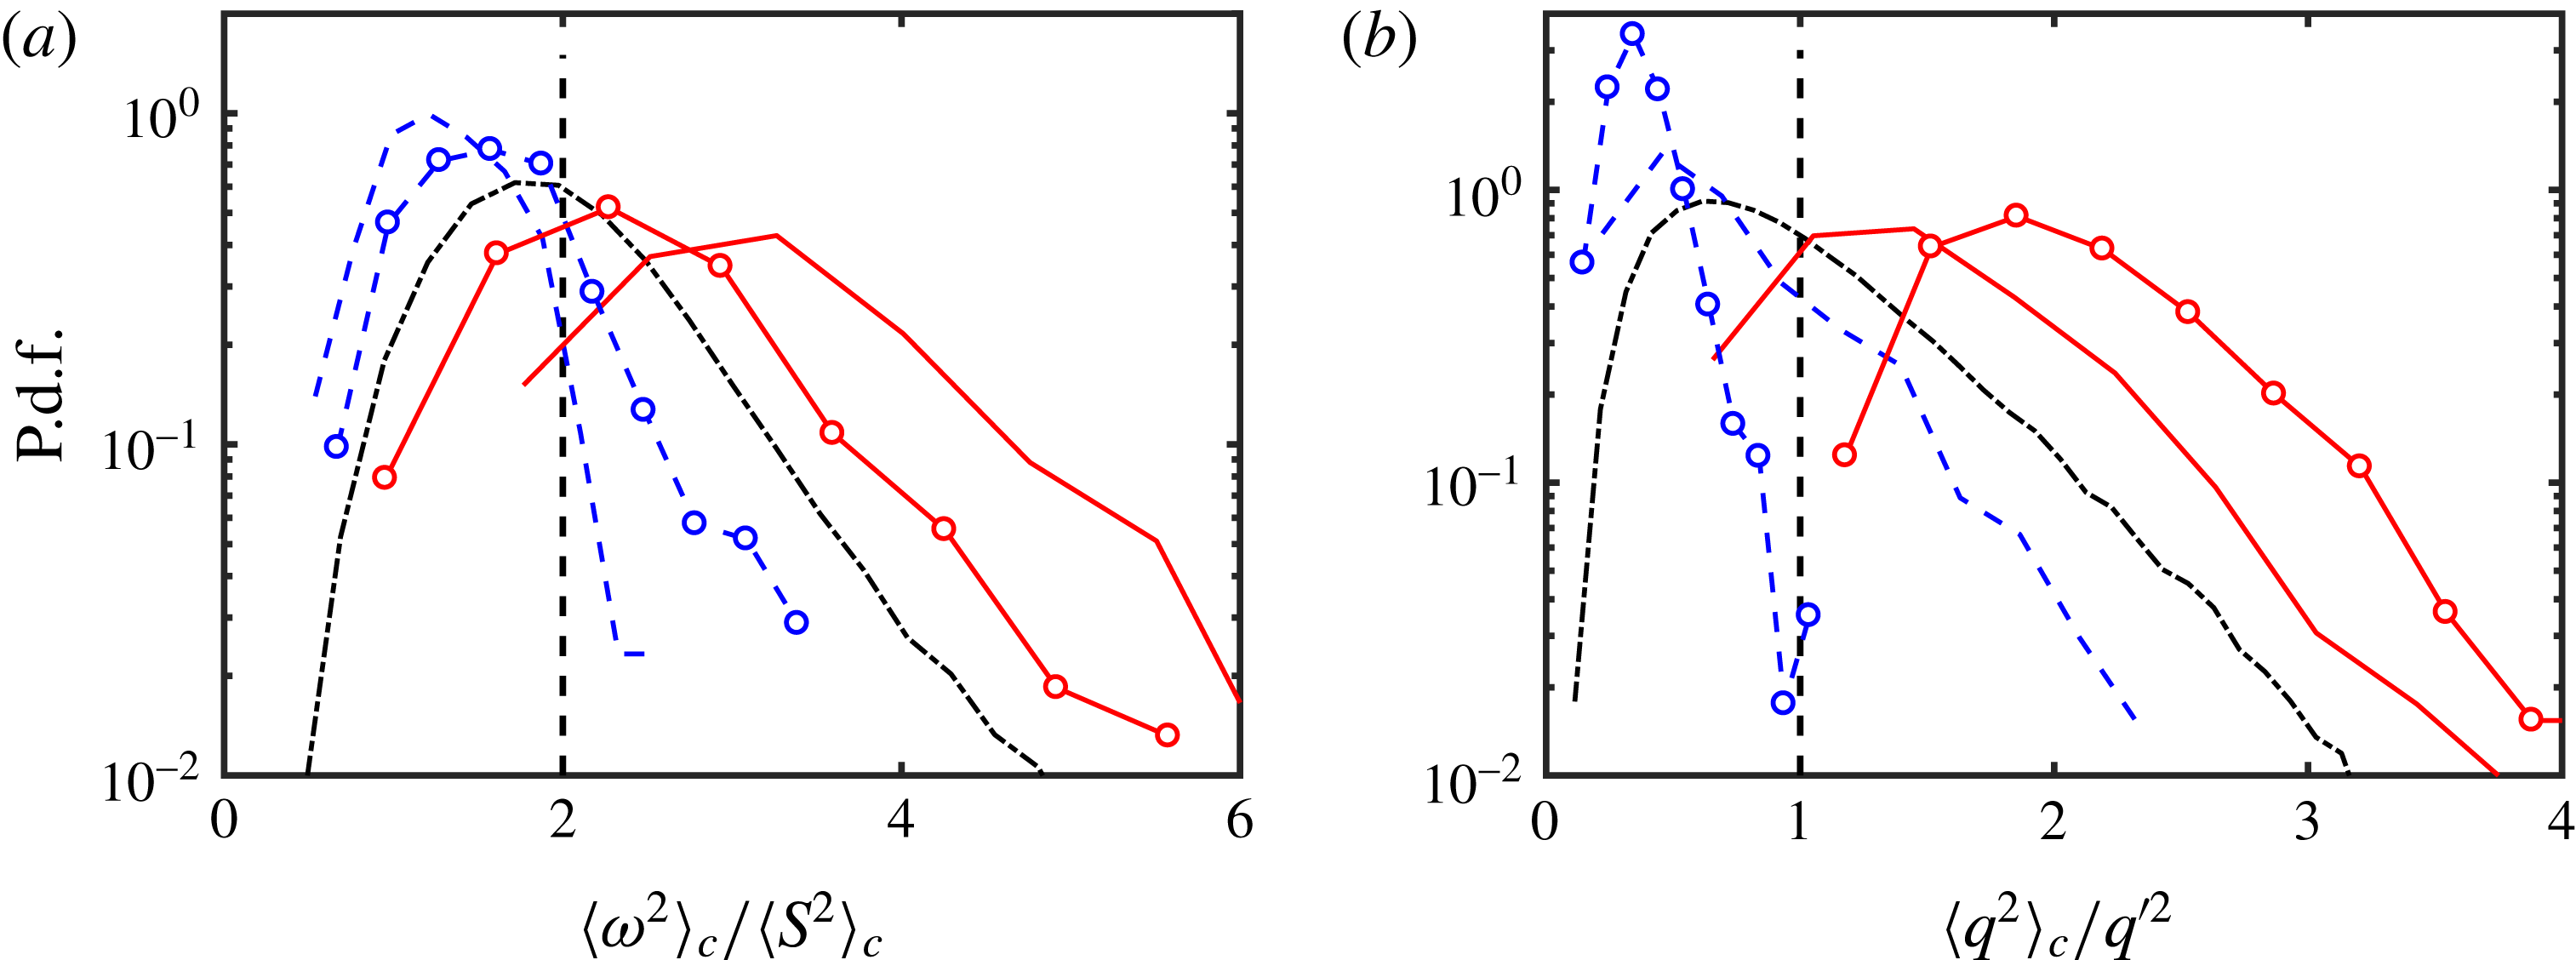
Although the main result of the previous analysis is the demonstration that there are subsets of the flow with very different dynamical significance, it also allows us to determine the properties of the most and least significant ones. Figure 4(a) displays the p.d.f. of the ratio of the enstrophy to the magnitude of the strain rate, averaged over the individual cells that have been labelled as most and least significant, compared with the p.d.f. compiled over randomly chosen cells. When this ratio is taken over the whole box, it is kinematically true that
 $\langle \unicode[STIX]{x1D714}^{2}\rangle /\langle S^{2}\rangle =2$
, which separates vorticity-dominated regions from those dominated by the rate of strain. The figure includes subsets modified by zeroing the vorticity, as in (3.1), together with others obtained by zeroing the velocity, as in (3.3). In both cases, the most significant sets are vortices and the least significant ones are the strain-dominated gaps between them, although the distinction is clearest for the cases that initially manipulate the vorticity. This agrees with the qualitative impression from figure 2(c), and with previous intuition (McWilliams Reference McWilliams1990), and applies to all combinations of cell and subset size. Figure 4(b) shows similar results for the kinetic energy. The tendency is also for highly significant cells to be energetic, although, in this case, it is clearest for the cases that initially manipulate the velocity. The tendency for significance to follow representativeness is to be expected, but it is reassuring that similar conclusions are reached from cross-manipulation, in which the behaviour of a variable is obtained from the modification of a different one.
4 Discussion and conclusions
We have shown that fully automatic comparison of simultaneous undisturbed and modified simulations can be used to segment a flow into regions properly labelled as more or less significant from the point of view of flow dynamics. Moreover, significance can be quantified as the growth of the perturbation after some time, and because regions are labelled individually, their properties can be statistically identified. In our application to two-dimensional turbulence, we find that the significant structures are vortices or vortex filaments, while the interstitial strain-dominated regions are less significant. We also show that significance is different from representativeness at a fixed time. Some flow features are more dynamically significant than what could be expected from their instantaneous energy content, and it is reassuring that tests based on the modification of different variables give similar results. Moreover, the results of the segmentation can be used to characterise the time scales and geometries of significant features. It follows from figure 3 that the key quantity controlling the scales being observed is the size,
 $\unicode[STIX]{x1D6E5}_{c}$
, of the test cells.
The problem is posed as a computer ‘game’ in which the machine tests the effect of different modifications of the initial conditions, and selects those that maximise or minimise it. The main difficulty of the procedure is cost, due to the large number of initial conditions and modifications that have to be tested, but it can benefit from the body of recent research on similar problems in data analytics and artificial intelligence. Even simple approximations help. While the purpose of the present paper is to test the strategy rather than to optimise processing time, considerable savings are achieved by substituting exhaustive searches by reasonable approximations, and the results presented above only represent a few thousand hours of computer time. In addition, the tests of different initial conditions are essentially independent, and can be trivially parallelised.
In retrospect, it should be clear that the problem of structure identification has only been partially automatised. In true machine learning, the result of the game is fed back into the initial conditions to optimise the result. In our experiment, this ‘back propagation’ step is left to the researcher, who evaluates the result and proposes modifications. The choice of test grids, initial flow conditions, observation times and deletion procedures discussed in § 3 was motivated in this way. The automatic part of the procedure described here can thus be seen as a fast and relatively exhaustive ‘forward’ search over experiments, resulting in the automatic labelling of flow subsets in terms of their significance.
Its main utility is probably its relative independence from preconceived ideas, which may mislead the researcher into confusing dynamical significance with representation of a particular quantity. While it would have been surprising if two-dimensional turbulence had been found to be non-intermittent, or if its significant eddies had been found to be other than vortices, the situation in more complex flows is, at least to the author, less clear. For example, while it is probable that we have identified by now the most significant types of structures of wall turbulence, especially near the wall, it is not impossible that we have missed some, and the situation is even less certain in homogeneous three-dimensional turbulence. Generalisation of the present results to these cases would require additional work, especially in the choice of initial perturbations, but, at least for moderate Reynolds numbers, both problems should be accessible to the current generation of computers.
Acknowledgement
This work was supported by the European Research Council under the Coturb grant ERC-2014.AdG-669505.
Appendix A. Search algorithms and operation estimates
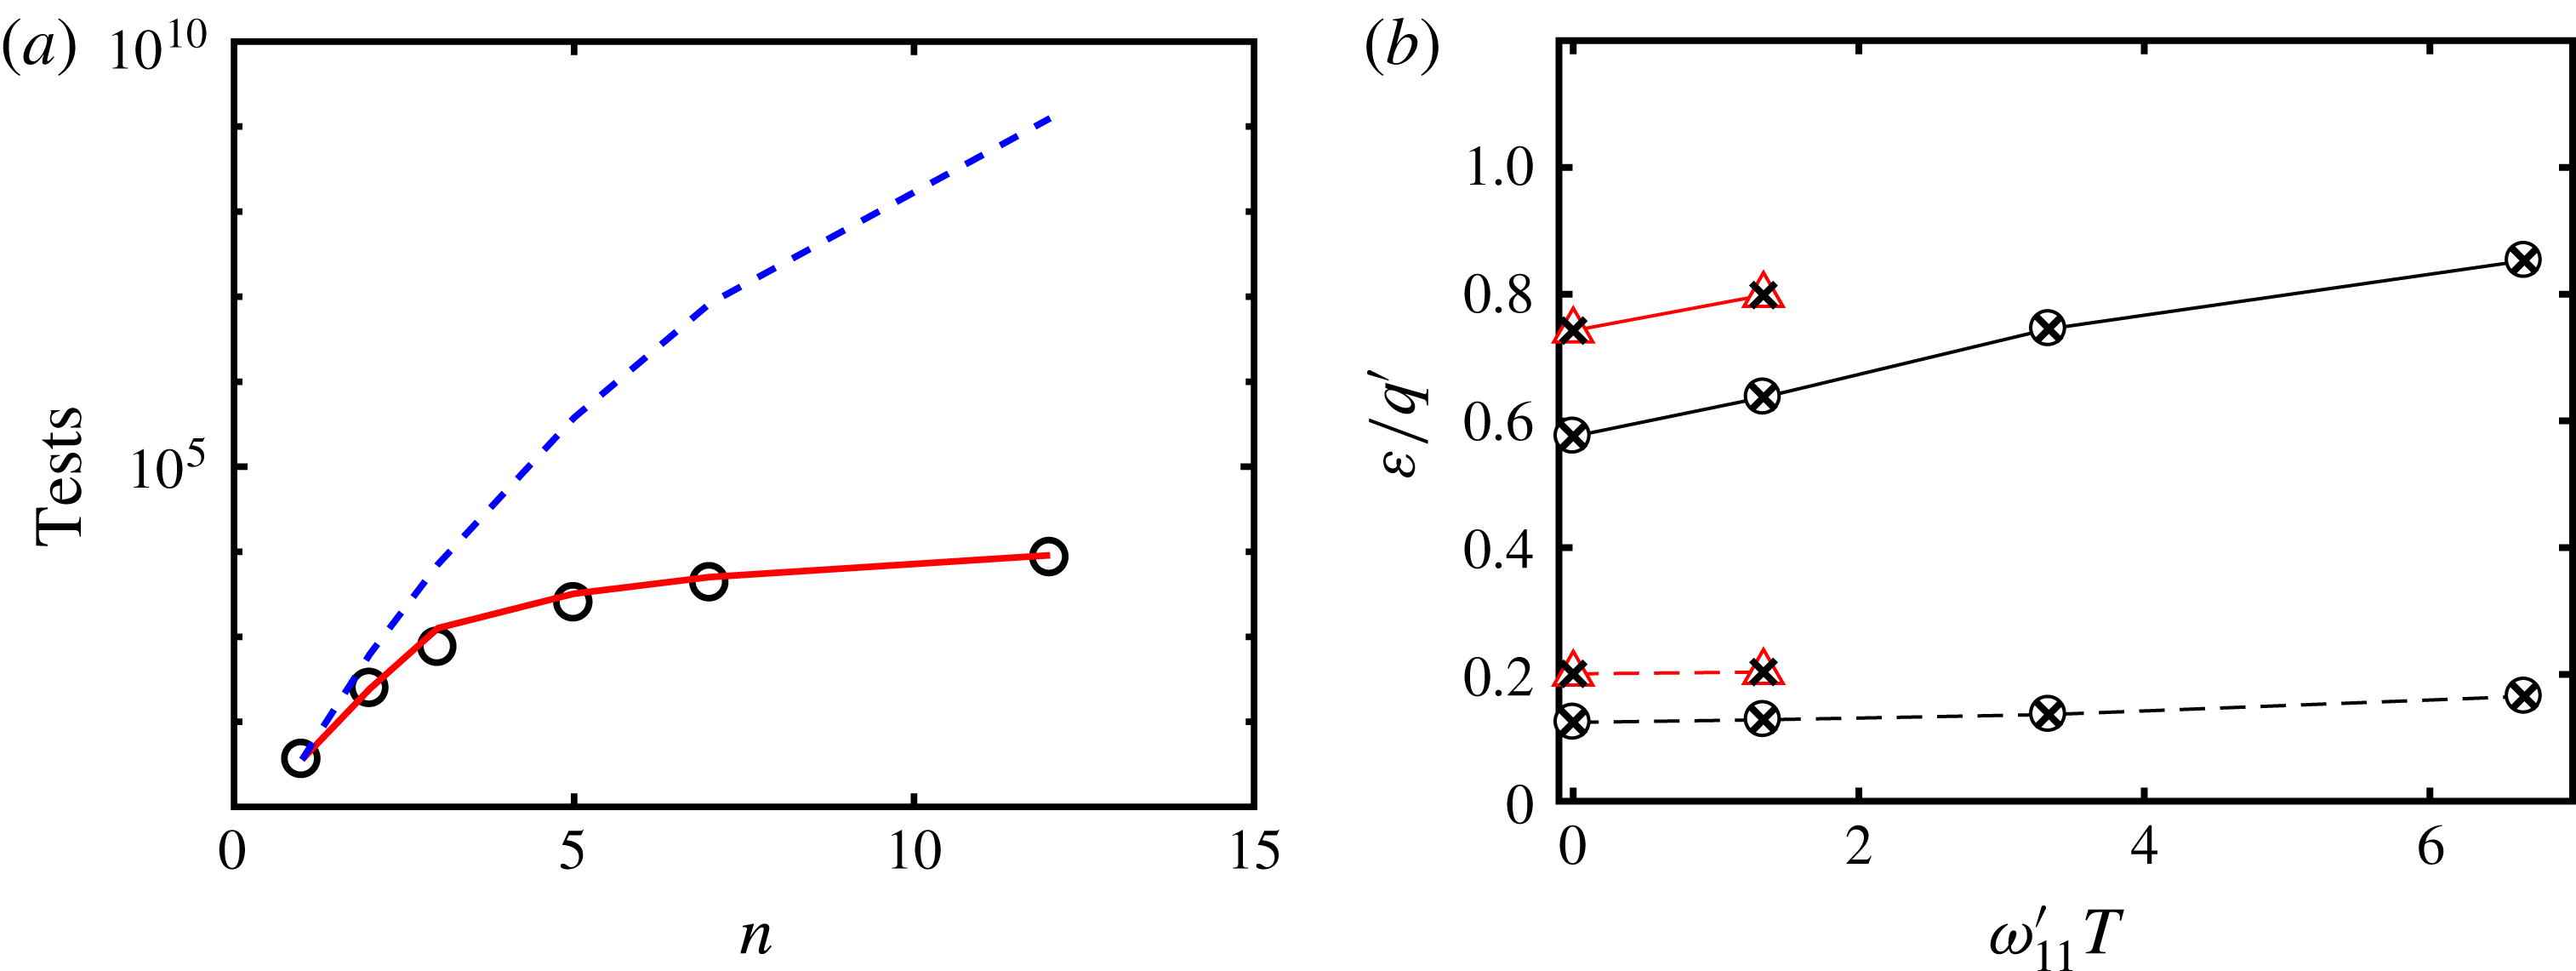
An exhaustive search of all possible subsets is only practical in simple cases, but a ‘pruned forest’ approximation turned out to give nearly perfect results, although 1000 times faster. The number of tests needed for a full search of
 $n$
elements from a set of
 $N$
cells is the binomial coefficient
 $\binom{N}{n}$
, which grows factorially with
 $N$
and
 $n$
. In the example used in figure 2, the number of tests for
 $N=6^{2}$
and
 $n=3$
is approximately 7000, but it grows to
 $3.7\times 10^{5}$
for
 $n=5$
and to
 $8\times 10^{6}$
for
 $n=7$
. The number of tests required for a full search of the case
 $n=12$
has 10 digits.
(a) Number of tests required for – – –, full search; ○, tree search; ——, estimate in (A 1). (b) Comparison of the results of the tree search (symbols) and the full search (crosses): ○,
 $n=3$
; ▵,
 $n=7$
. The solid lines show the highest deviation limit and the dashed ones the lowest. In all cases,
 $N=36$
, the pruning size is
 $M=15$
and the branching number is
 $b=3$
.

Our basic algorithm for the construction of optimal subsets is a greedy decision tree, in which a ‘best’ cell is modified and tested first, and the subset is constructed by incrementally adding the best of the remaining pool of cells. Such greedy algorithms are not generally exact (Cormen, Leiserson & Rivest Reference Cormen, Leiserson and Rivest1990). In the particular case of decision trees, the main problem is to prevent them from getting stuck in local extrema, and a popular remedy is to introduce noise by considering randomly initialised ‘forests’ (Breiman Reference Breiman2001) instead of deterministic trees. In our case, where we are not so much interested in global optima as in suboptimal classes, the randomness is introduced by keeping several possibilities after each decision, successively pruning them to avoid exponential branching.
The algorithm proceeds as follows.
(i) Test the
$N$
single cells, and populate the first level of the search forest with those resulting in the
$b$
smallest deviations.(ii) To construct the
$j$
th level, extend each element in level
$j-1$
with one of the
$N-j$
cells that have not been used, and retain the
$b$
smallest deviations. After all of the
$(j-1)$
th trunks have been extended in this way, prune the
$j$
th forest level to a maximum of the best
$M$
non-repeating elements.(iii) Repeat step (ii) until the final
$n$
th level is reached.


The same procedure is performed for the largest deviations. It is clear from this description that the maximum number of required tests is
 $O(MNn)$
, as long as the pruning size is larger than the branching ratio,
 $M>b$
. In the text,
 $M=15$
,
 $b=3$
and the number of tests needed for the largest case mentioned above
 $(N=36,n=12)$
is approximately 9000, instead of
 $10^{9}$
. A more precise estimate for the maximum number of tests is
 $$\begin{eqnarray}\displaystyle N_{T}=2M(n-2)(N-(n+1)/2)+N+2b(N-1), & & \displaystyle\end{eqnarray}$$
where the last term only applies to
 $n>1$
and the first one to
 $n>2$
. It is compared in figure 5(a) with actual experimental values.
The results differ little in practice from the full search, at a much lower cost. Figure 5(b) shows some results for a particular initial condition. The symbols are the result of the tree search and the crosses those of the full search.