


Introduction
The Scotia Sea, Antarctica, is a small deep-water basin that extends from Drake Passage in the west to the South Sandwich Islands in the east (Fig. 1). It is bounded elsewhere by the North and South Scotia ridges. Much of the sea floor lies at depths of 3000-4500 m, and the surrounding ridges and troughs largely isolate the basin from major continental sources of sediment (Pudscy and Howe, in press). Silt and clay sediments and biogenic material dominate the sea floor, together with a lesser amount of ice-rafled debris.
Map of the Scotia Sea showing sediment-core locations. The 2001 m bathymetric contour is shown by a thin solid line. Arrows indicate the direction if flow if the Antarctic Circumpolar Current (after Reference Orsi, Whitworth and NowlinOrsi and others, 1995). DI, Deception Island; PI, Penguin Island; BI, Bridgeman Island.
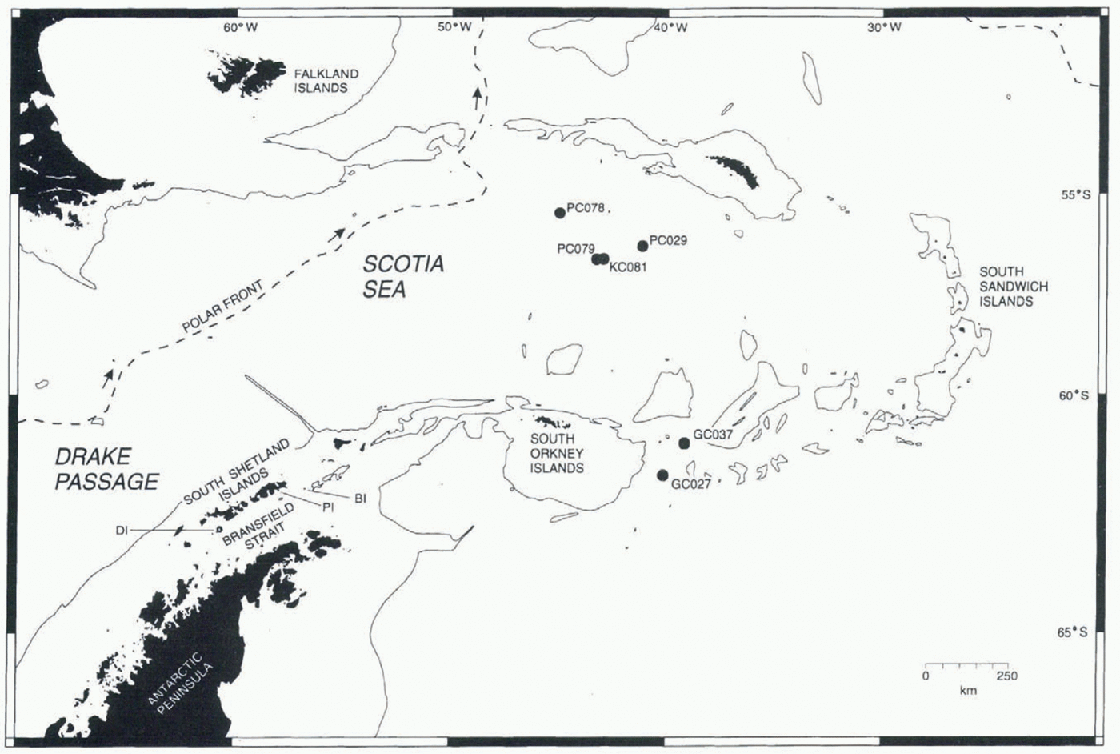
Most Quaternary sediments with in the Scotia Sea lie below the carbonate compensation depth as this gradually rises south of the Polar Front to a minimum depth of 500 m in the vicinity of the South Orkney Islands. Therefore, carbonate tests are largely absent from the sediments, and the oxygen isotope data that have been used to date and correlate marine sediments elsewhere cannot be used here.
The position and migration of the Polar Front and the maximum extent of spring sea-ice cover are important controls on biogenic productivity. They are also important climatic indicators whose fluctuations can leave an imprint in the sedimentary record. However, palacoclimatic and palaeo-oceanographic reconstructions for this part of the Southern Ocean have been significantly constrained by the lack of a suitable correlative and dating technique.
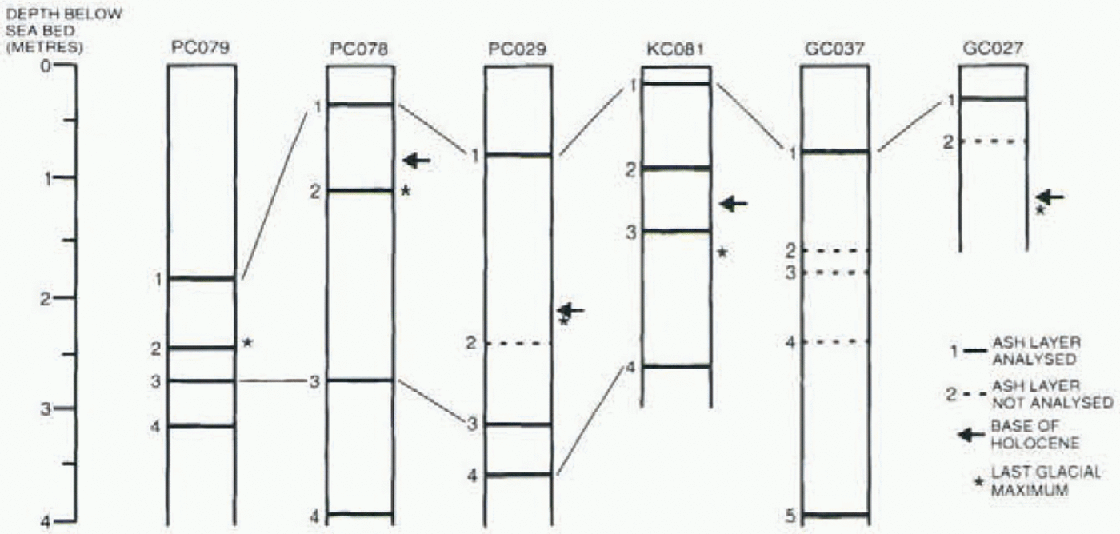
Using Ba/Al ratios as a measure of organic palaeo-pro-ductivity, Pudsey and Howe (in press) identified the base of the Holocene (Stage 1) in several cores used in this study. They also identified the most recent peak abundance of the radiolarian Gycladophora davisiana, which Reference Hays, Lozano, Shackleton and IrvingHays and others (1976) recognised as indicative of the Last Glaciol Maximum and dated as 18 000 BP through correlation with oxygen isotope curves from carbonate-bearing sub-Antarctic cores. The positions of these time planes are shown in Figure 2, and represent the only datable surfaces currently available for the cores used in this study.
Schematic core logs showing positions of ash layers encountered. Depths to the base of the Holocene and the Last Glaciol Maximum are also shown (after Pudsey and Howe, in press).
This paper is an initial report on the first correlation of Quaternary deep-sea sediments from the central Scotia Sea using volcanic glass geochemistry. Tephrochronology has been applied widely in the Antarctic region, but marine tephra comprises a largely neglected source of information and none has been described previously from the Scotia Sea (Smellie, in press). Our study indicates the potential for erecting a tephrochronologic framework for dating and correlating sedimentary sequences used in palaeoclimatic and palaeo-oceanographic reconstructions south of the Polar Front.
Tephrochronology
Tephrochronology is the correlation and dating of tephra isochrons. It is founded on the assumption that tephra from individual volcanic eruptions can be identified, distinguished and correlated using layer thickness, particle size and shape, colour, slraligraphical relationships, and mineral assemblages (Hunt and others, 1995). Another widely used technique is the geochemical characterisation of tephra. This is most frequently achieved using electron-probe microanalysis (ΕΡΜΑ) of individual glass shards, which, if derived from single eruptions, are homogeneous and represent the composition of the source magma.
At the southwestern margin of the Scotia Sea, extension and formation of a marginal basin in Bransfield Strait since Pliocene times (Reference Weaver, Saunders, Pankhurst and TarneyWeaver and others, 1979; Reference Keller, Fisk, White and BirkenmajerKeller and others, 1991) has resulted in the growth of several active or recently active volcanoes, some of which are thought to have distributed tephra within Bransfield Strait and across the South Shetland Islands (Reference Matthies, Storzer, Troll and J.Matthies and others, 1988, Reference Matthies, Mäusbacher and Storzer1990; Reference Björck, Sandgren and ZaleBjörck and others, 1991). Given the general eastward drift of the prevailing oceanic circulation (Antarctic Circumpolar Current) and atmospheric circulation patterns, tephra derived from volcanoes in Bransfield Strait and the South Shetland Islands has the potential to be dispersed across the Scotia Sea.
Previous tephrochronological investigations in the northern Antarctic Peninsula region have examined tephra in Glaciol ice, moss banks, limnic sediments and shallow marine sediments (Reference Orheim and AdieOrheim, 1972; Matthies and others, 1988, 1990; Björck and others, 1991; Reference Tatur, Del Valle and PazdurTatur and others, 1991; Calvct and others, 1997). Except for two ash layers from Bransfield Strait and King George Island attributed to eruptions from Bridgeman and Penguin Islands (Matthies and others, 1988; Tatur and others, 1991), all of the ash layers documented were attributed to a Deception Island source. However, so far none of the ashes is well characterised, and only local correlations have been achieved. in addition, there are no published geochemical analyses for any of those tephra layers.
Identification of Tephra Layers
Six sediment cores (GC027, PC029, GC037, PC078, PC079 and KC081) obtained by the British Antarctic Survey (Pudsey and Howe, in press) were selected from a 400 km long northwest-southeast transect across the Scotia Sea (Fig. 1) and were examined for the presence of ash layers. Four megascopic and 19 disseminated ash layers were identified using magnetic susceptibility measurements and optical microscopy. Megascopic ash layers in cores GC027, PC029, PC079 and KC081 were sampled directly. in addition, the cores were subsampled at 4 cm intervals, wet-sieved to remove the fine silt and clay fraction (<32μm sieve) and examined microscopically. It was found to be difficult to obtain viable analyses from shards smaller than 32 μm. The number of volcanic glass shards was recorded as a percentage of the total sediment in the sieved sample. in this way it was possible to identify disseminated ash layers in which glass shards account for as little as 4% of the >32μm sediment fraction. Samples from each tephra-rich horizon were mounted in epoxy resin, polished Hat using either 1 μm diamond paste or a 0.3 μm aluminium oxide suspension, and carbon coated to prevent sample charging during ΕΡΜΑ. There was no attempt to concentrate the tephra prior to analysis, because ΕΡΜΑ is a grain-discrete analytical method suited to small tephra samples.
Analyses of glass shards from Quaternary ash layers in the Scotia Sea selected to show the range of compositions encountered in each laver. Also given are mean compositions for each ash layer

Analytical Instruments and Analytical Conditions
Samples were analyzed on a Cambridge Instruments Microscan Mk Velectron microprobe with two wavelength dispersive spectrometers (WDSs) at the University of Edinburgh, and on a Leica Cambridge S360 Scanning Electron Microscope with an Oxford Analytical Isis 300 energy dispersive spectrometer (EDS) attachment at the British Antarctic Survey. Some samples were analyzed on both instruments to ensure comparability of results from both centres.
Individual glass shards were analyzed under beam conditions adjusted to minimise the effects of alkali mobility (Hunt and Hill, 1993,1994). The WDS used a 1 μm focused beam, an accelerating voltage of 20 kV and a beam current of 15 nA. The elements were analyzed in pairs with counting times of 10 s per pair. For the EDS, a 5 μm rastcred beam was used, with an accelerating voltage of 20 kVand a beam current of 3.9 nA. Elemental spectra were collected simultaneously over a 20 s live count time. Good agreement was found when the same tephra samples and secondary standards were analyzed by both methods. Analytical error for each oxide is estimated to be ±0.2% of the analytical total for the WDS and ± 0.5% of the analytical total for the EDS, based on repeat analyses of a secondary glass standard (Lipari Obsidian; Hunt and Hill, 1996), using both methods.
Results
Four tephra layers were found in each of cores PC029, PC078, PC079 and KC081. Five were identified in CC037 and two in GC027 (Fig. 2). Table 1 shows the mean chemical compositions of the correctable ash layers and analyses of individual shards to illustrate the range of compositions in each layer. Every tephra layer contains a population of brown vcsicular-to-platy glass shards which have basalt to basaltic-andesite compositions with mean silica values of 50.9-53.7%. For all samples the mean Na2O content was significantly high for basaltic compositions (4.05-4.95%). The uppermost ash layer in every core was also found to contain numerous clear, pumiceous glass shards with elongate vesicles. The pumiceous shards are subordinate to basaltic shards, but the two glass types are thoroughly mixed, suggesting thai they were ro-erupterl. There is no evidence that mixing occurred after deposition. ΕΡΜΑ of the clear glass revealed a rhyolitic composition with a mean silica content of 69.4-71.8%, indicating a distinctive bimodal composition for this tephra (fig. 3a).
Titanium-oxide-iron-oxide diagrams of the uppermost ash layer from each of the six cores (a), and the third and fourth ash layers (b). One standard deviation ellipses are shown in (b) to aid visual discrimination of the ash layers. Also shown is the known fractionation trend for Deception Island lavas (J.L. Smellie, unpublished data). Total iron calculated as FeO.

The second ash layer encountered in each core shows a considerable range of compositions both within and between samples, and it generally has low shard concentrations. The small numbers of shards may be an effect of winnowing or ice rafting and it may not be a primary tephra deposit. The third ash layer in cores PC029, PC078 and PC079 showed a good compositional correlation, with mean compositions of SiO2: 51.71-53.42%; TiO2: 1.58-1.89%; and Na2O: 4.05-4.50%. A fourth ash layer is only correlatablc between cores PC029 and KC081, and has mean compositions of SiO2 52.6-53.7%; TiO2: 1.64-1.73%; and Na2O: 4.28-4.30%. Although the third and fourth ash layers are compositionally similar, they are distinguishable in their FeO TiO2 relationships (fig. 3b).
Discussion
The high sodium contents of the dominant basaltic glass shards in all the cores correlate well with published geochemical data for Deception Island tephra and lavas (Weaver and others, 1979; Smellie, 1990; unpublished data of J. L. Smellie). Elevated Na2O is a unique characteristic of Deception Island magmas, and distinguishes this source from all other volcanoes in the region (Smellie, 1990). Additional characteristics ofDeception Island tephra that distinguish them from other potential Bransfield Strait sources are high TiO2 and low K2O (Weaver and others, 1979; Keller and others, 1991). The composition of the rhyolite and basaltic components of the upper ash layer fall exactly on the fractionation trend of Deception Island magmas (fig. 3a), although extending to slightly more evolved compositions than have been recorded on the island (probably a function of comparing probe analyses of glass with whole-rock XRFanalyses of glass with crystals). Deception Island, situated almost 800 km upwind of the nearest core examined here, is therefore identified unambiguously as the source of all the glass populations analyzed.
The complete mixing of two compositionally distinct glass populations in the upper tephra layer, and their ubiquitous co-occurrence, suggests either that they are the product of a single bimodal eruption or two closely spaced eruptions, or that mixing is an effect of bioturbation. We favour the first explanation, as Deception Island is known to contain commingled lavas and has erupted tephra with multiple glass compositions (Matthies and others, 1988; unpublished information of J. L. Smellie) and some eruptions were probably triggered by influx offresh basic magma into evolved magma chambers (Smellie and others, 1992). figure 3a shows the compositional correspondence between the basaltic and the rhyolitic shards from the upper ash layer in all six cores. The layer is very distinctive and easily recognised, providing a correlatablc datum extending over 800 km from the source volcano.
figure 3b shows the compositional groupings of the third tephra layers identified in cores PC029, PC078 and PC079, and the fourth ash layers in PC029 and KC081. Despite some data scatter, the two shard populations are statistically separable, and good correlations are generally achieved. in Figure 3, it is noticeable that several shard compositions plot far from the mean for their respective ash layers. However, their compositions are coincident with the fractionation trend for Deception Island magmas and we suggest that they may represent shards reworked from pre-existing tephra stripped from the island during eruptions.
The upper bimodal ash layer is the only clearly Holocene tephra identified in the Scotia Sea cores. It is unlikely to be equivalent to any of the dated Holocene tephra described from Bransfield Strait and King George Island by Matthies and others (1990), none of which are bimodal.
Conclusions
-
1. Distal tephra deposits are common in Quaternary sediments in gravity and piston cotes obtained from the Scotia Sea.
-
2. They have distinctive sodium-rich compositions and Deception Island can be unambiguously identified as the source volcano.
-
3. Of the four tephra layers found in cores PC029, PC078, PC079 and KC081, and five in GC037, three have proved to be correlatablc on the basis of major oxide geochemistry.
-
4. The uppermost ash layer is bimodal (basalt-rhyolite). It is unique in the dataset and can be correlated over a distance of 400 km between cores. It is also the only clearly Holocene distal tephra layer identified so far in the Scotia Sea and is therefore an important stratigraphie marker horizon for future palaeoclimatic and palaeo-oceanographic studies.
Acknowledgements
This paper forms part of the research being conducted under U.K. Natural Environment Research Council studentship No. GT4/95/61/E, and has been additionally funded by Trans-Antarctic Association grant No. TAA/97/13. We are very grateful to P. Hill and K. Robinson for their assistance with the EPMAs. We also gratefully thank C. Pudsey, J. Hunt and J. Howe for their constructive reviews of the manuscript, and P. Morris for assistance with drafting figures.



