Introduction
The relationship between socioeconomic status (SES) and health outcomes has been studied in a number of developed as well as developing countries (Marmot et al., Reference Marmot, Smith, Stansfeld, Patel, North and Head1991; Strand & Tverdal, Reference Strand and Tverdal2006; Theodossiou & Zangelidis, Reference Theodossiou and Zangelidis2009; Thurston et al., Reference Thurston, Kubzansky, Kawachi and Berkman2005; Yarnell et al., Reference Yarnell, Yu, McCrum, Arveiler, Hass and Dallongeville2005; Bauldry, Reference Bauldry2014). Most, but not all, studies have found an adverse effect of lower SES on health condition, especially on clinical markers of the cardiovascular and respiratory systems, e.g. blood pressure, Body Mass Index (BMI), cholesterol, Forced Expiratory Volume (FEV1) and Peak Expiratory Flow (PEF) (Martikainen et al., Reference Martikainen, Ishizaki, Marmot, Nakagawa and Kagamimori2001; Banks et al., Reference Banks, Marmot, Oldfield and Smith2006; Atherton & Power, Reference Atherton and Power2007; Hegewald & Crapo, Reference Hegewald and Crapo2007; Cardoso & Caninas, Reference Cardoso and Caninas2010).
Health inequalities in the United Kingdom have been widely reported for a range of variables (Ellis & Fry, Reference Ellis and Fry2010). There is a well-documented north–south divide in BMI, diseases of the respiratory and circulatory systems (as indicated by blood pressure and FEV1), total immunoglobulin E (IgE), hearing thresholds (Shaper et al., Reference Shaper, Ashby and Pocock1988; Elford et al., Reference Elford, Phillips, Thomson and Shaper1990; Strachan et al., Reference Strachan, Rudnicka, Power, Shepherd, Fuller and Davis2007), premature mortality rates (Buchan et al., Reference Buchan, Kontopantelis, Sperrin, Chandola and Doran2017), breast and lung cancer incidence (Ellis & Fry, Reference Ellis and Fry2010), personalities (Rentfrow et al., Reference Rentfrow, Jokela and Lamb2015) and mental health (Lewis & Booth, Reference Lewis and Booth1992). A number of factors have been implicated in this regional heterogeneity, namely socioeconomic factors, health-related behaviours and the environment (Ben-Shlomo & Davey Smith, Reference Ben-Shlomo and Davey Smith1991; Marmot, Reference Marmot2017).
Social mobility, especially inter-generational mobility, reflects the stability or change in social class between generations measured by comparing parental social class with an individual’s social position in adulthood. It is hypothesized that healthier individuals move up the social classes while less-healthy ones move down. In general, British studies of the association between socioeconomic position and the health status or mortality of individuals have used occupation-based socioeconomic measures. Nevertheless, reports from UK studies have confirmed that higher levels of education are positively associated with better health and longevity (Davey Smith et al., Reference Davey Smith, Hart, Hole, MacKinnon, Gillis and Watt1998; Silles, Reference Silles2009; Clark & Royer, Reference Clark and Royer2010), although there does not appear to have been any research conducted on the relationship between health status and inter-generational educational mobility.
Although studies of socioeconomic status and health have been undertaken using a variety of social status assessments (social class at birth, social class in adulthood, inter- and intra-generational social mobility, educational attainment, region), thus far no research has considered all indicators of socioeconomic status as well as their inter-generational changes simultaneously. This study used the British National Child Development Study (NCDS) to examine not only the importance of social class, education and regional variation in relation to selected cardiovascular and respiratory biomarkers, but also the impact of social and educational mobility and regional migration.
Methods
Data
Data were collected as part of the British NCDS – a longitudinal survey of all children born in England, Wales and Scotland during the first week of March 1958. The number of children initially studied was about 14,000 and immigrants who were born during this week were included later. The children and their families were periodically re-studied in 1965, 1969, 1974, 1981, 1991, 2000, 2004, 2008 and 2013. In 2002, 78% of the original sample participated at the age of 44–45 in a biomedical survey. These respondents were broadly representative of the total surviving cohort members in terms of biological, social and health characteristics from childhood to adulthood (Power & Elliott, Reference Power and Elliott2006; Atherton et al., Reference Atherton, Fuller, Shepherd, Strachan and Power2008; Pinto Pereira & Power, Reference Pinto Pereira and Power2013). The few adults (2%) from ethnic minorities were excluded from the analyses.
The study was restricted to the 5702 cohort members (2984 men and 2718 women) who had biomedical data as well as complete information on their own and their father’s social class, educational level and region of the country the cohort member was born in and currently lived. Six cardiovascular and respiratory biomarkers collected at 44–45 years were used: BMI, waist circumference, systolic and diastolic blood pressures, FEV1 and PEF. Each cohort member’s height and weight were measured at 33 years of age and BMI was calculated as weight/height2 (kg/m2). A clinical examination was undertaken by nurses using standardized protocols. Details of the biomedical assessment have been described elsewhere (Power et al., Reference Power, Atherton, Strachan, Shepherd, Fuller and Davis2007). Blood pressure was measured three times and average systolic and diastolic blood pressures calculated. Lung function was assessed by spirometry to give one-second FEV1 as well as PEF. Three technically satisfactory blows were obtained and the highest measure was used.
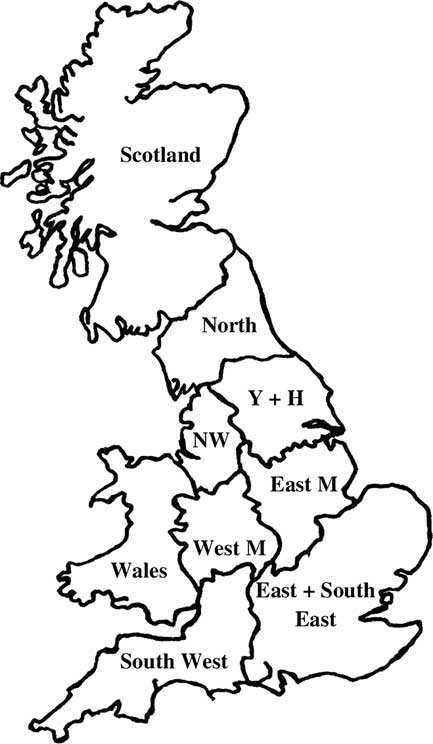
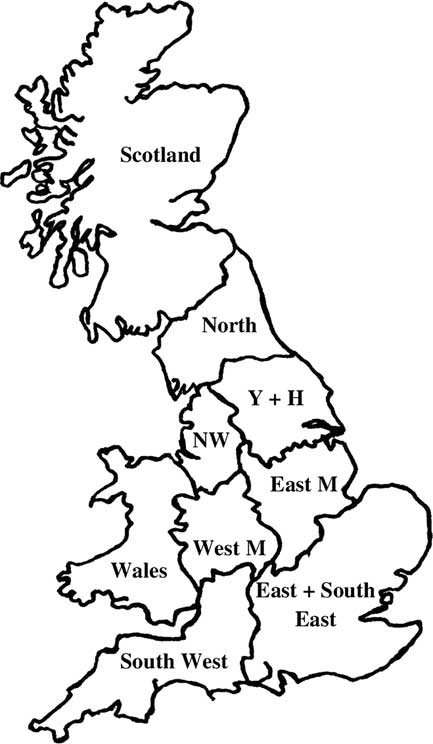
Social class at the cohort member’s birth (1958) as well as at 42 years of age (2000) was defined by the Registrar General’s 6-point occupational scale, where I refers to professional, II to intermediate (mainly managerial), III NM non-manual skilled worker, III M manual skilled worker, IV semi-skilled worker and V unskilled. Due to smaller numbers, social classes I and II as well as IV and V were combined. The extent of social class mobility was determined inter-generationally between the cohort member’s birth and 42 years of age, i.e. between fathers and adult male and female cohort members separately. Social mobility was categorized as none (no change in social class), upwardly mobile (the cohort member’s social class was higher than their father’s social class) or downwardly mobile (the cohort member’s social class was lower than their father’s social class). The educational qualifications of cohort members and their fathers were classified by age at completion of full-time education: 1, University (aged 21 years); 2, A levels (18 years); 3, O levels (16 years); 4, No qualifications (before 16 years). Due to small numbers, the groups ‘University’ and ‘A levels’ were combined into a single category ‘University + A levels’. The extent of inter-generational educational mobility was determined by comparing fathers and adult male and female cohort members separately. Educational mobility was categorized as none (no change in educational level), upward mobility (the cohort member’s education was higher than their father’s education) or downward mobility (the cohort member’s education was lower than their father’s education). In this study nine standard British regions were used, namely North, Yorkshire & Humberside, East Midlands, East & South East, South West, West Midlands, North West, Wales and Scotland (see Fig. 1). The extent of inter-generational regional migration was determined by comparing fathers with male and female cohort members (between 1958 and 2000). Regional migration was categorized as none (sedentes, no change in region of residence) or migratory.
Map showing the nine study regions. Y+H=Yorkshire and Humberside; East M=East Midlands; West M=West Midlands; NW=North West.
Analysis
Two types of regression analyses (with Bonferroni correction) were undertaken. The first was a simple regression that examined the effects of a single variable, e.g. social class at birth in relation to BMI, social class at 42 years of age in relation to BMI, social mobility in relation to BMI, educational attainment in relation to BMI and so on. The second analysis, sequential multiple regression, initially removed the effects of all the other independent variables before testing for the variable of choice. For example, the independent association between social class at birth and BMI was assessed after removing the effects of social class at 42 years of age, social mobility, education, educational mobility, region at birth and regional migration. All analyses were conducted separately for men and women.
The analyses were performed using SPSS version 22.
Results
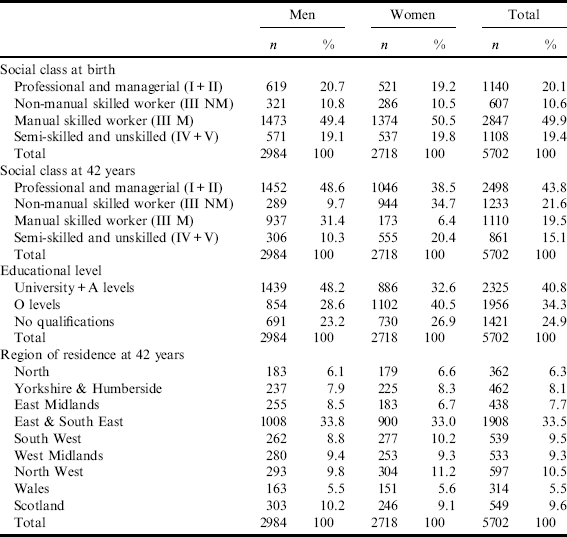
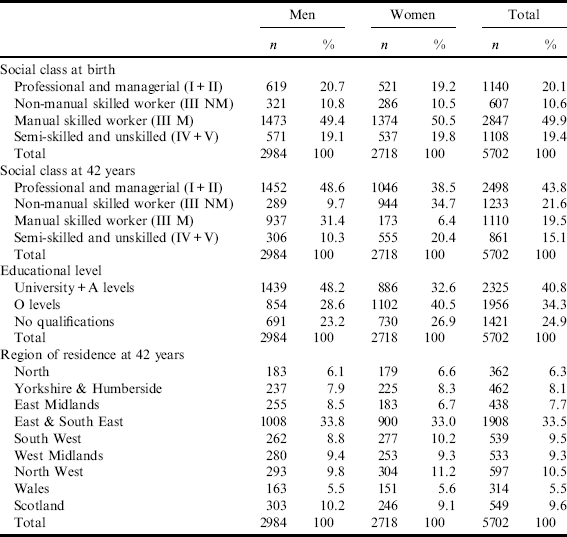
Table 1 presents information on the social class, educational level and region of residence of cohort members. At birth, nearly 50% were in social class III M, 20% in I+II and IV+V and 11% in III NM. There was considerable change between birth and 42 years of age, with only 20% of cohort members being in III M, 44% in social classes I+II, 15% in IV+V and 22% in III NM. Fifty-eight per cent of the cohort members’ fathers had no qualifications, while 18.4% had completed O levels. Overall, 40.8% of the cohort members (48.2% of men and 32.6% of women) had completed University or A level education, while 24.9% (23.2% of men and 26.9% of women) did not attain any qualifications. Overall, 32.9% of the cohort members’ fathers came from the East & South East region and only 5.5% were from Wales. Similarly to fathers, 33.5% of the cohort came from the East & South East region and 5.5% were from Wales (Table 1).
Social class, educational level and region of residence of cohort members, 1958 British NCDS
Overall, 53.1% of the cohort members were upwardly socially mobile, while 20.9% were downwardly socially mobile. A similar trend was found for educational mobility, with greater upward (53.4%) than downward (14.7%) mobility. Between 1958 and 2000, 23.2% of the cohort members were geographical (regional) migrants.
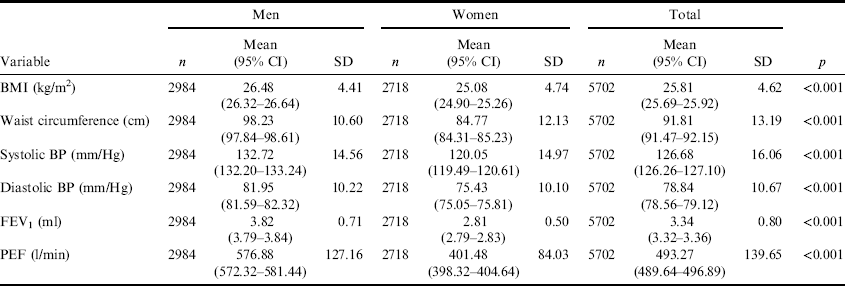
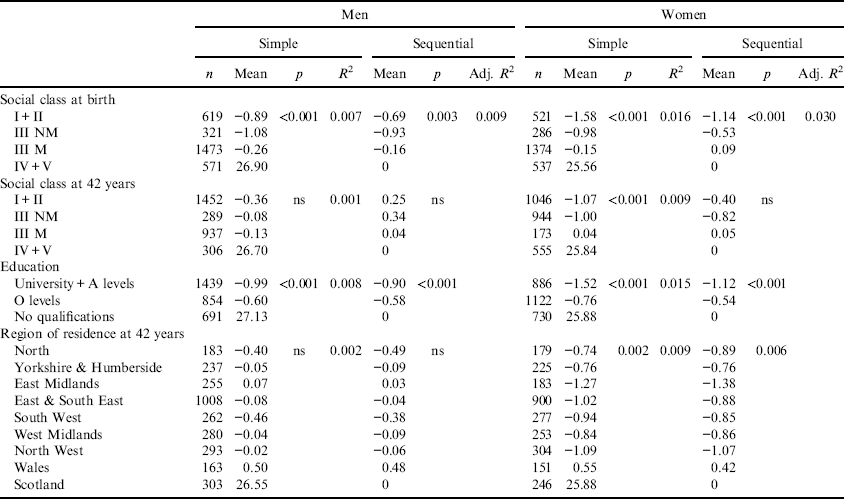
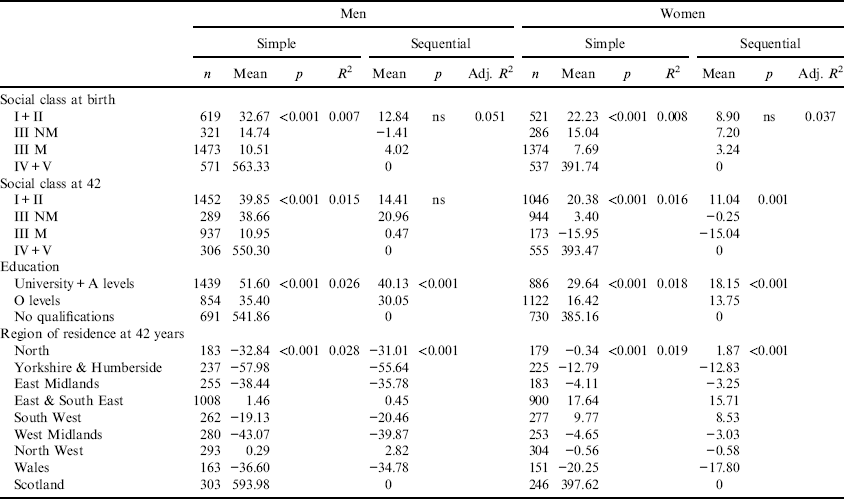
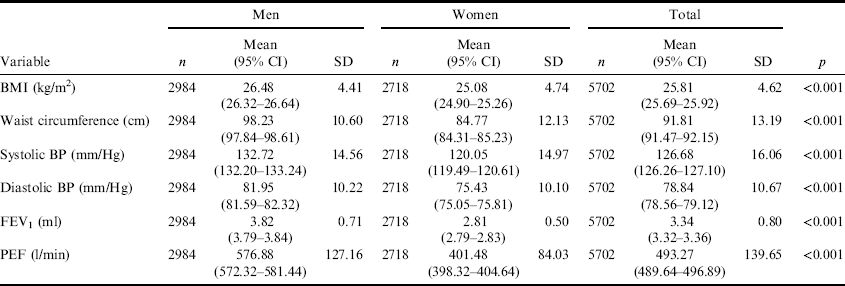
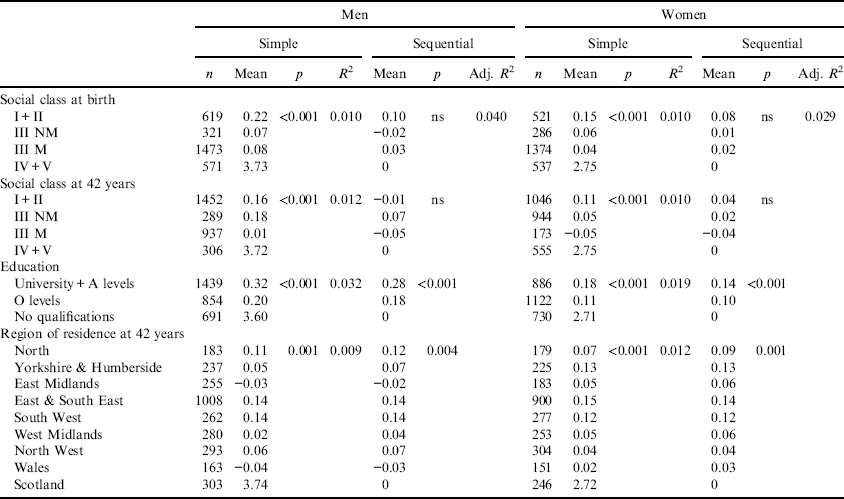
The means and standard deviations of each biomarker by sex are presented in Table 2. All biomarkers showed strong sex differences with higher male mean values for BMI (p<0.001), waist circumference (p<0.001), systolic blood pressure (p<0.001), diastolic blood pressure (p<0.001), FEV1 (p<0.001) and PEF (p<0.001). There was a significant relationship between fathers’ social class and cohort members’ BMI (p<0.001) and a general tendency for mean BMI to increase from social class I+II to IV+V (Table 3). A sequential multiple regression analysis revealed that fathers’ social class differences remained for both sexes (p=0.003 and p<0.001 for men and women, respectively) (Table 3). Social class at 42 years of age was only a significant predictor of BMI for female cohort members (p<0.001) before sequential analysis. In both sexes, before and after the sequential multiple regression analysis higher education of the cohort members was associated with lower BMI (both p<0.001) (Table 3). The results for region at birth did not show any significant differences in means for men, whereas for women regional differences were found before and after sequential multiple regression analysis (p=0.002 and p=0.006, respectively), with the highest mean BMI being in Wales (Table 3).
Biomarker characteristics of men and women at age 44–45 years by sex, 1958 British NCDS
Results of simple (unadjusted) and sequential (adjusted) multiple regression analyses to predict BMI (kg/m2)
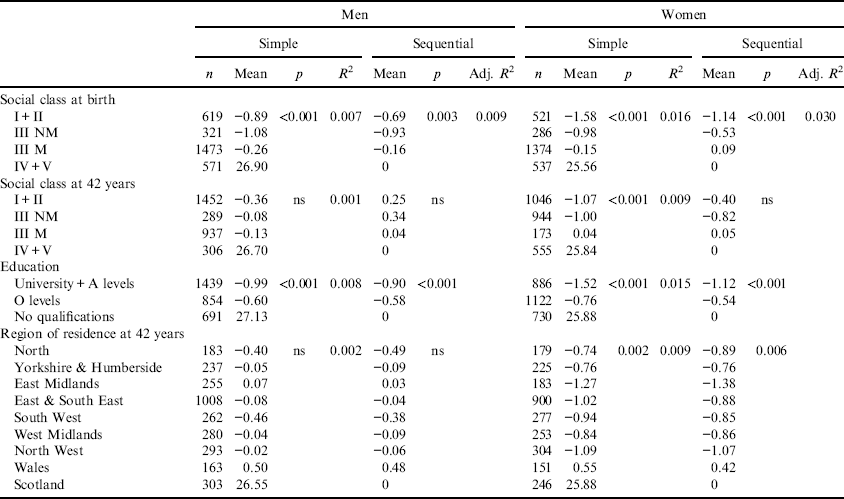
In both sexes, before the sequential multiple regression analysis there were significant differences in mean BMI between sedentes and regional migrant cohort members, and more so in males (p<0.001 and p=0.004, respectively), with migrants tending to have a lower mean BMI than sedentes. However, after the sequential multiple regression analysis no significant association remained. There were no significant differences in mean BMI in relation to social and educational mobility before or after sequential multiple regression analysis (not shown).
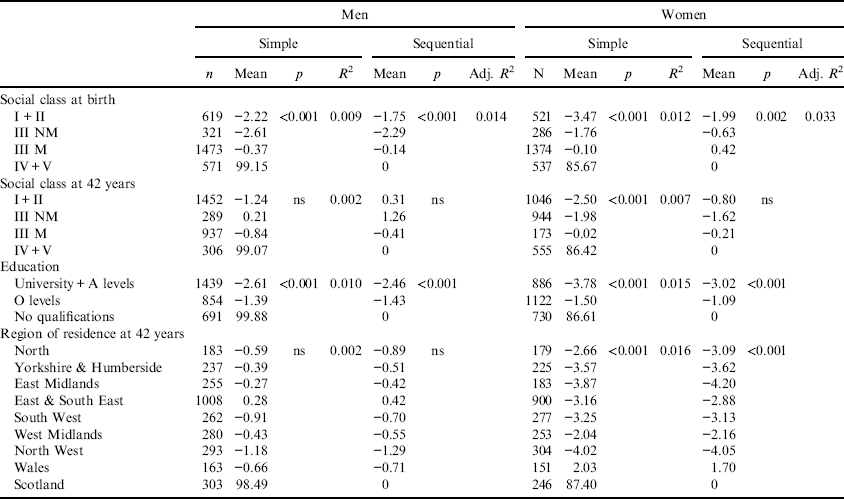
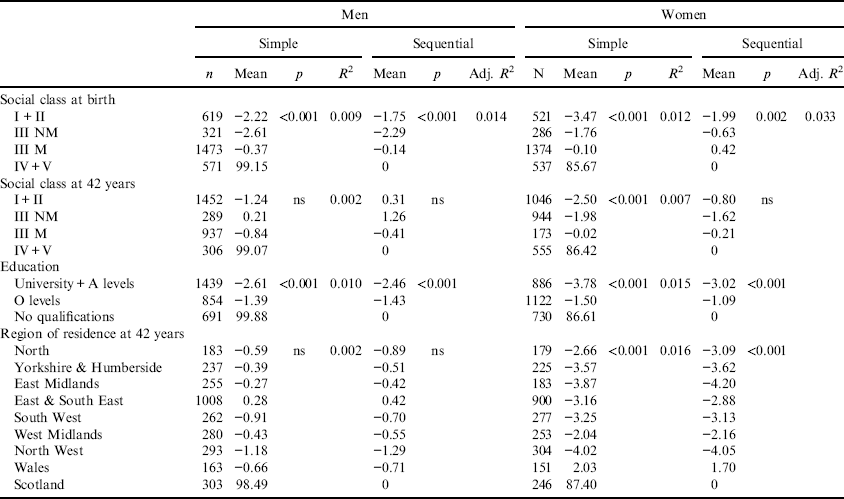
There was a strong relationship between fathers’ social class and the cohort members’ waist circumference (p<0.001 and p=0.002 for men and women, respectively) with a tendency for mean waist circumference to increase from social class I+II to IV+V (Table 4). There was also an association between social class at 42 years of age and female cohort members’ waist circumference (p<0.001), but only before sequential multiple regression analysis (Table 4). Before and after the sequential multiple regression analysis better-educated cohort members tended to have lower waist circumference, on average, than less-educated men and women (both p<0.001). In women, before and after sequential multiple regression analysis the results for region at birth indicated that Wales had the highest mean waist circumference (both p<0.001). Before the sequential multiple regression analysis migrants had, on average, a lower waist circumference than sedentes (p<0.001), but no significant differences remained after sequential multiple regression analysis. There were no significant differences in waist circumference in relation to social and educational mobility (not presented).
Results of simple (unadjusted) and sequential (adjusted) multiple regression analyses to predict waist circumference (cm)
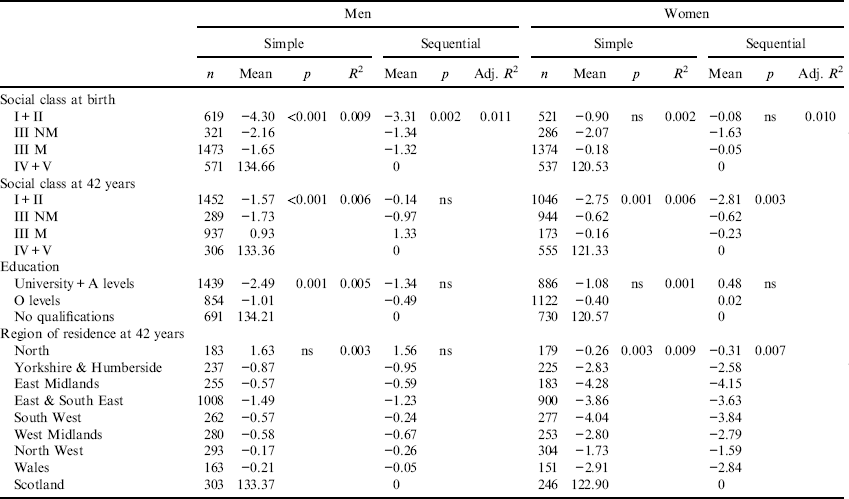
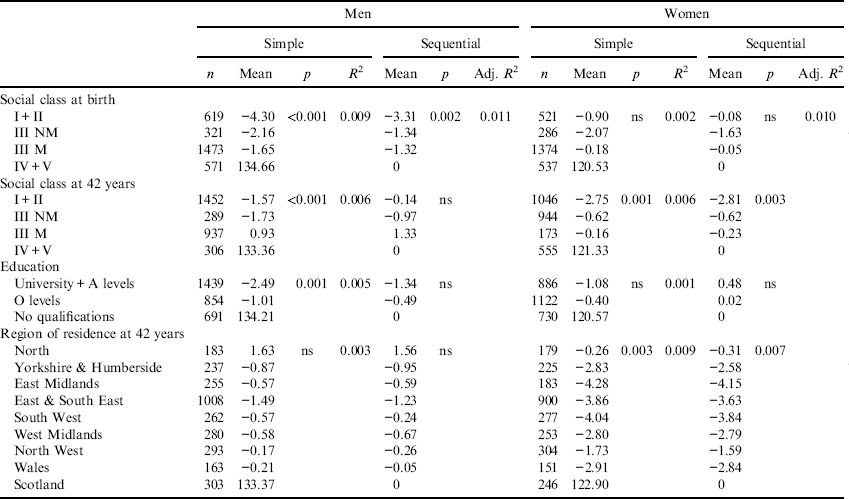
Before and after the sequential multiple regression analysis there was a general tendency for mean systolic blood pressure to increase from social class I+II to IV+V (Table 5) in men. The same direction of relationship was found for social class at 42 years of age for both sexes (p<0.001), but after the sequential multiple regression analysis the association remained significant only for female cohort members (p=0.003). Better-educated men tended to have lower mean systolic blood pressures than less-educated men (Table 5) (p=0.001), but after sequential multiple regression the differences were not significant. Before and after the sequential multiple regression analysis there was a regional variation in systolic blood pressure among women (p=0.003 and p=0.007, respectively), with Scotland having the highest mean systolic blood pressure (Table 5). In both sexes, there was no relationship between inter-generational social and educational mobility as well as regional migration and systolic blood pressure (not shown).
Results of simple (unadjusted) and sequential (adjusted) multiple regression analyses to predict systolic blood pressure (mm/Hg)
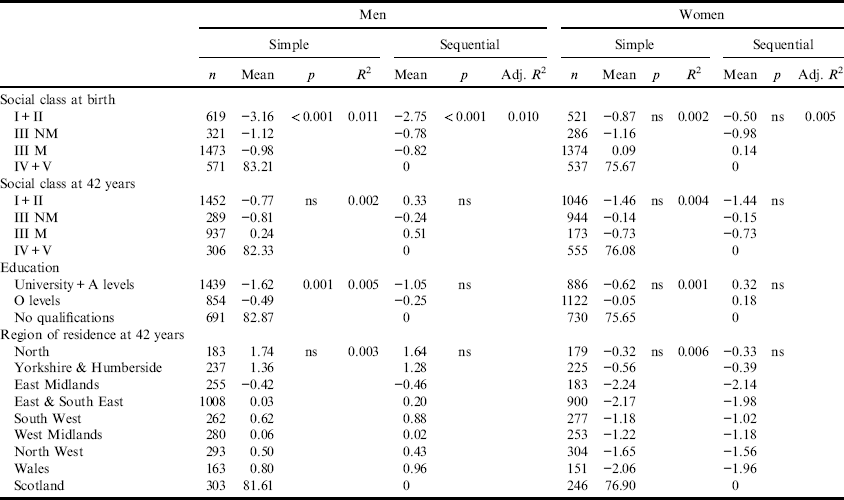
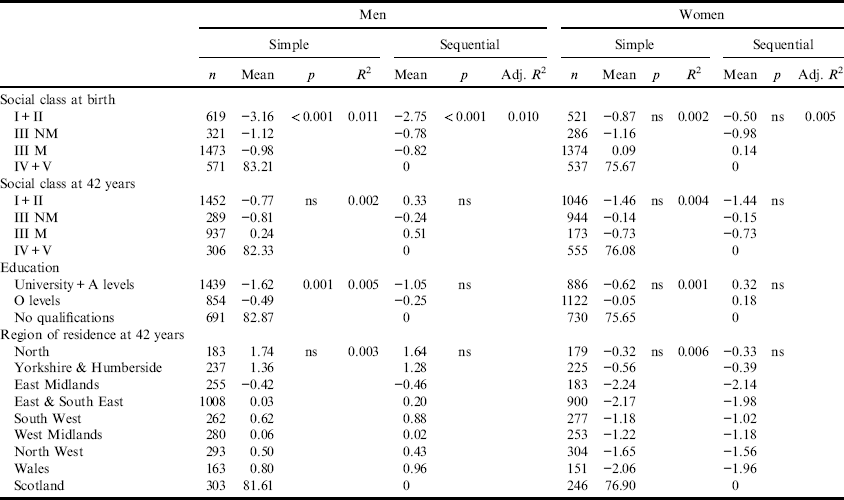
Before and after sequential multiple regression analysis there was a strong relationship between fathers’ social class and male cohort members’ diastolic blood pressure (p<0.001) with a tendency for mean diastolic blood pressure to increase from social class I+II to IV+V (Table 6). Before the sequential multiple regression analysis, better-educated men tended to have lower diastolic blood pressure, on average, than less-educated men (p=0.001). However, after the sequential multiple regression analysis no significant differences remained. In both sexes, there were no relationships between region at birth, social and educational mobility, regional migration and diastolic blood pressure (not presented).
Results of simple (unadjusted) and sequential (adjusted) multiple regression analyses to predict diastolic blood pressure (mm/Hg)
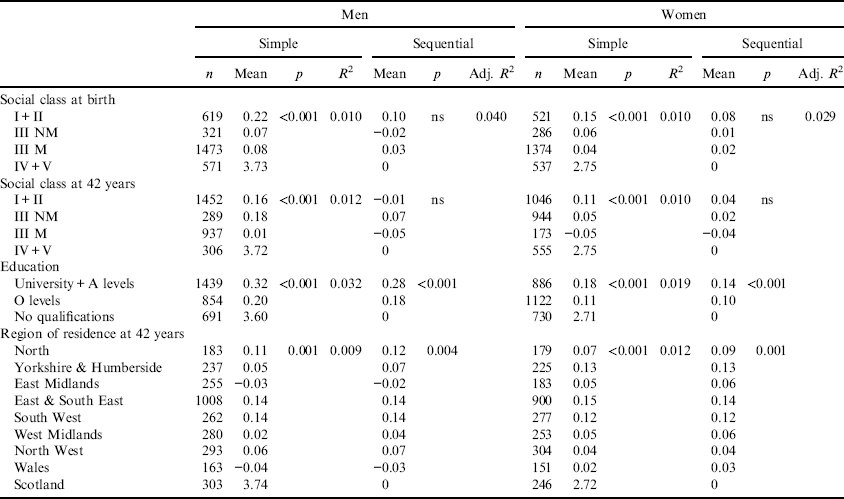
There was a positive association in both sexes between social class at birth and at 42 years of age and FEV1 (both p<0.001), but no significant relationships remained after sequential multiple regression analysis (Table 7). Education of the cohort members showed a significant association (p<0.001) with FEV1 in both sexes, with the better-educated having the highest values of FEV1. The relationship remained after controlling for the other variables (both p<0.001). Before and after sequential multiple regression analysis, in both sexes, there was a significant association between regional variation and FEV1 (both p<0.001), with higher mean values found in all regions compared with Scotland in female cohort members. The results for male cohort members’ educational mobility showed a strong relationship (p<0.001) with the downwardly mobile having a lower mean FEV1. But after sequential multiple regression analysis no significant differences remained. An association between regional migration and FEV1 was found in men (p=0.004) only before sequential multiple regression. In both sexes, there was no relationship between inter-generational social mobility and FEV1.
Results of simple (unadjusted) and sequential (adjusted) multiple regression analyses to predict FEV1 (ml)
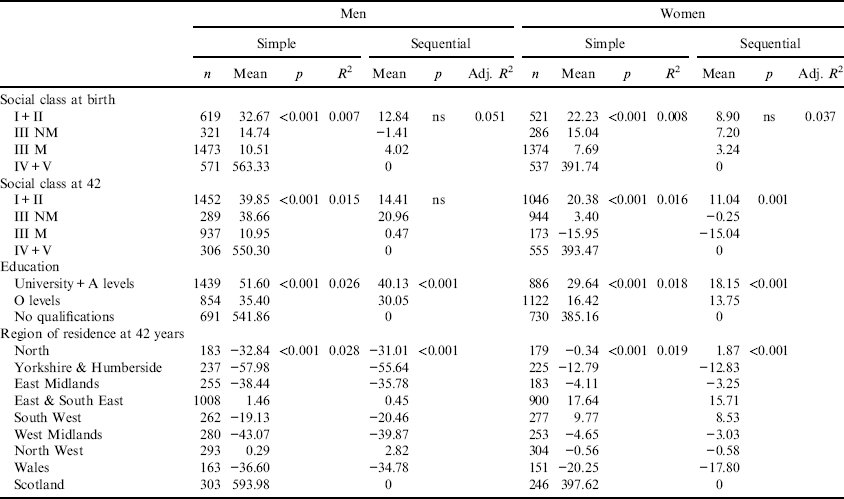
Although an association was found between father’s social class and PEF in both sexes (p<0.001), no significant differences remained after the sequential multiple regression analyses (Table 8). Social class at 42 years of age was also associated with PEF (p<0.001) but after the sequential multiple regression analysis the relationship only remained significant for female cohort members (p=0.001). Before and after sequential multiple regression analysis higher education of the cohort members was associated with higher mean PEF (both p<0.001). Before and after the sequential multiple regression analysis, region at birth showed a strong relationship with PEF in both sexes (p<0.001). In men, of the nine regions six showed lower mean PEF compared with Scotland, while the East & South East and North West regions had higher means; in women, only the East & South East and South West regions had higher mean values. In men, there was a relationship between educational mobility and PEF only before sequential multiple regression analysis (p=0.006), with the upwardly mobile having a higher mean. Regional migration only showed an association with PEF before sequential multiple regression analysis in male cohort members (p=0.002), with migrants having a higher mean value. Inter-generational social mobility was not found to be associated with PEF (not shown).
Results of simple (unadjusted) and sequential (adjusted) multiple regression analyses to predict PEF (l/min)
Discussion
This study was undertaken to examine the relationship between social class, education and region of residence, as well as inter-generational mobility/migration, and selected cardiovascular and lung function biomarkers in a cohort of British adults. The main strengths of the research included use of a large population-based longitudinal cohort study initiated in 1958, as well as use of objective measures (height, weight and cardiovascular and lung function biomarkers). The paper analysed indicators of socioeconomic status from childhood to adulthood (social class at birth, social class at 42 years, education) as well as their inter-generational changes (social and educational mobility as well as regional migration) simultaneously. Furthermore, social mobility was based on changes between all social classes, not simply a comparison of non-manual or manual groups versus stable positions in a social hierarchy. In addition, the study also analysed inter-generational educational mobility in relation to health status.
Cohort studies have both advantages and disadvantages and some limitations need to be kept in mind when interpreting the findings. First, as expected, studies that follow up participants over time at different life stages are exposed to sample attrition. Unavoidable losses caused by emigration (14.1% of the total 9.024 types of non-response in NCDS), deaths (14.7%), ‘non-issued’ (47.1%) or other reasons (24.1%) may introduce potential bias (Mostafa, Reference Mostafa2016). Thus, it could be argued that the greater representation of social classes I and II and the proportion of upward mobility at age 42 compared with birth could reflect the higher drop-out rates among lower social classes or downwardly mobile participants. However, the profile of social class distribution for the cohort members at 42 years reflected the overall profile of the population of the United Kingdom in the year 2000 (Amaranayake et al., Reference Amaranayake, Church, Hill, Jackson, Jackson and Myers2000). Furthermore, the upward and downward mobility rates for NCDS cohort members reported by Goldthorpe (Reference Goldthorpe2016) were comparable with those in the current study.
Similarly, it could be of interest to discuss if less-healthy individuals were more likely to drop out. There is evidence that the overall pattern of attrition was relatively low (Power & Elliott, Reference Power and Elliott2006) and similar to that in other British birth cohorts (Plewis et al., Reference Plewis, Calderwood, Hawkes and Nathan2004). Under-representation of certain groups (those with childhood cognitive and behavioural problems, children in social care) was not substantial and the sample size at 45 years was largely representative of the surviving cohort with respect to childhood and adulthood characteristics. More importantly, Atherton et al. (Reference Atherton, Fuller, Shepherd, Strachan and Power2008) found that NCDS participants at age 45 remained a good resource for life-course epidemiology. Second, use of data on the cohort members’ social class across time might introduce a potential problem with multicollinearity. However, in the present study the distribution of social class was found to change substantially from childhood to adulthood and there was no evidence of any significant multicollinearity.
The results of the present study generally indicated that education, social class and region at birth were the main variables associating with BMI, waist circumference, FEV1 and PEF. There is evidence that socioeconomic status in early life has a strong predictive effect on health status in adulthood (Barker et al., Reference Barker, Winter, Osmond, Margets and Simmonds1989; Wannamethee et al., Reference Wannamethee, Whincup, Shaper and Walker1996; Power & Matthews, Reference Power and Matthews1997; van de Mheen et al., Reference van de Mheen, Stronks, Looman and Mackenbach1998). For example, an independent association of childhood social class has generally been found with cardiovascular and obstructive lung disease risk factors, such as diastolic blood pressure, diabetes and serum cholesterol (Barker, Reference Barker1994; Blane et al., Reference Blane, Hart, Davey Smith, Gillis, Hole and Hawthorne1996), as well as self-rated health (Power et al., Reference Power, Manor and Matthews1999). Body mass index and waist circumference have also been shown to have an inverse relationship with father’s social class (Blane et al., Reference Blane, Hart, Davey Smith, Gillis, Hole and Hawthorne1996; Lahmann et al., Reference Lahmann, Lissner, Gullberg and Berglund2000; Langenberg et al., Reference Langenberg, Hardy, Kuh, Brunner and Wadsworth2003; Heraclides et al., Reference Heraclides, Witte and Brunner2008). Also, a prospective birth cohort study on men and women born in 1946 in England, Scotland and Wales found a significant relationship between father’s social class and all measures of obesity in both sexes (Langenberg et al., Reference Langenberg, Hardy, Kuh, Brunner and Wadsworth2003), even after adjustment for adult social class. However, a cohort study of London-based civil servants (Whitehall II) revealed an association only in women (Heraclides et al., Reference Heraclides, Witte and Brunner2008), while the Glasgow Alumni Cohort study showed an inverse association of paternal social class with mean BMI, but only in men (Okasha et al., Reference Okasha, McCarron, McEwen, Durnin and Davey Smith2003). Previous findings based on the British NCDS revealed that those with unskilled manual origins (social class at birth for men and age 7 years for women) and after adjustment for the cohort member’s educational level, had the highest risk of obesity in adulthood (Power & Matthews, Reference Power and Matthews1997; Power et al., Reference Power, Manor and Matthews2003). In the current study independent effects of father’s social class on BMI and waist circumference in adulthood were found. The cohort members from the lowest social classes of origin (IV+V) tended to have a higher mean BMI and waist circumference.
Lower parental socioeconomic position was found to be associated with higher blood pressure in adulthood in a 21-year follow-up of Finnish children and adolescents (Kivimäki et al., Reference Kivimäki, Lawlor, Davey Smith, Keltikangas-Järvinen, Elovainio and Vahtera2006). Similarly, in a collaborative study of employed men from the west of Scotland, diastolic blood pressure increased from social class I to IV and V, whereas the mean FEV1 trend was in the opposite direction (Blane et al., Reference Blane, Hart, Davey Smith, Gillis, Hole and Hawthorne1996). The findings from previous NCDS research have confirmed an inverse gradient of childhood social class I to V on cardio-respiratory risk factors, systolic and diastolic blood pressures as well as FEV1 in both sexes. However, after adjustment for adult social class, most associations for childhood attenuated (Power et al., Reference Power, Atherton, Strachan, Shepherd, Fuller and Davis2007). The current study showed a strong trend for mean systolic and diastolic blood pressure to increase from childhood social class I+II to IV+V in male cohort members. Furthermore, a negative association of female cohort members’ social class in adulthood on systolic blood pressure was found. The current findings also showed that in both sexes, mean FEV1 and PEF increased from social class IV+V to I+II. However, after adjustment for the other socioeconomic status variables, the association only remained significant for female cohort members’ adult social class and PEF.
Research on health-related social mobility has produced inconsistent results. It has been reported that individuals who experienced upward mobility have better health, while the downwardly mobile have poorer health (Power et al., Reference Power, Fogelman and Fox1986; Tiikkaja & Hemström, Reference Tiikkaja and Hemström2008; Kaplan et al., Reference Kaplan, Shema and Leite2008; Cleland et al., Reference Cleland, Ball, Magnussen, Dwyer and Venn2009; Högberg et al., Reference Högberg, Cnattingius, Lundholm, Sparen and Iliadou2012; Kuntz & Lampert, Reference Kuntz and Lampert2013). Weak evidence was found for downward social mobility being associated with a higher risk of limiting long-standing illness in currently employed Finnish men and women from the 1986 Survey on Living Conditions, but not for their British counterparts derived from the General Household Survey of 1988 and 1989 (Rahkonen et al., Reference Rahkonen, Arber and Lahelma1997). Similarly, a 14-year prospective longitudinal study of Swedish men and women did not report any associations between health status and mobility, either inter- or intra-generational (Novak et al., Reference Novak, Ahlgren and Hammarstrom2012).
Previous research of health-related social mobility using the British NCDS has confirmed a negligible effect of inter-generational social mobility on self-rated health inequalities with the downwardly mobile having poorer health and the upwardly mobile having better health. However, social mobility has not been found to have a major impact on health inequalities (Power et al., Reference Power, Fogelman and Fox1986, Reference Power, Matthews and Manor1996). In the current study social mobility was not found to have any impact on any of the studied biomarkers.
Although all components of socioeconomic status (occupation, education, income) in the epidemiological literature are important because of their influence on an individual’s life chances and living standards, education seems to have more of an impact than income or occupation on a broader spectrum of health determinants: behaviour, lifestyle, environmental exposure and health care (Mirowsky & Ross, Reference Mirowsky and Ross2003). Educational attainment is often referred to as a ‘fundamental cause’ of disparities in health and longevity (Link et al., Reference Link, Phelan, Miech and Westin2008; Masters et al., Reference Masters, Hummer and Powers2012; Montez & Hayward, Reference Montez and Hayward2014).
Three explanations have been put forward for the association between education and health. Firstly, schooling may causally improve health. It is well known that better-educated individuals have better access to information and resources to promote healthier lifestyles. Consequently, they have fewer functional limitations, are less likely to be disabled or suffer from chronic diseases, and have lower rates of mortality (Mirowsky & Ross, Reference Mirowsky and Ross2003). Secondly, the education–health relationship may reflect the influence of reverse causation: that is, individuals who experience poor health in childhood attain low levels of education (Case et al., Reference Case, Fertig and Paxson2005). A third explanation proposes common traits that influence both schooling and health (Montez & Friedman, Reference Montez and Friedman2015).
A number of studies have confirmed an inverse association between education level and higher BMI and waist circumference (Braddon et al., Reference Braddon, Rodgers, Wadsworth and Davies1986; Hermann et al., Reference Hermann, Rohrmann and Linseisen2011; Cavaco et al., Reference Cavaco, Eriksson and Skalli2014), higher risk factors for coronary heart disease (Wadsworth, Reference Wadsworth1997; Loucks et al., Reference Loucks, Abrahamowicz, Xiao and Lynch2011), worse lung function (FEV1) (Prescott et al., Reference Prescott, Lange and Vestbo1999; Shohaimi et al., Reference Shohaimi, Welch, Bingham, Luben, Day, Wareham and Khaw2004), certain cancers (Bucher & Ragland, Reference Bucher and Ragland1995), all-cause death rate (Goldblatt, Reference Goldblatt1990; Moser et al., Reference Moser, Pugh and Goldblatt1990) as well as smoking behaviour and physical inactivity (Winkleby et al., Reference Winkleby, Kraemer, Ahn and Varadu1998). Interestingly, some studies have reported different educational effects in men and women on health and well-being (White et al., Reference White, Blane, Morris and Mourouga1999; Sánchez-Vaznaugh et al., Reference Sánchez-Vaznaugh, Kawachi, Subramanian, Sánchez and Acevedo-Garcia2009; Powdthavee Reference Powdthavee2010). Some studies found an association between education and physical and mental health, as well as survival, with greater effects for women than for men (Ostrove & Adler, Reference Ostrove and Adler1998; Thurston et al., Reference Thurston, Kubzansky, Kawachi and Berkman2005; Ross & Mirowsky, Reference Ross and Mirowsky2006), whereas no consistent gender differences in the effects of education on various health measures such as limiting long-standing illness, asthma/wheezing, respiratory symptoms, obesity or psychological distress were found in another study (Matthews et al., Reference Matthews, Manor and Power1999). Previous findings using the British NCDS found that, in both sexes, the direct effect of education on adult health was not significant, whereas the indirect effect, through healthy behaviours and sense of control, was positive (Chandola et al., Reference Chandola, Deary, Blane and Batty2006). Other research conducted on the NCDS (Power et al., Reference Power, Jefferis and Manor2010) showed an inverse association between IQ score and systolic and diastolic blood pressures, BMI and waist circumference in mid-adulthood. The results of the current research are in accordance with those of other studies (McLaren, Reference McLaren2007) in showing an inverse educational gradient in BMI and waist circumference.
Although the association between education and health is well established in the literature, only a few studies have reported on inter-generational educational mobility in relation to health status. For example, a study of young Australian adults from the Childhood Determinants of Adult Health (CDAH) survey found that educational mobility from one generation to the next was associated with healthy lifestyle scores in both sexes, with these young adults adopting the lifestyles associated with the level of education that they attained (Gall et al., Reference Gall, Abbott-Chapman, Patton, Dwyer and Venn2010). In the current study, only an unadjusted inter-generational educational mobility effect on male FEV1 and PEF was found.
Regional variation in health has been widely reported for a broad range of variables in many countries (Wannamethee et al., Reference Wannamethee, Shaper, Whincup and Walker2002; Zheng & Tumin, Reference Zheng and Tumin2015). It is well known that there is a north–south divide in the United Kingdom, with northern England having higher obesity prevalence rates and coronary heart disease mortality rates than southern England (Bhatnagar et al., Reference Bhatnagar, Wickramasinghe, Williams, Rayner and Townsend2015; Lifestyles Statistics Team, Health and Social Care Information Centre, 2015; Zheng & Tumin, Reference Zheng and Tumin2015). The British Regional Heart Study (BRHS) of 7735 middle-aged men from 24 towns in England, Wales and Scotland showed that, regardless of where men were born, those living and examined in the South had lower mean blood pressures and levels of coronary heart disease than men living in Scotland. What is more, it appeared that factors acting in adult life seemed to be more important determinants of regional differences in blood pressure and coronary heart disease than those acting early in life (Shaper & Elford, Reference Shaper and Elford1991; Wannamethee et al., Reference Wannamethee, Shaper, Whincup and Walker2002). In a sample of residents in England and Wales born before October 1939 and at census in 1971, the same gradient in mortality from ischaemic heart disease influenced by geographical factors in early life, as well as in adulthood, and the greater effect of regional variation in adulthood in mortality from stroke was noted (Strachan et al., Reference Strachan, Leon and Dodgeon1995). By contrast, a study of migration between east and west Finland among men aged 35–64 indicated that being born in east Finland was a more important factor in mortality from ischaemic heart disease than was living there (Valkonen Reference Valkonen1987). Previous research on the British NCDS has reported unadjusted regional variation in BMI, diastolic blood pressure and FEV1 among non-migrants. Although migrants appeared to have lower BMIs and diastolic blood pressure, these effects were attenuated after adjustment for potential confounders and remained only for BMI. Region of current residence was much more important than region at birth, particularly for BMI, diastolic blood pressure and FEV1 (Strachan et al., Reference Strachan, Rudnicka, Power, Shepherd, Fuller and Davis2007). Likewise, an unadjusted regional variation in BMI was reported only in the father’s generation, with the greatest mean values in Wales and the North, and the lowest in the South West (Krzyżanowska & Mascie-Taylor, Reference Krzyżanowska and Mascie-Taylor2011).
The current study revealed heterogeneity by region in BMI, waist circumference and systolic blood pressure among female cohort members, as well as in FEV1 and PEF in both sexes, with inhabitants of northern England having worse levels of biomarkers, in general. What is more, there was an unadjusted association of regional migration on health status, especially in BMI of both sexes, as well as waist circumference, FEV1 and PEF only among male cohort members.
Acknowledgment
The authors are grateful to the Centre for Longitudinal Studies, UCL Institute of Education, for the use of the British National Child Development Study data and to the UK Data Archive and UK Data Service for making them available. However, these institutions bear no responsibility for the analysis or interpretation of these data.
Ethical Approval. The authors assert that all procedures contributing to this work comply with the ethical standards of the relevant national and institutional committees on human experimentation and with the Helsinki Declaration of 1975, as revised in 2008.
Conflicts of Interest. The authors have no conflicts of interest to declare.
Funding. This research received no specific grant from any funding agency, commercial entity or not-for-profit organization.