Aluminosilicates have been used widely in mullite ceramic industries due to their unique combination of alumina (Al2O3) and silica (SiO2) (Aksel, Reference Aksel2003; Yahya et al., Reference Yahya, Othman and Ahmad2016). Because of its excellent mechanical stability, low thermal expansion, low thermal conductivity, excellent creep resistance, high-temperature strength and good chemical stability, mullite has found applications in the steel and glass manufacturing industries, as well as in microelectronic packaging (Kool et al., Reference Kool, Thakur, Bagch, Hoque and Das2015; Schneider et al., Reference Schneider, Fischer and Schreuer2015; Saeidabadi et al., Reference Saeidabadi, Ebadzadeh and Salahi2018).
The mullite produced from aluminosilicates such as kyanite, andalusite and sillimanite decomposes to produce 3:2 mullite and an SiO2 polymorph at temperatures ranging from 1400°C to 1600°C due to excess SiO2 in the mineral (Kool et al., Reference Kool, Thakur, Bagch, Hoque and Das2015). This excess SiO2 may react with mineral impurities to form an undesired phase, which might affect adversely the product quality (Aguilar-Santillan et al., Reference Aguilar-Santillan, Balmori-Ramirez and Bradt2007). Previous studies have shown that the presence of a glassy phase in mullite prepared from aluminosilicate ceramic materials is detrimental to its mechanical properties and so limits its structural applications (Aksay et al., Reference Aksay, Dabbs and Sarikaya1991; Chen et al., Reference Chen, Lan and Tuan2000). The addition of excess Al2O3 may eliminate the possible formation of free SiO2, thereby producing a mullite–Al2O3 (MA) composite with improved quality (Tripathi et al., Reference Tripathi, Das, Mukherjee, Ghosh and Banerjee2001).
The use of pyrophyllite (Al2Si4O10(OH)2) in the production of mullite ceramics is limited (Mukhopadhyay et al., Reference Mukhopadhyay, Dana and Ghatak2011; Sule & Sigalas, Reference Sule and Sigalas2018). This might be attributed to the impurities present in the natural pyrophyllite, which might influence its properties and behaviour during sintering (Mukhopadhyay et al., Reference Mukhopadhyay, Ghatak and MaitI2010). Nevertheless, pyrophyllite may be a partial replacement for china clay and a viable alternative for kaolinite in end products where mullite is the desirable phase (Mukhopadhyay et al., Reference Mukhopadhyay, Ghatak and MaitI2010).
Previous studies have shown that ceramic products such as AL97ML in the armour systems manufacturing industry with Al2O3 contents ranging from 72 to 76 wt.%, containing either mullite or other aluminosilicates, would result in excellent mechanical properties (Sadik et al., Reference Sadik, Amrani and Albizane2014). Medvedovski et al. (Reference Medvedovski2006) also reported that MA ceramic composites containing small amounts of glassy phases would have better ceramic properties than pure mullite or pyrophyllite unless the Al2O3 content exceeds 98 wt.%. On the other hand, various studies are available on the improvement of the densification and mechanical properties of mullite with the addition of Al2O3, ZrO2 and SiC (Gao et al., Reference Gao, Jin, Kawaoka, Sekino and Niihara2002; Khor et al., Reference Khor, Yu, Li, Dong and Munir2003; Cascales et al., Reference Cascales, Tabares, Bartolomé, Cerpa, Smirnov, Moreno and Nieto2015). Aguilar-Santillan et al. (Reference Aguilar-Santillan, Balmori-Ramirez and Bradt2007) investigated the effect of attrition-milled kyanite and Al2O3 on mullite. They reported that attrition milling decreases the kyanite decomposition temperature and promotes the reaction of added Al2O3 with released SiO2 to form secondary mullite with a greater density. However, very limited information is available on the control of the glassy phase during the synthesis of mullite derived from the mixture of pyrophyllite and Al2O3 with improved microstructural and mechanical properties. In order to find a solution to this problem, significant amounts of Al2O3 were incorporated in a stoichiometric mullite composition to produce a MA product.
Previous works have reported on the synthesis of mullite and MA products from natural aluminosilicate minerals using conventional processing and sintering methods (Yamuna et al., Reference Yamuna, Devanarayanan and Lalithambika2002; Yan et al., Reference Yan, Li and Han2010). However, significant energy consumption during sintering necessitates the use of novel sintering techniques. Recently, spark plasma sintering (SPS) has been used in the fabrication of mullite (Zhang et al., Reference Zhang, Wang, Fu, Wang, Wang and Zhang2009; Ghahremani et al., Reference Ghahremani, Ebadzadeh and Maghsodipour2015). This technique is known to produce very dense ceramic materials with controlled grain growth (Suárez et al., Reference Suárez, Fernández, Menéndez, Torrecillas, Kessel and Hennicke2013). A previous study by the present authors showed that the SPS technique might be used to produce mullite from a mixture of pyrophyllite and α-Al2O3 (Sule & Sigalas, Reference Sule and Sigalas2018). An effort is therefore made to investigate the influence of excess α-Al2O3 powder on the microstructure, hardness and fracture toughness of MA produced from a pyrophyllite–Al2O3 mixture with respect to the firing time.
Materials and methods
Sample preparation
The pyrophyllite powder used in this study was mined in Ottosdal in South Africa (supplied by Wonderstone, Ltd), and the reactive α-Al2O3 (P172SB: 99.7% purity) was added to produce samples of MA. The particle size was measured using a Malvern Mastersizer particle-size analyser. The as-received pyrophyllite powder had an average particle size of <63 μm and the powder was milled to 0.5 μm. PANalytical X-ray fluorescence (model AXIOS mAX spectrometer at 50 kV and 50 mA) was used to characterize the mineralogy of the pyrophyllite powder. Then, the milled powder was fired in a furnace at 800°C for 30 min to produce a dehydroxylated pyrophyllite powder. The crystalline water molecules of phyllosilicates, including pyrophyllite, serpentine, talc and kaolinite, are lost during dehydration (Taylor, Reference Taylor1962). The chemical reaction of stoichiometric mullite composition from fired pyrophyllite and Al2O3 powder was expressed as:
 $$x\lpar {{\rm A}{\rm l}_2{\rm O}_3.4{\rm Si}{\rm O}_2} \rpar + y{\rm A}{\rm l}_2{\rm O}_3 = 1.2 \lpar 3{\rm Al}_2{\rm O}_3.2{\rm SiO}_2)$$
where x = 0.6 and y = 3.0.
Two different powder samples were synthesized: the first sample is 3:2 mullite powder that contains 40 wt.% dehydroxylated pyrophyllite and 60 wt.% Al2O3. The second powder sample was produced from 72 wt.% Al2O3 and 28 wt.% dehydroxylated pyrophyllite. The powders were mixed until homogeneous in an attrition mill using isopropanol and Al2O3 balls as milling media. The mixed powder (i.e. powder obtained after milling pyrophyllite and Al2O3 for 6 h) was oven dried at 60°C, and a 90 μm sieve was used to break down the soft agglomerates. A HPD5 SPS machine (FCT Systeme GmbH) was used to consolidate the powder. A pressure of 50 MPa was applied throughout the sintering cycle at 1600°C with heating rates of 100°C min–1 and soaking times of 10, 20 and 30 min, respectively. Furthermore, the sample was heated at 1350°C for 2 h to examine the effect of excess Al2O3 on microstructure.
Characterization of the sintered products
Phase identification was performed on the sintered specimen using X-ray diffraction (XRD; Bruker D2 Advance diffractometer at Wits University). Traces were collected over the 2θ range between 10° and 90° at room temperature (Cu radiation at 30 kV and 10 mA). The densities of the sintered samples were measured using the Archimedes principle. The samples were thermally etched at 1350°C and coated with a combination of carbon and gold–palladium. A field emission scanning electron microscope (FESEM; Carl Zeiss Sigma) was used to examine the microstructure of the polished surface. A Vickers hardness tester (FM 700) was employed to measure the hardness and fracture toughness of the sintered samples using the indentation technique at a load of 5 kg for 10 s. The fracture toughness was calculated according to the technique described by Anstis et al. (Reference Anstis, Chantikul, Lawn and Marshall1981). The samples were measured five times and the average values were reported.
Results and discussion
Characterization and densification of sintered samples
The as-received pyrophyllite powder contained 58.63 wt.% SiO2 and 30.30 wt.% Al2O3 with minor amounts of Fe2O3, FeO, TiO2 and K2O (Table 1). Figure 1 shows the particle-size distribution of the as-received pyrophyllite powder. The average particle size was 9.42 μm, which was reduced to 0.20 μm in mixed powder after 6 h of milling. The mineralogical composition of the as-received pyrophyllite powder was reported by Sule & Sigalas (Reference Sule and Sigalas2018). The XRD analysis was used to identify the phases present in the mixture of 72 wt.% Al2O3 and 28 wt.% pyrophyllite powder. Al2O3, dehydroxylated pyrophyllite and minor quartz were the dominant phases (Fig. 2). A small fraction of pyrophyllite was converted to an amorphous phase due to the structural disorder during milling (Kim et al., Reference Kim, Chae, Kwon, Kim, Lee and Kim2014).
Particle-size distribution of as-received pyrophyllite powder; d 10 = 3.32 μm, d 50 = 9.42 μm, d 90 = 45.05 μm.

XRD trace of milled 72 wt.% Al2O3 and 28 wt.% pyrophyllite powder.

Chemical composition (wt.%) of as-received pyrophyllite powder (Sule & Sigalas, Reference Sule and Sigalas2018).

LOI = loss on ignition.
In order to examine the effect of excess Al2O3 on stoichiometric 3:2 mullite, three samples containing excess Al2O3 were produced at 1600°C with various soaking times of 10, 20 and 30 min. Bulk densities of 3.374, 3.371 and 3.366 g cm–3 were obtained for MA mixtures sintered for 10, 20 and 30 min, respectively. These density values were greater than the density of 3.16 g cm–3 obtained for 3:2 mullite sintered at 1600°C for varying soaking times (Sule & Sigalas, Reference Sule and Sigalas2018). The increase in density of MA samples might be attributed to the fact that Al2O3 has a greater theoretical density of 3.95 g cm–3 (Olszyna et al., Reference Olszyna, Marchlewski and Kurzydłowski1997). Figure 3 shows the effect of soaking time on bulk density in excess Al2O3 samples sintered at 1600°C. The sample density decreases slightly with an increase in soaking time. This might be attributed to Al2O3 reacting with the SiO2 from thermally decomposed dehydroxylated pyrophyllite to produce 3:2 mullite over time (Mukhopadhyay et al., Reference Mukhopadhyay, Ghatak and MaitI2010).
Effect of soaking time on sintered MA density at 1600°C.

The XRD traces of samples sintered at 1600°C with various soaking times is shown in Fig. 4. No other phases apart from mullite and Al2O3 were observed. The relative intensities of the mullite peaks increased and those of the Al2O3 peaks decreased for the samples produced after 20 and 30 min.
XRD traces of MA samples sintered at 1600°C with progressive soaking times of 10, 20 and 30 min.

Microstructure evolution
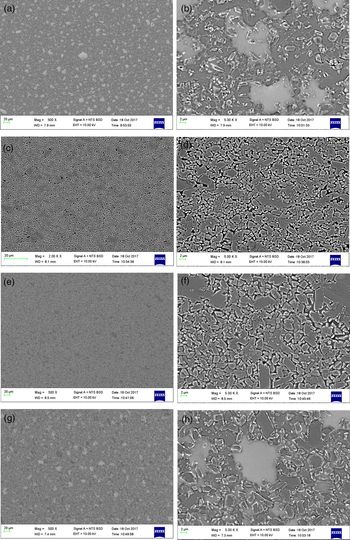
Figure 5a,b shows micrographs of 3:2 mullite sintered at 1600°C for 20 min, while Fig. 5c–h shows micrographs of MA mixtures fired for 10, 20 and 30 min. Typical equiaxial grain structures were observed in the mullite sample. The MA sample sintered for 10 min shows mixed acicular and equiaxial grains with spaces between the grains. The MA sample sintered for 20 min revealed an equiaxial grain structure similar to that of the mullite sample. In addition, the grains of the MA sample sintered for 20 min were packed more closely than those of the 10 min MA sample. The Joule heating effect of the SPS might enhance the densification in the MA sample sintered for 20 min (Ghahremani et al., Reference Ghahremani, Ebadzadeh and Maghsodipour2015). However, there is a slight increase in the grain size of the MA sample produced after 20 min of sintering, which might be attributed to the longer soaking time. By contrast, the sample sintered for 30 min contains a glassy phase with refined equiaxial grains. The morphologies of the mullite sample sintered for 20 min and that of MA sintered for 30 min were different. The excess Al2O3 in the 30 min sample decreased the glassy phase content considerably. This suggests that the glassy phase, attributed to the impurities that limit the structural properties of mullite product synthesized from the pyrophyllite and Al2O3 mixture, might be eliminated.
SEM images of (a,b) mullite samples sintered at 1600°C for 20 min, (c,d) MA sintered for 10 min, (e,f) MA sintered for 20 min and (g,h) MA sintered for 30 min.

Mechanical properties
A Vickers hardness value of 12.39 ± 0.47 GPa was observed for the sample sintered at 1600°C for 10 min. The hardness value increased slightly when the soaking time increased from 10 to 20 min, but it decreased at soaking times of 30 min. Hardness values of 12.43 ± 0.37 and 11.94 ± 0.08 GPa were obtained for 20 and 30 min soaking times, respectively. The microstructural features of the samples corroborated the hardness results obtained in this study. The MA samples sintered for 10 and 20 min soaking times have the same Vickers hardness values within measurement error. However, the hardness of the MA sample sintered for 30 min was slightly lower, but higher than that of the 3:2 mullite sample (11.52 ± 0.38 GPa) (Sule & Sigalas, Reference Sule and Sigalas2018). Cascales et al. (Reference Cascales, Tabares, Bartolomé, Cerpa, Smirnov, Moreno and Nieto2015) reported on the mechanical properties of mullite and MA produced by SPS. In that study, the MA sample has a hardness of 13.5 ± 0.1 GPa, which is slightly higher than that of mullite (12.5 ± 0.1 GPa) due to the presence of Al2O3. Figure 6 shows the influence of soaking time on the hardness of the samples.
Vickers hardness (Hv) at room temperature of the MA samples sintered at 1600°C with progressive soaking times of 10, 20 and 30 min.

Figure 7 depicts the fracture toughness (K IC) of the MA samples as a function of soaking time. An increase in soaking time resulted in a slight increase in fracture toughness. After 10 min of soaking time, the sample produced a fracture toughness of 2.58 MPa m–0.5, whilst after 20 and 30 min soaking times, the samples displayed fracture toughness values of 2.71 and 2.32 MPa m–0.5, respectively. A fracture toughness of 1.97 MPa m–0.5 was obtained for the 3:2 mullite sample. The greatest fracture toughness value was obtained for a 20 min soaking time. The hardness and fracture toughness values of the MA samples were greater than those of the stoichiometric 3:2 mullite samples due to the presence of excess Al2O3. Previous reports have shown that the fracture toughness of mullite produced from kaolin and Al2O3 increases with an increase in Al2O3 content (Chen et al., Reference Chen, Lan and Tuan2000; Cascales et al., Reference Cascales, Tabares, Bartolomé, Cerpa, Smirnov, Moreno and Nieto2015). On the other hand, the fracture toughness of the MA synthesized in this work is slightly greater than that reported for a SiC–mullite nanocomposite prepared by SPS (Khor et al., Reference Khor, Yu, Li, Dong and Munir2003). The density, hardness and fracture surface suggest that the pyrophyllite–Al2O3 composition with 72 wt.% Al2O3 sintered at 1600°C should be kept for a 20 min soaking time. This would prevent the specimens from having poorer mechanical properties due to the formation of a glassy phase, which may occur as a result of prolonged heating.
Fracture toughness at room temperature of the MA samples sintered at 1600°C with progressive soaking times of 10, 20 and 30 min.

Conclusion
This study confirmed that MA ceramics with attractive mechanical properties might be formed through the sintering of a pyrophyllite and α-Al2O3 mixture using SPS. The microstructure of the MA produced after a 20 min soaking time indicated that no glassy phase was present. The hardness and fracture toughness values of the MA consolidated by SPS showed superior strength compared to that of pure mullite. The optimal sintering conditions for MA ceramics synthesized from a pyrophyllite and Al2O3 mixture were a sintering temperature of 1600°C and a 20 min soaking time.
Acknowledgements
The authors thank their students for help in the laboratory.
Financial support
No specific funding was received for this study.
Conflict of interest
None.