INTRODUCTION
Models that accurately describe and predict fish growth and nutrient utilization can provide a means to develop strategies for improving the economic and environmental sustainability of aquaculture operations. A number of bioenergetics models have been developed to predict growth, feed conversion ratio (FCR) and waste outputs of various fish species (Cho Reference Cho1992; Cho & Bureau Reference Cho and Bureau1998; Kaushik Reference Kaushik1998; Cui & Xie Reference Cui, Xie, Theodorou and France1999; Bureau et al. Reference Bureau, Kaushik, Cho, Halver and Hardy2002, Reference Bureau, Gunther and Cho2003; Lupatsch & Kissil Reference Lupatsch and Kissil2005; Zhou et al. Reference Zhou, Xie, Lei, Zhu and Yang2005). These models are simple and practical, but the limitations of the energetic approach have been increasingly recognized (Birkett & de Lange Reference Birkett and de Lange2001a; Bureau et al. Reference Bureau, Kaushik, Cho, Halver and Hardy2002; de Lange & Birkett Reference de Lange and Birkett2005; Sandberg et al. Reference Sandberg, Emmans and Kyriazakis2005a, Reference Sandberg, Emmans and Kyriazakisb). Energy systems simplify the partitioning of dietary components into protein deposition (Pd) and lipid deposition (Ld) on the basis of their heats of combustion; they also disregard specific metabolic roles of different nutrients and their interaction, and ignore significant differences in contribution of protein and lipid towards live weight gain. However, lipid reserves can be mobilized to support Pd (Black Reference Black1974; Campbell Reference Campbell1988; Bureau et al. Reference Bureau, Hua and Cho2006). Pd and Ld also differ in energetic efficiencies (Emmans Reference Emmans1994; Birkett & de Lange Reference Birkett and de Lange2001a; Bureau et al. Reference Bureau, Kaushik, Cho, Halver and Hardy2002; Lopez & Leeson Reference Lopez and Leeson2008). Furthermore, live weight gain is driven by Pd due to the close association of water with Pd, whereas Ld results in little or no weight gain (Shearer Reference Shearer1994; Dumas et al. Reference Dumas, de Lange, France and Bureau2007). In other words, combining dietary components solely on the basis of their energy values does not allow a complete evaluation of chemical composition of the feed, or an adequate account of the role of a specific component in the metabolic process, or an assessment of the composition of the biomass gain. Furthermore, these models are empirically based on statistical interpretations of experimental data and, therefore, cannot be legitimately extrapolated to conditions beyond which data are collected (Baldwin Reference Baldwin1995; Thornley & France Reference Thornley and France2007). The current bioenergetics models are not sufficiently flexible to be applied to the wide range of conditions encountered in aquaculture (Bureau & Hua Reference Bureau, Hua, France and Kebreab2008).
Biochemical models, based on an explicit representation of biochemical reactions in individual tissues, provide a more accurate representation of nutrient utilization. There are several dynamic fish models explicitly tracking the metabolic use of nutrients, such as that developed by Machiels & Henken (Reference Machiels and Henken1986) for African catfish (Clarias gariepinus), and subsequent modifications or adaptations for tilapia (Oreochromis niloticus), rainbow trout (Oncorhynchus mykiss) (van Dam & Penning de Vries Reference van Dam and Penning de Vries1995), African catfish (C. gariepinus) and turbot (Scophthalmus maximus) larvae (Conceição et al. Reference Conceição, Verreth, Verstegen and Huisman1998). Recently a dynamic growth model was constructed based on explicit representation of metabolic pathways for Atlantic salmon (Salmo salar L.; Bar et al. Reference Bar, Sigholt, Shearer and Krogdahl2007). These models are useful in understanding biological mechanisms, and can be applied to a wider range of conditions than empirical models. However, mechanistic models are often complex, and dynamic models based on differential nonlinear equations usually require special software; therefore, practical application at the production level can be hindered. Moreover, increased accuracy or precision cannot be guaranteed from increased details in a system (McNamara Reference McNamara2004). Construction of mechanistic models requires adequate knowledge of the system, and relies on sufficient and accurate data to quantify the perceived system (Baldwin Reference Baldwin1995). The process of parameterization can be a major bottleneck in the development and application of models, particularly for complex mechanistic models (Kyriazakis Reference Kyriazakis and Kyriazakis1999). In addition, a very small inaccuracy in one variable that may not be apparent in static models (describing a process at one time), can accumulate significantly over time in dynamic models (McNamara Reference McNamara2004).
There is a need for a mechanistic approach to predict growth and nutrient utilization of fish while maintaining the general applicability in practical production systems. A nutrient-based model that combines empirical description of outcomes with conceptual equations provides a useful approach to deal with the main biological and physiological control points of nutrient partitioning in growing animals. Birkett & de Lange (Reference Birkett and de Lange2001a, Reference Birkett and de Langeb, Reference Birkett and de Langec) suggested using a nutrient flow modelling approach to represent explicitly the material flows of nutrients and the transformations of these nutrients as they are processed by an animal, avoiding the limitations associated with metabolizable energy (ME) or net energy (NE) models of energy utilization. The nutrient-based model for growing non-ruminant animals developed by Birkett & de Lange (Reference Birkett and de Lange2001a, Reference Birkett and de Langeb, Reference Birkett and de Langec) has been successfully used in pig production. The model describes explicitly the utilization of energy-yielding nutrients and metabolites for body Pd and body Ld at the whole animal level. Key to the model are rules that define partitioning of retained nutrients between Pd and Ld. This partitioning is constrained by three key parameters: an intrinsic upper limit to Pd (maximum daily rate of Pd (PdMax)), a minimum ratio (minLP) of whole body lipid (L) to protein (P) mass, and a maximum efficiency of using intake of the first limiting dietary amino acids (AAs) for Pd. PdMax is a concept that has been widely applied in swine nutrition. If energy intake is adequate, Pd increases with increasing supply of dietary AAs, governed by a maximum marginal efficiency of AA utilization, until reaching PdMax. AAs supplied in excess of requirements for Pd are catabolized. When Pd is below PdMax and is limited by energy intake, partitioning of energy-yielding nutrient intake to Pd and Ld is ruled by minLP.
Being non-ruminant vertebrate animals, fish share similarities with pigs in terms of digestive physiology and metabolism, as well as nutrient partitioning and energy utilization. The nutrient partitioning rules in terms of PdMax and minLP employed in the framework of the pig nutrient-based model may be applicable to fish. Azevedo et al. (Reference Azevedo, Leeson, Cho and Bureau2004b) present some experimental evidence supporting the existence of PdMax in fish. In large rainbow trout reared at constant temperature, Azevedo et al. (Reference Azevedo, Leeson, Cho and Bureau2004b) observed that there was a linear increase of body weight (BW) over time, while body protein concentration remained constant. This resulted in constant Pd per day for fish fed to satiation (Azevedo et al. Reference Azevedo, Leeson, Cho and Bureau2004b). The Pd curve developed for rainbow trout by Dumas et al. (Reference Dumas, de Lange, France and Bureau2007) also supports the existence of PdMax in rainbow trout. A few studies support the existence of a minimum ratio of Ld to Pd in fish (Meyer-Burgorff et al. Reference Meyer-Burgorff, Osma and Gunther1989; Azevedo et al. Reference Azevedo, Cho, Leeson and Bureau1998). A constant ratio of Ld to Pd has been observed to be independent of feeding level in juvenile tilapia (initial body weight (IBW)=7 g) (Meyer-Burgorff et al. Reference Meyer-Burgorff, Osma and Gunther1989), and in juvenile rainbow trout growing from 13 to 110 g (Azevedo et al. Reference Azevedo, Cho, Leeson and Bureau1998).
The objective of the current study was to investigate the extent to which the nutrient partitioning concepts used in the non-ruminant animal growth model of Birkett & de Lange (Reference Birkett and de Lange2001a, Reference Birkett and de Langeb, Reference Birkett and de Langec) are applicable to fish by adapting the nutrient-based model to fish and evaluating its performance in predicting growth of rainbow trout (O. mykiss).
MATERIALS AND METHODS
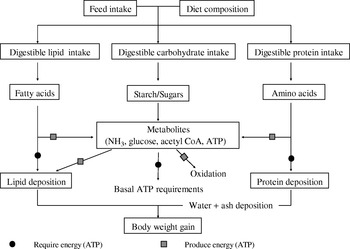
The nutrient-based growth model presented by Birkett & de Lange (Reference Birkett and de Lange2001a, Reference Birkett and de Langeb, Reference Birkett and de Langec) was adapted to fish through parameterization and various modifications consistent with its framework (Fig. 1). A detailed description of the complete conceptual and computational framework of the pig nutrient-based model, as well as its calibration procedure, can be found in Birkett & de Lange (Reference Birkett and de Lange2001a, Reference Birkett and de Langeb, Reference Birkett and de Langec). Briefly, the deterministic and dynamic model with a one-day iteration interval extended the representations of nutrient utilization used in conventional animal growth models. Daily feed intake was characterized by the explicit flows of essential AAs, non-specific nitrogen, crude fat, starch, sugars and fermentable material. Nutrient use is prioritized as follows: (1) a basal (maintenance) requirement for AAs, nitrogen (N) and adenosine triphosphate (ATP) independent of production level; (2) the potential Pd consistent with the remaining available AA intake and the animal's (genetic) performance potential (PdMax); and (3) daily lipid retention as the sink for excess nutrient intake, based on the constraint of mass balances for individual metabolite flows. Additional constraints were imposed on the chemical composition of growth to maintain a minimum L to P ratio when energy intake limits Pd (minLP).
A framework representing nutrient partitioning in growing fish.

The detailed procedures of model adaptation to fish are presented below. Although the model adaptation is intended to be applicable to fish in general, the values of parameters were empirically derived from studies conducted with rainbow trout. New metabolic factors pertinent specifically to fish were incorporated into the model to account for the determinant effect of water temperature on fish metabolism and the limited capacity of fish to utilize carbohydrates (Bureau et al. Reference Bureau, Kirkland, Cho, McCracken, Unsworth and Wylie1998). The model was then calibrated based on the energetic cost of Pd and Ld in rainbow trout as determined by Azevedo et al. (Reference Azevedo, van Milgen, Leeson and Bureau2005).
Model adaptation
Since fish are poikilothermic animals, their metabolic rate, growth, energy expenditure and feed intake are highly influenced by water temperature (Bureau et al. Reference Bureau, Kaushik, Cho, Halver and Hardy2002). Specific to the fish nutrient-based model, parameters such as PdMax, minLP, maximum utilization of glucose, maintenance AA and N requirements, and basal energy requirements are deemed to be influenced by water temperature. A linear relationship between growth rate, nutrient deposition and temperature was observed in the range of 6–15°C for rainbow trout (Azevedo et al. Reference Azevedo, Cho, Leeson and Bureau1998; Dumas et al. Reference Dumas, de Lange, France and Bureau2007). Therefore, a linear water temperature effect was assumed for PdMax, minLP, maximum utilization of glucose, maintenance AA and N requirements. This is deemed reasonable for practical rearing conditions (5–18°C) for rainbow trout. It has been observed that increasing water temperature results in a curvilinear (almost linear) increase in fasting heat production of fish up to the optimum temperature for growth; thereafter an increase of temperature results in no increase or even depression of fasting heat production (Bureau et al. Reference Bureau, Kaushik, Cho, Halver and Hardy2002). Therefore, basal energy requirements as a function of temperature were estimated by an empirical quadratic equation of Cho (Reference Cho1992) for fasting heat production (detailed equation is provided below).
AA metabolism and deposition
AA metabolism is explicitly represented in terms of maintenance requirements, inevitable catabolism, deposition as protein, catabolism of AAs supplied in excess of requirement and preferential catabolism of AAs for energy use. Essential AAs are individually represented, while non-essential AAs are not differentiated and converted to equivalents of non-specific nitrogen. To account for the effects of metabolic body weight (MBW; kg BW0·8) and water temperature, maintenance essential AA requirements reported in Rodehutscord et al. (Reference Rodehutscord, Becker, Pack and Pfeffer1997) were converted to mg/kg MBW/degree day. Maintenance N requirement for rainbow trout is estimated to be 2·2 mg/kg MBW/degree day based on data from Fournier et al. (Reference Fournier, Gouillou-Coustans, Métailler, Vachot, Guedes, Tulli, Oliva-Teles, Tibaldit and Kaushik2002).
Inevitable AA catabolism is the catabolism of the dietary first-limiting AA, which reflects activity of AA degrading enzymes and is unrelated to energetic need (Moughan Reference Moughan2003). Rodehutscord et al. (Reference Rodehutscord, Borchert, Gregus, Pack and Pfeffer2000) reported a marginal efficiency of utilizing lysine for Pd of 0·71 for rainbow trout fed a high protein diet when lysine was the first limiting AA. Due to lack of specific efficiency data for other AAs conducted with rainbow trout, a 0·70 marginal efficiency is assumed for all essential AAs in the model, corresponding to a rate of inevitable catabolism of 0·30 of digestible AA intakes in the model. Deposition of essential AAs is based on the whole body AA profile reported by Guillaume et al. (Reference Guillaume, Kaushik, Bergot and Métailler2001).
A temperature-dependent PdMax of 0·09 g/degree day is used. This value was obtained from a literature survey based on 117 data points from 27 studies that included immature rainbow trout (BW from 3 to 1265 g) fed to near-satiety with nutritionally adequate diets and reared at water temperature within the range of 6–18°C (Dumas et al. Reference Dumas, de Lange, France and Bureau2007).
Carbohydrate metabolism
Fish have limited ability to utilize carbohydrates. Excess intake of enzymatically degradable carbohydrates that yield glucose is assumed to be excreted in the urine or eliminated by other processes at no energetic cost (Bureau et al. Reference Bureau, Kirkland, Cho, McCracken, Unsworth and Wylie1998). Maximum utilizable glucose was estimated to be 0·67 mmol/kg MBW/degree day on the basis of the experiment by Bureau et al. (Reference Bureau, Kirkland, Cho, McCracken, Unsworth and Wylie1998). The production of volatile fatty acids (VFA) derived from enteric fermentation is assumed to be negligible in fish since enteric microflora are at least ten-fold lower than in pigs (Olsen et al. Reference Olsen, Sundell, Mayhew, Myklebust and Ringø2005; Shirkey et al. Reference Shirkey, Siggers, Goldade, Marshall, Drew, Laarveld and Van Kessel2006).
Lipid metabolism and deposition
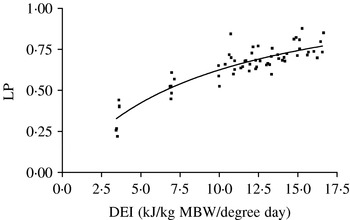
Fatty acids (FA) for Ld can be derived from dietary FA or synthesized de novo from glucose or AAs in intermediary metabolism or from mobilization of body fat. When Pd is limited by energy intake, Ld and Pd are constrained by minLP. The minLP is a parameter determined empirically from digestible energy intake (DEI) in rainbow trout using pooled data from studies of Azevedo et al. (Reference Azevedo, Cho, Leeson and Bureau1998) and Bureau et al. (Reference Bureau, Hua and Cho2006). In the study by Azevedo et al. (Reference Azevedo, Cho, Leeson and Bureau1998), the fish (IBW=13 g) were reared at temperatures between 6 and 15°C for 12 weeks, whereas in the study of Bureau et al. (Reference Bureau, Hua and Cho2006), the fish (IBW=150 g) were reared at 8·5°C for 24 weeks. In these studies, fish were fed diets that were not limiting in essential nutrients. The relationship was significantly (P<0·05) better represented by an asymptotic equation than a linear equation, as follows (Fig. 2):

where minLP=minimum body lipid to protein ratio, DEI=temperature adjusted DE intake, kJ/kg MBW/degree day and Sy.x=standard deviation of the residuals.
Relationship between the ratio of whole body lipid to whole body protein (LP) and DEI (kJ/kg MBW/degree day): LP=1·19/(1+9·06/DEI) (R 2=0·81, Sy.x=0·06).

Energy metabolism
Dietary gross energy values of crude protein, fat and starch were assumed to be 23·6, 39·5 and 17·2 kJ/g, respectively (Cho & Kaushik Reference Cho and Kaushik1990). Gross energy content of excreted urinary N compounds was taken to be 24·9 kJ/g N (Cho & Kaushik Reference Cho and Kaushik1990). There were six calibration parameters related to energy utilization in the pig growth model: ATPd (cost of intake of digestible dry matter (DM)), ATPx (cost of processing of undigested DM), ATPu (cost of N excretion), cost of Pd and related metabolic support processes (ATPp), such as protein turnover, cost of Ld and related metabolic support processes (ATPl) and basal energy requirement (ATPb). These requirements were expressed in terms of mol ATP. In the fish model, only three calibration parameters were used: ATPb, ATPp and ATPl. ATPu was assumed to be nil since N is excreted by fish at no energetic cost (Cho & Kaushik Reference Cho and Kaushik1990). ATPd and ATPx were also assumed to be nil, since the energy cost of ingesting or egesting feed DM is probably negligible in fish (Cho & Kaushik Reference Cho and Kaushik1990).
Basal energy requirement ATPb was approximated by converting fasting heat production (kJ/day) to ATP equivalents (assuming 1 mol ATP=52 kJ, Lehninger Reference Lehninger2000). The free energy released in vivo by breaking a high energy ATP bond varies somewhat according to thermodynamic conditions relating to temperature and the intercellular concentrations of ATP and ADP, but free energy is generally considered to be 52 kJ/mol ATP. ATP energy content varies in the literature, e.g. 74, 78 and 93 kJ ME/mol ATP being reported for ATP derived from glucose, FA and VFA, respectively (Armstrong Reference Armstrong, Lenkheit, Breirem and Crasemann1969; van Es Reference van Es, Buttery and Lindsay1980). This is because it is often given at the DEI level, rather than at the metabolite level, and the nutrient composition of the ME used to generate ATP will affect the energetic efficiency. Fish have a much lower (5–10-fold lower) basal energy metabolism than homeotherms (Bureau et al. Reference Bureau, Kaushik, Cho, Halver and Hardy2002), rendering model predictions not sensitive to ATP energy content and estimates of ATPb. Furthermore, water temperature has a major influence on basal metabolism of fish and estimates of fasting heat production (HeE) should take into account this effect. Based on oxygen consumption data of rainbow trout of different weights reared at different temperatures, the following empirical equation was developed to predict fasting heat production (kJ/day) of salmonids as a function of water temperature between 5 and 15°C by Cho (Reference Cho1992) :

where HeE=fasting heat production (kJ/day), T=water temperature (°C) and MBW=kg BW0·8. Therefore, ATP equivalents of ATPb=(−0·01+3·26×T−0·05×T 2)×MBW/52.
The parameter ATPp was estimated to be 0·30 mol ATP/g Pd, obtained by model calibration for energetic efficiency of using energy intake for digestible Pd (Kp) of 0·53 (Azevedo et al. Reference Azevedo, van Milgen, Leeson and Bureau2005). The parameter ATPl was estimated to be 56 mol ATP/mol triglyceride deposited, obtained from model calibration with an energetic efficiency of Ld (Kf) of 0·90 (Azevedo et al. Reference Azevedo, van Milgen, Leeson and Bureau2005). Azevedo et al. (Reference Azevedo, van Milgen, Leeson and Bureau2005) obtained the Kp and Kf values from rainbow trout fed diets containing 20 MJ/kg digestible energy and 300–500 g/kg digestible protein.
Prediction of BW and growth
Final BW (FBW) was calculated as

Water and ash contents were related to protein content through allometric equations:


Gut fill was assumed to be negligible and therefore estimated as nil.
Feed intake
In the pig growth model, daily DEI is related to BW through empirical equations. Estimates of the feed intakes clearly influence the accuracy of model predictions. Due to the difficulties of accurately predicting feed intake of fish from feed composition, biological and environmental factors (e.g. water temperatures), no attempt has been made to predict intake in the fish model. In simulations of specific experiments for model evaluation, the actual observed feed intakes are used as model inputs.
Sensitivity to parameter estimates
Sensitivity of model outputs to the key parameters – ATPp, ATPl, PdMax, inevitable AA catabolism and parameters in the equation relating minLP to DEI – was determined from simulations for fish of different sizes. Growth periods were included for small fish (10–100 g), medium-sized fish (200–300 g) and large fish supposedly having achieved PdMax (500–600 g). Each model parameter was increased by 10%, and the percent change in various predicted primary output variables (growth period, thermal-unit growth coefficient (TGC), feed efficiency (FE), Pd and Ld) was determined as a measure of model sensitivity.
Model evaluation
The model was evaluated by comparing the results of simulations with observations from various studies conducted with rainbow trout at the University of Guelph (Azevedo et al. Reference Azevedo, Cho, Leeson and Bureau1998; Reference Azevedo, Leeson, Cho and Bureau2004a, Reference Azevedo, Leeson, Cho and Bureaub) involving a wide range of rearing water temperatures, diet compositions, fish sizes and life stages. In Azevedo et al. (Reference Azevedo, Cho, Leeson and Bureau1998), rainbow trout were reared at four different temperatures (6, 9, 12 and 15°C), growing from 13 to 110 g. The fish were fed a practical diet containing 460 g/kg digestible protein and 20 MJ/kg digestible energy. The diet contained fish meal, fish oil, blood meal, maize gluten meal, brewer's dried yeast and whey. In Azevedo et al. (Reference Azevedo, Leeson, Cho and Bureau2004a), rainbow trout were reared on four diets growing from 47 to 200 g at a water temperature of 12°C. In Azevedo et al. (Reference Azevedo, Leeson, Cho and Bureau2004b), rainbow trout were reared on the four diets growing from 268 to 1580 g for 44 weeks at a water temperature of 8·5°C. The studies of Azevedo et al. (Reference Azevedo, Leeson, Cho and Bureau2004a, Reference Azevedo, Leeson, Cho and Bureaub) used four diets containing about 20 MJ/kg digestible energy and 300–500 g/kg digestible protein. The diets contained fish meal, fish oil, blood meal, maize gluten meal, wheat middlings and whey.
In all model simulations, diet composition (characterized by digestible nutrients) and observed feed intake (g/100 g BW/day) were used as model inputs. Feed intake was recorded on a weekly basis in the experiments. In model simulations, BWs of fish at the beginning and end of each week were calculated from observed IBW and observed growth rate in the experiments. Daily feed intake was then calculated as g/100 g BW/day and used as model input for each weight period. Model simulations were based on a growth period from observed IBW to observed FBW. Predicted growth rate, Pd, Ld and recovered energy (RE) over the growth period were compared with observed values from the experiments. Model simulations were considered to be significantly different from experimental observations when model simulations did not fall within 95% confidence interval of the experimental observations.
RESULTS
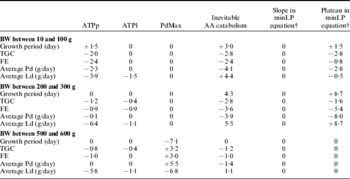
Table 1 presents the results of the analysis of parameter sensitivity, which is dependent on fish size and life stages. For small and medium-sized fish, the outputs are sensitive to inevitable AA catabolism, ATPp and minLP parameter, whereas for large fish, the greatest sensitivity is to PdMax.
Sensitivity test of model predictions (percent changes) to 10% increases in parametersFootnote * of ATPp, ATPl, PdMax, inevitable AA catabolism, or parameters in the equation relating minLP to DE intake. Model prediction response variables are growth period, TGC, FE, Pd and Ld

* The starting parameter values are presented in the text.
† minLP equation: minLP=Plateau/(1+slope/DEI).
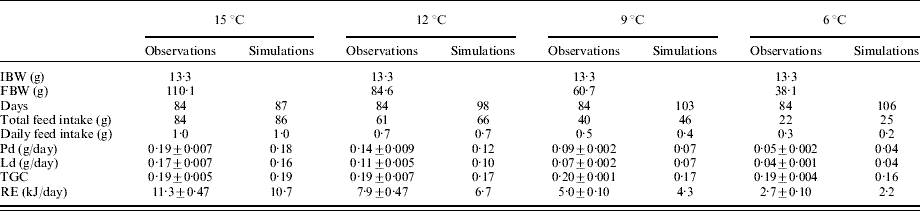
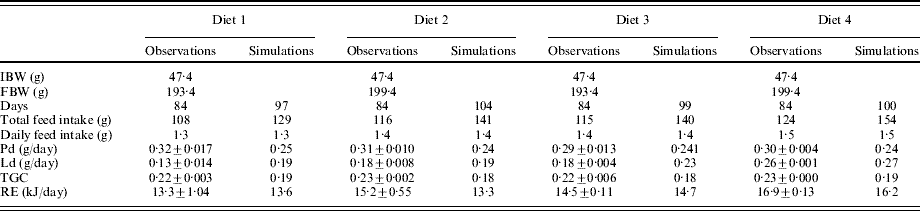
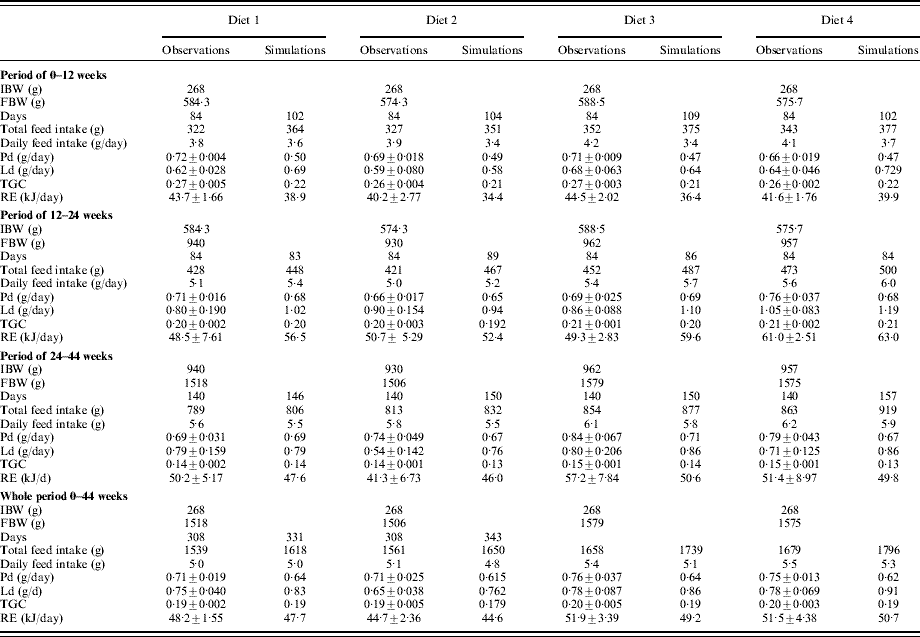
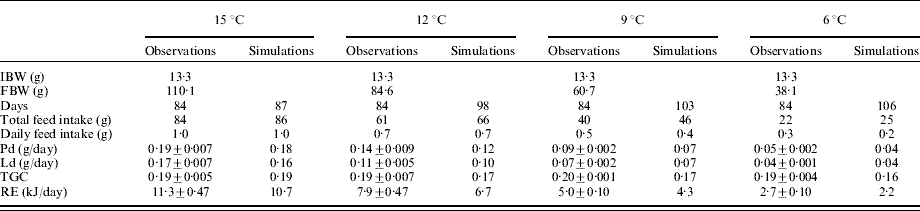
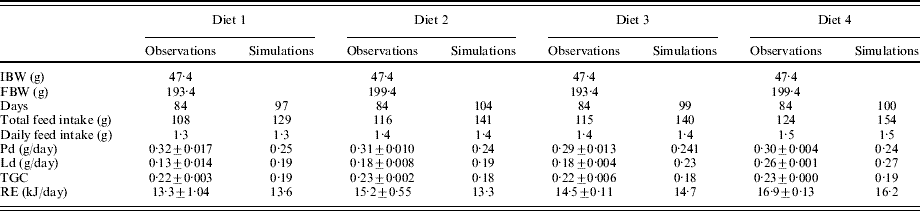
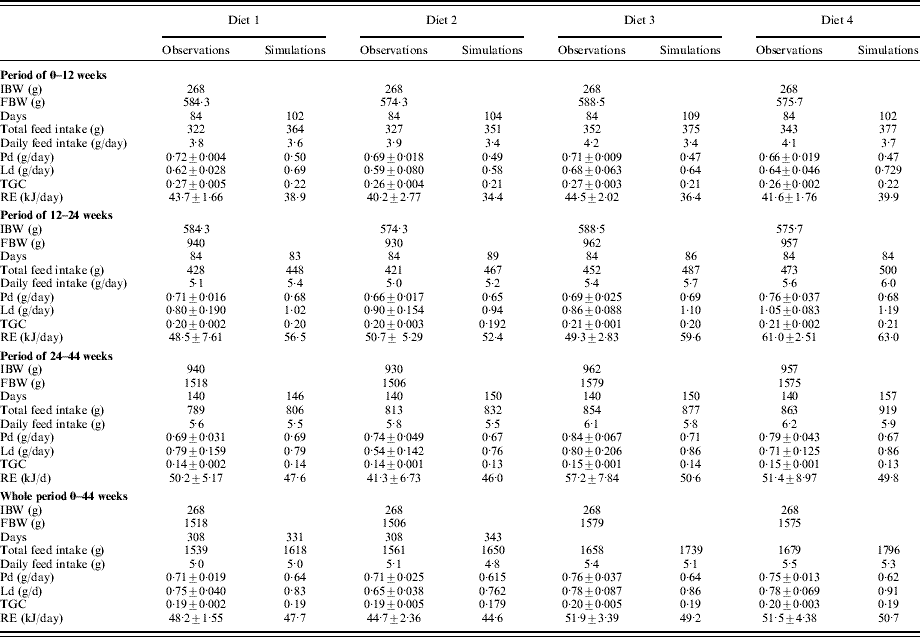
Comparisons of model simulations and experimental observations are presented in Tables 2–4. Table 2 compares model simulations with observations from Azevedo et al. (Reference Azevedo, Cho, Leeson and Bureau1998). Model predictions tended to underestimate Pd and growth at low water temperature. Table 3 compares model simulations with experimental observations from Azevedo et al. (Reference Azevedo, Leeson, Cho and Bureau2004a). While RE predictions agreed with the observations, there was a tendency for the model to underestimate Pd and overestimate Ld. Table 4 compares model simulations with observations from Azevedo et al. (Reference Azevedo, Leeson, Cho and Bureau2004b). For the first 12 weeks, the model tended to underestimate Pd and TGC, and overestimate Ld. For the periods of 12–24 weeks and 24–44 weeks, model predictions were in agreement with observations and none of the model-simulated parameters were significantly different from observed values. For the whole 44-week period, although there were numerical differences between model simulations and experimental observations of Pd, Ld and TGC, the differences were not significant except for TGC of fish fed Diet 4. The model simulations of RE agreed with experimental observations.
Comparison of model simulations with observations from Azevedo et al. (Reference Azevedo, Cho, Leeson and Bureau1998). The model simulated growth period (days) from observed IBW to observed FBW. Predicted TGC, Pd, Ld and RE over the growth period were compared with observed values from the experiments
Comparison of model simulations with observations from Azevedo et al. (Reference Azevedo, Leeson, Cho and Bureau2004a). The model simulated growth period (days) from observed IBW to observed FBW. Predicted TGC, Pd, Ld and RE over the growth period were compared with observed values from the experiments
Comparison of model simulations with observations from Azevedo et al. (Reference Azevedo, Leeson, Cho and Bureau2004b). The model simulated growth period (days) from observed IBW to observed FBW. Predicted TGC, Pd, Ld and RE over the growth period were compared with observed values from the experiments
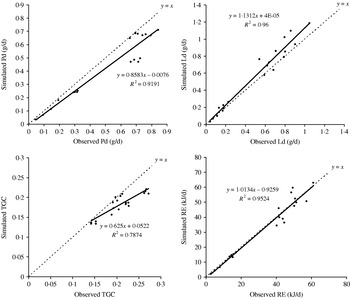
By pooling all model simulations from Tables 2–4 and comparing them with experimental observations, an overall evaluation of model simulations is illustrated in Fig. 3. The results suggest that, in general, RE simulations were agreeable with observations, but the model underestimated Pd by 15% and TGC by 37% and overestimated Ld by 13%.
Comparison of model simulations with experimental observations of Pd, Ld, TGC and RE.

DISCUSSION
The objective of the present study was to investigate if the concepts of nutrient partitioning used in a non-ruminant/pig growth model by Birkett & de Lange (Reference Birkett and de Lange2001a, Reference Birkett and de Langeb, Reference Birkett and de Langec) are applicable to fish. The model is presented as a general nutrient-based growth model supposedly applicable to all non-ruminant animals (Birkett & de Lange Reference Birkett and de Lange2001a, Reference Birkett and de Langeb), which is then adapted and calibrated for pigs in the final paper (Birkett & de Lange Reference Birkett and de Lange2001c). In the present study, the feasibility of incorporating and adapting selected concepts from the pig version of the model to fish was investigated. The nutrient-based model estimates weight gain and composition of weight gain for different animal types based on nutrient intake and the key factors affecting nutrient and energy partitioning, including the intake and balance of digestible essential AAs, PdMax and minLP.
The PdMax concept is well-documented in pigs. In the adapted fish model, a single PdMax value (0·09 g/degree day) was used, which was derived from a study of literature survey based on 117 data points from 27 studies (Dumas et al. Reference Dumas, de Lange, France and Bureau2007). In the survey, Pd linearly increased with BW and reached an apparent plateau of Pd at BW between 400 and 1300 g for rainbow trout. Sensitivity analysis showed that the model is moderately sensitive to the adopted PdMax value at higher BW and when PdMax drives growth. PdMax is fundamental to the adaptation of the pig model since it incorporates a degree of maturity into growth predictions. Further studies are necessary to explore variation in PdMax among different groups of fish. Nonetheless, the current adapted fish model is shown to be quite accurate for predicting nutrient partitioning in fish over 500 g and when PdMax drives growth.
The independence of the effects of protein intake and energy intake on Pd has been well established for pigs. When AA intake is limiting, additional intake of energy has no effect on Pd and preferential catabolism. In that case, dietary limiting AA is not used to meet energy needs (Moughan Reference Moughan and Kyriazakis1999). However, contrary to what is seen in pigs, the efficiency of utilization of limiting essential AA was found to be affected by dietary digestible energy level in fish (Encarnação et al. Reference Encarnação, de Lange, Rodehutscord, Hoehler, Bureau and Bureau2004). Furthermore, this effect was dependent on the type of energy-yielding nutrients. The lysine-sparing effect exerted by lipids/fatty acids was not observed with other energy-yielding nutrients (Encarnação et al. Reference Encarnação, de Lange and Bureau2006). Compared with other non-ruminant animals, fish seem to have a more ‘elastic’ inevitable AA catabolism. This is probably due to fish having limited ability to use carbohydrates as energy sources, and therefore AAs and lipids are effective dietary energy-yielding components for fish. Nutrient metabolism observed in fish might therefore have to be represented dynamically through alternative and competing metabolic pathways. In the nutrient-based model, a high level (whole animal) approach is used to control partitioning of limiting nutrients when competing uses are applicable. A fish model may require a more direct representation of the body's metabolic control mechanism. To do so, it would require a dynamic metabolic model which is beyond the scope of a nutrient-based model such as that described in the current paper. Under the current model framework, imbalanced AA intake is channelled to Ld, which could have resulted in the minor overestimation of Ld, when one or more digestible AA is marginally deficient but without obvious negative impact on fish growth performance in practice.
The energy partitioning rule of minLP is central to the nutrient-based model. In pigs, minLP is determined as the ratio of body lipid to protein when energy intake is insufficient to achieve PdMax and AA intake is not limiting Pd. In the current adapted fish model, body composition data from rainbow trout fed at four intake levels (0·25, 0·50, 0·75 and 1·00 of near-satiation) (Bureau et al. Reference Bureau, Hua and Cho2006) and three intake levels (0·70, 0·85 and 1·00 of near-satiation) (Azevedo et al. Reference Azevedo, Cho, Leeson and Bureau1998) were used, on the assumption that Pd would have been limited by energy and not by PdMax. This assumption was supported by the linear effect of energy intake on Pd in these experiments. The relationship between DEI and minLP ratio from the pooled data of Azevedo et al. (Reference Azevedo, Cho, Leeson and Bureau1998) and Bureau et al. (Reference Bureau, Hua and Cho2006) was best represented by an asymptotic relationship. Even though this asymptotic relationship is a statistically better fit to the data than a linear relationship (i.e. minLP=0·266+0·033×DEI (kJ/kg MBW/degree day), R 2=0·77, Sy.x=0·07), there was still variance unexplained by the asymptotic equation. Sensitivity analysis also indicates that this is a key parameter for medium-sized fish. The comparison of model simulations and experimental observations suggests that RE is relatively well predicted, while Pd is underestimated and Ld is overestimated. This indicates that the minLP energy partitioning rule makes a significant contribution to the observed discrepancies in the present study and should be explored further. Important first steps are to characterize more accurately at what stages of growth and up to what energy intake level energy intake determines Pd in different fish types and to characterize effects of BW and diet nutrient composition on minLP.
In the adaptation of the model, it became apparent that DEI should be expressed as a function of MBW and water temperature when determining its relationship to minLP, rather than using absolute DEI values as in the model by Birkett & de Lange (Reference Birkett and de Lange2001a, Reference Birkett and de Langeb, Reference Birkett and de Langec). This modification is necessary for fish, because feed intake was influenced not only by fish size but also by temperature. However, in the study of Azevedo et al. (Reference Azevedo, Cho, Leeson and Bureau1998), the effects of BW and water temperature may be confounded since fish reared at different temperatures had different FBWs. Eliminating the temperature effect in the minLP to DEI relationship resulted in a similar shape of fitting curve and yielded simulation results similar to those presented in Tables 2–4 (data not shown). On the conceptual grounds that fish are poikilothermic organisms and that temperature has a determinant effect on their growth and metabolism, it was decided to retain temperature in the minLP equation. Future experiments that independently investigate the effects of temperature, as well as BW, on minLP may provide more information on this issue.
CONCLUSION
The present study investigated the feasibility of adapting selected concepts from a pig growth model to fish through incorporating parameters related to fish metabolic characteristics as well as re-determination of key model parameters. The resulting fish nutrient-based model underestimates Pd and overestimates Ld under PdMax, while it predicts RE well. These results, combined with sensitivity analysis indicate that the primary source of the discrepancies between predictions from the adapted fish model and experimental observations is the rule that governs the partitioning of retained nutrients between Pd and Ld when energy intake is insufficient to reach PdMax, represented by the minLP parameter. As suggested by the variance of the relationship between minLP and DE intake, minLP appears to be also affected by factors other than DEI. Further development of the model should strive to differentiate and quantify these factors.
Growth of animals is determined by accretion of the body components water, protein, fat, minerals and a small amount of other components (glycogen, etc.). Growth of body components and the efficiency with which the nutrients are converted are affected by numerous endogenous (species, genetics and life stage) and exogenous (diet composition, feeding level, environment and season) factors. At present, these factors, especially the endogenous determinants of AA utilization and Ld in fish, are not fully understood. Further research is necessary to elucidate these factors and their effects. Model development is limited at present by the lack of experimental data for completely independent parameterization and evaluation. Nevertheless, the current model adaptation and evaluation should be of value for improving understanding of growth and nutrient partitioning processes in fish. In addition, the present study has contributed to future research by identifying the most significant gaps in current knowledge.
This work was financial supported provided by AquaNet – the Network of Centres of Excellence in Aquaculture (Canada) and the Fats and Proteins Research Foundation (Alexandria, VA, USA).