Introduction
Due to the appealing interplay of color and gloss, pearlescent pigments have become popular in automotive paints, plastics, consumer electronics, and cosmetics (Horiishi et al. Reference Horiishi, Kathrein, Krieg, Pfaff, Pitzer, Ronda, Schwab, Besold, Buxbaum, Buxbaum and Pfaff2005; Maile et al. Reference Maile, Pfaff and Reynders2005). The color is obtained by interference of visible light on thin films of high and low refractive index. For luster and brilliance effects, a platy morphology of the pigment core and also the pigment coating are important. Applying layered materials, like mica, with an appreciable aspect ratio (ratio of diameter to thickness) as the pigment core, inevitably leads to a parallel alignment with respect to the applied surface giving the desired lustrous effect. By combining interference with absorption of visible light, the accessible color range can be extended by, for instance, applying light-absorbing coatings such as iron oxides (Pfaff and Weitzel Reference Pfaff, Weitzel and Charvat2004; Horiishi et al. Reference Horiishi, Kathrein, Krieg, Pfaff, Pitzer, Ronda, Schwab, Besold, Buxbaum, Buxbaum and Pfaff2005).
The coating environment imposes severe restrictions on the choice of core material. For instance, in the state-of-the-art commercial coating of mica, TiCl4 is applied as the affordable TiO2 source. The hydrolysis of TiCl4 results in a low pH of ~3 which, in combination with typical processing temperatures of up to 100°C, represents a corrosive environment for oxides or even silicates (Pfaff Reference Pfaff and Smith2002; Komadel and Madejová Reference Komadel, Madejová, Bergaya, Theng and Lagaly2006).
A commonly applied mica, fluorophlogopite (Fig. 1a,b), is a 2:1 layered silicate with a high charge density of the silicate layer. The strong electrostatic attraction with K+ renders the interlayer space inaccessible to ion-exchange, hydration of K+, and even acid attack. Acid attack can consequently only occur through the edge surface, which is comparatively small due to the platy morphology and the large particle diameter (5–200 μm). Therefore, fluorophlogopite shows only negligible dissolution during the coating process.
a Schematic structure of fluorophlogopite, b SEM images of fluorophlogopite, c montmorillonite, and d fluorohectorite platelets

For low-charge, so-called ‘swelling’ 2:1 layered silicates, such as natural montmorillonite, the interlayer space is available for ion-exchange and the cation exchange capacity (CEC) has been utilized to incorporate cationic organic dyes (Baranyaiová and Bujdák Reference Baranyaiová and Bujdák2018; Boháč and Bujdák Reference Boháč and Bujdák2018). For this class of inorganic/organic hybrid pigments, infinite color variations and higher coloring strength are at hand due to high absorption coefficients of organic dyes in the visible region. They also show surprising thermal stability, allowing these montmorillonite-based pigments to be used for coloring polymers in melt compounding (Koyama et al. Reference Koyama, Tanoue, Iemoto, Maekawa and Unryu2009; Smitha et al. Reference Smitha, Manjumol, Ghosh, Brahmakumar, Pavithran, Perumal and Warrier2011; Choudhary and Sengwa Reference Choudhary and Sengwa2014).
Such montmorillonite-based hybrids are inappropriate as core materials for pearlescent pigments for two reasons. Firstly, their diameter is too small (<200 nm, Fig. 1c). Secondly, as will be shown below, montmorillonites exchanged with organic cations are not stable in acidic environments and the structure dissolves by the attack of octahedral cations releasing small amounts of the dye into solution.
Synthetic fluorohectorite is another swelling 2:1 layered silicate (Stöter et al. Reference Stöter, Kunz, Schmidt, Hirsemann, Kalo, Putz, Senker and Breu2013) with accessible interlayers but which comes in diameters comparable to typical mica platelets (Fig. 1d), and is a promising new candidate for pearlescent pigment core platelets. Because the commercial coating process with TiO2 takes place in an acidic environment at elevated temperature, the main objective of this study was to compare the stabilities of montmorillonite and fluorohectorite hybrids under given conditions.
EXPERIMENTAL SECTION
Synthesis of Fluorohectorite
Fluorohectorite (Hec) was synthesized from a melt as described in detail previously (Kalo et al. Reference Kalo, Möller, Ziadeh, Dolejš and Breu2010). To improve intracrystalline reactivity, the pristine hectorite was heated in an autoclave for 72 h at 340°C.
Purification of SWy-1 Montmorillonite
SWy-1 montmorillonite, obtained from the Source Clays Repository of The Clay Minerals Society, was purified prior to use in order to remove residual carbonates and amorphous ferric (oxyhydr)oxides (Mehra and Jackson Reference Mehra and Jackson1958). After purification, montmorillonite (Mnt) was dialyzed for two days until the conductivity of the water remained below 1 μS/cm.
Dyes
3,7-Bis(dimethylamino)phenothiazin-5-ium chloride (MB, Sigma-Aldrich, St. Louis, Missouri, USA), 4-N,N-dimethyl-2,5-cyclohexadien-1-iminium chloride (MAL, Molekula, Darlington, UK), and 3,7-Diamino-2,8-dimethyl-5-phenylphenazin-5-ium (SAF, Alfa Aesar, Haverhill, Massachusetts, USA) were used as received.
Ion-exchange
Solutions of dyes with a concentration of ~0.02 M and 0.2 wt.% clay dispersions were prepared with Milli-Q water. The interlayer Na+ ions were exchanged upon addition of an aliquot volume of dye solution, in the amount of 100% CEC. Afterward, the samples were shaken in an overhead shaker (IKA, Staufen im Breisgau, Germany) for 8 h at room temperature.
Acid Stability Test
40 mL of clay dispersion corresponding to a constant clay weight of 80 mg was adjusted to pH 1 with 1 M HCl. During the acid treatment, the sample was stirred at 75°C for 6 h. After the acid treatment, the sample was centrifuged at 14,090 × g and washed with Milli-Q water three times. The collected supernatant was filtered using a CHROMAFIL Xtra PET-20/25 membrane filter with 0.20 μm pore size and analyzed for dissolved Mg2+ by atomic absorption spectroscopy using a Perkin-Elmer 2380 spectrophotometer (PerkinElmer, Waltham, Massachusetts, USA).
Adsorption Capacities
In order to determine the adsorption capacities of the clays, the ion-exchanged samples were centrifuged at 14,090 × g for 15 min and the supernatant was filtered using a CHROMAFIL Xtra PET-20/25 membrane filter with 0.20 μm pore size. The amount of non-adsorbed dye in the filtered supernatant was determined colorimetrically with a Varian Cary 300 double beam spectrophotometer (Varian, Palo Alto, California, USA).
Powder X-ray Diffraction
Textured films were prepared by suspending a few drops of the dispersion onto microscope slides (Menzel glass). Prior to measurement, samples were dried at room temperature for 24 h. Powder X-ray diffraction (PXRD) patterns were recorded in Bragg-Brentano geometry using Ni-filtered CuKα radiation (λ = 0.1541 nm) using a PANalytical Empyrean diffractometer equipped with a PIXcel1D detector (Malvern Panalytical, Kassel, Germany). All patterns were analyzed using Panalytical’s Highscore Plus software.
Thermogravimetric Analysis
To speed up the kinetics of the thermal decomposition, the sample surface was increased by lyophilization using a Christ Alpha 1-4 freeze-dryer (Martin Christ, Osterode am Harz, Germany). The thermal stability of samples was then examined using a thermogravimetric analyzer NETZSCH STA 449 C (Netzsch, Selb, Germany) through the temperature range 25–900°C at a heating rate of 10°C/min under synthetic air atmosphere containing 20.5 vol.% O2 and 79.5 vol.% N2.
Infrared Spectroscopy
Infrared transmittance spectra were recorded using a Jasco FT/IR 6100 (Jasco, Hachioji City, Japan) spectrophotometer equipped with a diamond ATR (Pike technologies, Madison, Wisconsin, USA). Transmittance spectra were subjected to background subtraction and normalized.
Reflectance Spectroscopy and Chromaticity Coordinates
Diffuse reflectance spectra of solid samples were measured with a Varian Cary 300 double beam spectrophotometer (Varian, Palo Alto, California, USA) equipped with a DRA-CA-30I diffuse reflectance accessory. The measured spectrum was used to calculate the tristimulus values by multiplying the reflectance values by the values of the color-matching functions. Afterwards, the chromaticity coordinates of the CIE 1931 color space (x, y) were calculated by normalizing previously obtained tristimulus values (Torrent and Barrón Reference Torrent, Barrón, Ulery and Drees2008).
Scanning Electron Microscopy
For electron microscopy characterization, samples dispersed in water were dropped onto a silicon wafer and dried at room temperature for 24 h. Prior to the sample deposition, silicon wafers were cleaned in piranha solution (3:1 v/v H2SO4:H2O2) for 24 h and rinsed several times with Milli-Q water. To ensure a clean surface, the silicon wafer was also cleaned using the CO2 snow jet procedure (Sherman et al. Reference Sherman, Hirt and Vane1994). After cleaning, the surfaces of silicon wafers were hydrophilized by treating them with plasma. In order to visualize clay-hybrids, the samples were coated with a very thin (2 nm) layer of platinum using a Cressington Platin-Sputter Coater 208HR (Cressington Scientific Instruments UK, Watford, UK). Prepared samples were examined with a field emission scanning electron microscope Zeiss Ultra plus (Carl Zeiss AG, Oberkochen, Germany) under a vacuum of ~10–5 mbar.
Calculations
The van der Waals volumes of the organic cations were calculated using chemicalize.com (Swain Reference Swain2012).
RESULTS AND DISCUSSION
Coloring Strength
Colored clay hybrid materials were obtained by cation exchanging Na+ in Mnt ([Na0.30][Al1.50Fe0.20Mn0.01Mg0.27 Ti0.01][Si3.99Al0.01]O10(OH)2) (Hall and Astill Reference Hall and Astill1989; Collins et al. Reference Collins, Fitch and Catlow1992) and Hec by cationic dyes. The negative layer charge of these clay minerals is a consequence of an isomorphous substitution of aluminum mainly with magnesium and iron in Mnt, and substitution of magnesium by lithium within the octahedral sheet in Hec. The CEC as determined by the [Cu(trien)]2+ method (Ammann et al. Reference Ammann, Bergaya and Lagaly2005) was 0.71 mEq/g for Mnt and 0.90 mEq/g for Hec. By dispersing in deionized water, the clay minerals swelled osmotically (Stöter et al. Reference Stöter, Kunz, Schmidt, Hirsemann, Kalo, Putz, Senker and Breu2013). After the ion-exchange with organic cations, the interlayer space became hydrophobic and collapsed yielding stacks of several silicate layers (Kunz et al. Reference Kunz, Leitl, Schade, Schmid, Bojer, Schwarz, Ozin, Yersin and Breu2015).
Organic dyes MB, MAL, and SAF (Fig. 2) were chosen because they are soluble in water and possess a large absorption coefficient in the visible region. Consequently, even traces of these dyes remaining in solution after ion-exchange can be determined precisely by conventional UV-Vis spectroscopy. Choosing water as a polar solvent shifted the partition function towards hydrophobic dyes being intercalated (Stöter et al. Reference Stöter, Biersack, Reimer, Herling, Stock, Schobert and Breu2014). When applying dyes in amounts corresponding to 100% of the CEC, all dyes are almost completely intercalated (Table 1) supporting the preference of organic dyes for the interlayer space.
Structures of organic dyes and photographs of corresponding Hec-hybrids

Amount of dye intercalated and calculated van der Waals volumes

Completeness of ion exchange was corroborated by PXRD diffraction patterns. Upon intercalation, the d spacings increased from 1.24 nm for the Na-Mnt to 1.56 nm, 1.76 nm, and 1.80 nm for MB-Mnt, SAF-Mnt, and MAL-Mnt samples, respectively, and from 1.24 nm for the Na-Hec to 1.81 nm, 1.97 nm, and 1.98 nm for MB-Hec, SAF-Hec, and MAL-Hec samples, respectively. For MB-Hec only, a shoulder at 1.24 nm might indicate some Na-interlayers remaining un-exchanged (Fig. 3).
PXRD patterns of (dye-intercalated) Mnt and Hec with d 001 spacings

By comparing absorption spectra of the dye solution at low concentrations, where a purely monomeric form of dye was present, with the absorption spectra of clay-hybrids obtained by transformation of reflectance spectra with the Kubelka-Munk function (data not shown) determining the type of the dye species responsible for the resulting clay-hybrid color impression (Fig. 4) was possible. Following this procedure, MB formed in the interlayer space of MB-clay hybrids H-dimers (Bujdák Reference Bujdák2006) and monomers, while MAL and SAF were present in their monomeric forms.
a Chromaticity diagram showing x and y coordinates of MB-clay hybrids, b MAL-clay hybrids, c SAF-clay hybrids before (open symbols) and after (full symbols) acid treatment in the CIE 1931 color space. Mnt-hybrids are represented by circles and Hec-hybrids by rectangles

Acid Stability
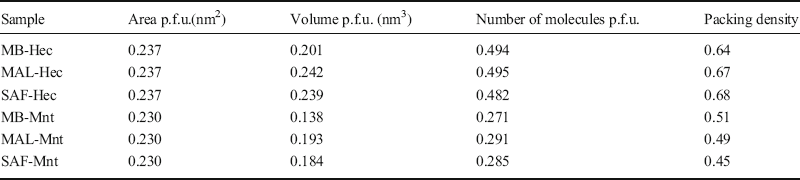
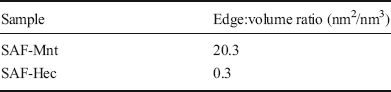
Pristine fluorohectorite was shown (Komadel and Madejová Reference Komadel, Madejová, Bergaya, Theng and Lagaly2006) to be much less stable in inorganic acids than Al-rich montmorillonite due to the faster dissolution kinetics of octahedrally coordinated Mg2+ ions than of octahedrally coordinated Al3+ ions (Christidis et al. Reference Christidis, Scott and Dunham1997; Gates et al. Reference Gates, Anderson, Raven and Churchman2002). Contrary to expectations based on this result, the opposite trend in acid stability for the dye-intercalated hybrid materials was observed. Recently, Lackovičová et al. (Reference Lackovičová, Baranyaiová and Bujdák2019) showed that not only is the dye capable of stabilizing the clay structure, but also the confinement of dye in the interlayer space helps to stabilize it chemically and to prevent reduction to its leuco-form. After intercalation of Hec and Mnt with organic dyes, Hec samples were much more resistant to acid attack than the Mnt samples (Fig. 5). Because of that, for dye-intercalated Hec no detectable amounts of dye were leached upon acid treatment, but the release of octahedral Mg2+ into the supernatant was determined as a measure for acid-attack kinetics. Because the Mg contents of the two clays differ, the relative amounts were compared. One possible reason for this unexpected acid stability of Hec-hybrids is the greater charge density. The charge density of Mnt (0.63 e/nm2) is significantly smaller than of Hec (1.04 e/nm2). Because the ab-dimensions of Mnt and Hec are comparable, fewer dye molecules being intercalated per formula unit in Mnt will result in a less dense packing of any given dye molecule in Mnt than in Hec (Table 2). The volume available to one dye molecule was estimated by multiplying the ab-dimensions of Mnt and Hec (0.230 nm2 for Mnt, 0.237 nm2 for Hec) with the height of the interlayer space (d spacing minus the thickness of the silicate layer which is 0.96 nm) divided by the number of interlayer cations per formula unit. As expected from CECs, these volumes were found to be considerably larger for Mnt samples than for Hec samples, corroborating a significantly greater packing density of dyes in the interlayer space of Hec than in Mnt samples. Multiplying the number of dye molecules per formula unit (p.f.u.; half unit cell corresponding to four tetrahedral cations) by the van der Waals volume and dividing it with available volumes allows estimation of a packing density of the interlayer space (Table 2). The packing density of Hec-hybrids was consistently >0.64 for all three dyes while for Mnt samples it remained at <0.51. This suggests that larger voids exist in the interlayer space of Mnt-hybrid materials that allow H3O+ to diffuse more easily into the interlayer space. This allowed acid attack via the interlayer space on top of the attack via the edges. The extent of the voids in Hec samples was less, and presumably more isolated; therefore, the acid attack was restricted largely to edges. Due to its larger particle size, the edge:volume ratio of Hec is small (Table 3) and is negligible compared to that of Mnt. The Hec ratio is in the range commonly found in fluorophlogopite cores.
Amount of dissolved Mg in the supernatant after 6 h of acid treatment with HCl at pH 1 and 75°C of Mnt (red bars) and Hec (black bars) hybrid samples

Packing density per formula unit

Calculated edge:volume ratio

The overcrowded situation with Hec-hybrids might result in a displacement of dye molecules residing at the edges, outside the interlayer space, similar to what was suggested by Lagaly (Reference Lagaly1982) for alkylammonium intercalates of vermiculite. The displaced parts of the dye molecules hanging over the edges will render them more hydrophobic and, thus, might even slow down acid attack via the edges.
The statements above are also supported by the scanning electron microscopy images of clay-hybrids before and after acid treatment (Fig. 6). Close examination revealed that the edges and the surfaces of Hec-hybrids remained unaffected, while after acid treatment, due to the leaching of octahedral cations, the Mnt-hybrids demonstrated the formation of bulges, probably consisting of amorphous silica. A more exact indicator of changes in the octahedral sheet was provided by the vibrations of groups of atoms including octahedral cations; the leaching process can also be confirmed, therefore, by IR spectroscopy in the mid-infrared region (Fig. 7). The characteristic Al–Al–OH, Al–Fe–OH, and Al–Mg–OH bands are located in Mnt-hybrid at 918, 883, and 836 cm–1, respectively (Bishop and Murad Reference Bishop and Murad2004). After acid treatment, the intensities of these bands decreased slightly, indicating partial release of the structural octahedral cations.
SEM images (scale bar: 1 μm) of MB-Hec sample a before and b after acid treatment, and of MB-Mnt sample c before and d after acid treatment

IR transmittance spectra of MB-Mnt sample before (black line) and after (red line) acid treatment. The positions of vibrations of Al-Al-OH at 918 cm–1, Al-Fe-OH at 883 cm–1, and Al-Mg-OH at 836 cm–1 are indicated by vertical lines

At this point, also important to know is to what extent the acidic environment affects the colorfastness. For this reason, the reflectance spectra of the samples before and after acid treatment were measured. The reflectance spectra obtained were subsequently transformed into CIE 1931 x, y coordinates, and are shown in a CIE 1931 chromaticity diagram (Fig. 4). One would expect that the dye molecules in the Mnt interlayer space were due to the presence of larger voids protonated during acid treatment, giving rise to the formation of species with different spectral characteristics which, in turn, would result in a notable color change. Reflectance measurements and the corresponding representations in the CIE 1931 chromaticity diagram showed, however, that the changes in color were insignificant, assuming little or no protonation under given conditions, and thus favoring the occurrence of acidic dissolution of octahedrally coordinated cations.
Thermal stability
As a first indication of the environmental stability of the newly developed absorption pigment cores, their thermal stability was tested. Pristine Hec is thermally stable up to 800°C (Tsurko et al. Reference Tsurko, Feicht, Nehm, Ament, Rosenfeldt, Pietsch, Roschmann, Kalo and Breu2017). The thermal stability will, therefore, be limited by the decomposition of intercalated dyes. Fortunately, the thermal stability of organic ions has long been known to be improved by intercalation into the galleries of layered materials (Laguna et al. Reference Laguna, Loera, Ibarra, Lima, Vera and Lara2007; Tang et al. Reference Tang, Xu, Lin and Li2008). This general observation is confirmed by comparing the thermal stability of pristine organic dye salts (chlorides) and Hec-hybrids, where formally the chloride is replaced by the layered silicate polyanion. In the presence of synthetic air, the thermogravimetric curves show multistep decomposition of MB-Cl, MAL-Cl, and SAF-Cl. After the loss of physisorbed water in the temperature range 50–150°C, the onset of oxidative decomposition accompanied by exothermic peaks was observed at 185°C, 307°C, and 190°C for MB-Cl, MAL-Cl, and SAF-Cl, respectively (Figs 8a–c). These onset temperatures, as defined by the intersection of tangents, would cause doubt about the integrity of MB and SAF under certain processing conditions. The onset temperatures of decomposition of all hybrid materials were shifted considerably to higher temperatures: 281, 413, and 282°C for MB-Hec, MAL-Hec, and SAF-Hec, respectively. Presumably, the confinement of organic cations in the interlayer space restricts their rotational and vibrational motions and, therefore, the thermal decomposition of organic cations results in stabilization by ~100°C.
Thermogravimetric analysis of a MB-Cl, MB-Hec, b MAL-Cl, MAL-Hec, and c SAF-Cl, SAF-Hec samples. Mass loss curves of dye-Cl (black full line) and dye-Hec (red full line), and DSC curves of dye-Cl (black dashed line) and dye-Hec (red dashed line) in a synthetic air (gas mixture consisting of 79.5 vol.% N2 and 20.5 vol.% O2, with possible impurities such as H2O, CO2, CO, CH4, NOx, SO2, or H2S) atmosphere with a heating rate of 10°C/min. Vertical full lines for dye-Cl (black) and dye-Hec (red) are used to show the onset temperatures

Conclusions
The coloring strength of clay-hybrids is affected directly by the amount of intercalated organic cations, and is due to the greater layer charge being more pronounced in Hec-hybrid samples. Surprisingly, the acid stability of Hec-hybrid samples was better than that of Mnt-hybrid samples because of larger packing density and smaller edge:volume ratios. As a consequence of organic dye confinement in the interlayer space, the rotational and vibrational motions of these organic cations are restricted, resulting in stabilization of their thermal decomposition by ~100°C. Consequently, all these properties make colored Hec hybrids promising in terms of the preparation of new, intensely colored pearlescent pigments. The next step will be the formulation of coatings with Hec-based pigment cores followed by weathering tests.
ACKNOWLEDGMENTS
Marco Schwarzmann and Sonja Lutschinger are acknowledged for TGA and AAS measurements.
Compliance with ethical standards
Conflict of Interest
The authors declare that they have no conflict of interest.