Introduction
Apart from two native and one invasive flowering plant species, the Antarctic land plant flora is composed solely of bryophytes, including more than 116 species of mosses (Bryophyta; Ochyra et al. Reference Ochyra, Lewis Smith and Bednarek- Ochyra2008, Ellis et al. Reference Ellis, Asthana, Gupta, Nath, Sahu and Bednarek-Ochyra2013a, Reference Ellis, Bednarek-Ochyra, Ochyra, Benjumea, Saïs and Capparós2013b, Sollman et al. Reference Sollman2015, Câmara et al. Reference Câmara, Soares, Henriques, Peralta, Bordin, Carvalho-Silva and Stech2019). The Antarctic bryophytes are grouped into six geographical elements: endemic, sub-Antarctic, south temperate, bipolar, cosmopolitan and tropical (Ochyra et al. Reference Ochyra, Lewis Smith and Bednarek- Ochyra2008). Bipolarity (i.e. the occurrence of species in both polar (Arctic and Antarctic) and cool-temperate regions, with or without intermediate occurrences in tropical mountain areas) is quite a common phenomenon in Antarctica, with ~45% of its flora being bipolar, including some of the most common species (Ochyra et al. Reference Ochyra, Lewis Smith and Bednarek- Ochyra2008).
Three main hypotheses have been proposed to explain bipolar distribution patterns, namely vicariance, stepping-stone migration via tropical mountains or direct long-distance dispersal (Lamb Reference Lamb and Holdgate1970, Ochyra et al. Reference Ochyra, Lewis Smith and Bednarek- Ochyra2008, Lewis et al. Reference Lewis, Biersma, Carey, Holsinger, McDaniel, Rozzi and Goffinet2017). Three main migration routes have been proposed, the so-called 1) American pathway, with dispersal via the Neotropics and Patagonia to Maritime Antarctica, 2) African pathway, via East African mountains to sub-Antarctic islands such as Kerguelen, and 3) Indomalayan-Malesian pathway via south-east Asia to south-east Australia, New Zealand and associated nearby islands (Ochyra et al. Reference Ochyra, Lewis Smith and Bednarek- Ochyra2008).
However, the possibility that Arctic and Antarctic populations of presumedly bipolar species actually belong to different species cannot be ruled out. Our current understanding of morphological variation and taxonomical knowledge may be insufficient to correctly delimit and identify supposedly bipolar species. Many polar bryophyte species are characterized by high levels of morphological variability (e.g. Longton Reference Longton1988, Buryová & Shaw Reference Buryová and Shaw2005, Hebel et al. Reference Hebel, Galleguillos, Jaña and Dacasa Rüdinger2012, Hesse et al. Reference Hesse, Jalink, Stech and Kruijer2012, Daniëls et al. Reference Daniëls, Gillespie and Poulin2013). On the other hand, bipolarity could represent an artifact due to extreme environmental conditions in both polar regions, with non-related taxa displaying similar morphologies in the Arctic and the Antarctic (Câmara et al. Reference Câmara, Valente, Amorim, Henriques, Carvalho-Silva, Convey and Stech2018b). The use of molecular data is therefore indispensable for investigating bipolarity, along with a (re)assessment of morphological variation.
A recent example of insufficiently understood bipolarity is found in the pleurocarpous moss genus Drepanocladus, with molecular data indicating that the presumedly bipolar Drepanocladus longifolius (Wilson ex Mitt.) Broth. ex Paris comprises two geographically separated species, of which only one is bipolar (Holarctic and Australia; Saługa et al. Reference Saługa, Ochyra, Żarnowiec and Ronikier2018). Other recent molecular phylogenetic analyses confirmed the monophyly of bipolar moss species in their current morphological circumscriptions (Polytrichastrum alpinum (Hedw.) G.L. Sm. and three Polytrichum species, Biersma et al. Reference Biersma, Jackson, Hyvönen, Linse, Griffiths and Convey2017; Schistidium rivulare (Brid.) Podp., Biersma et al. Reference Biersma, Jackson, Stech, Griffiths, Linse and Convey2018b), and they suggested a Holarctic origin for all of them except Polytrichum juniperinum Hedw. In the earlier studied moss genera Cinclidium (Piñeiro et al. Reference Piñeiro, Popp, Hassel and Listl2012) and Sanionia (Hedenäs Reference Hedenäs2012), the (molecular) species delimitations were less clear, but Northern Hemisphere origins of Southern Hemisphere populations of the bipolar species Cinclidium stygium Sw. and Sanionia uncinata (Hedw.) Loeske were inferred as well, as was also the case in Tetraplodon fuegianus Besch. (Lewis et al. Reference Lewis, Biersma, Carey, Holsinger, McDaniel, Rozzi and Goffinet2017).
To better understand the geographical origins and diversification of the Antarctic bryophyte flora, further taxa from all main phytogeographical elements, including bipolar species, should be studied (Câmara et al. Reference Câmara, Carvalho-Silva and Stech2021), combining molecular and morphological data in an integrative approach (e.g. Bijlsma et al. Reference Bijlsma, Kruijer and Stech2020). Pleurocarpous mosses of the order Hypnales are yet understudied in this respect. According to Ochyra et al. (Reference Ochyra, Lewis Smith and Bednarek- Ochyra2008), eight out of the 17 pleurocarpous moss species that occur in Antarctica are bipolar, but apart from the aforementioned D. longifolius and S. uncinata, only preliminary data of a third species, Roaldia revoluta (Mitt.) P.E.A.S. Câmara & Carv.-Silva, are available. R. revoluta, formerly known as Hypnum revolutum Mitt., has an arctic-boreal-montane distribution in the Northern Hemisphere. In the Southern Hemisphere, Roaldia revoluta is present in Antarctica (the South Orkney Islands, the South Shetland Islands and the Antarctic Peninsula), Patagonia and New Zealand (South Island). The distribution of R. revoluta is considered strictly bipolar (Ochyra et al. Reference Ochyra, Lewis Smith and Bednarek- Ochyra2008, Câmara et al. Reference Câmara, Carvalho-Silva, Henriques, Poveda, Gallego and Stech2018a), despite three occurrences in tropical mountain areas in Mexico (Ando Reference Ando1973), Guatemala (Câmara et al. Reference Câmara, Carvalho-Silva, Henriques, Poveda, Gallego and Stech2018a) and Uganda (Hedenäs & Watling Reference Hedenäs and Watling2005).
The taxonomy and phylogenetic position of R. revoluta as a monospecific genus in the family Pylaisiaceae were discussed by Câmara et al. (Reference Câmara, Carvalho-Silva, Henriques, Poveda, Gallego and Stech2018a) based on molecular and morphological data. Formerly distinguished intraspecific taxa in H. revolutum, in particular H. revolutum var. dolomiticum (Milde) Moenk. and fo. pumilum (Husn.) Ando (Ando & Matteri Reference Ando and Matteri1982), were considered as mere morphological variations in that study. In contrast, Schlesak et al. (Reference Schlesak, Hedenäs, Nebel and Quandt2018) considered H. revolutum var. dolomiticum sufficiently separated at the species level, for which they made the combination Roaldia dolomitica (Milde) Hedenäs, Schlesak & D. Quandt; their view was taken over by Kučera et al. (Reference Kučera, Kuznetsova, Manukjanová and Ignatov2019). Câmara et al. (Reference Câmara, Valente, Amorim, Henriques, Carvalho-Silva, Convey and Stech2018b) showed the absence of genetic variation among populations of R. revoluta in Antarctica and concluded that the observed morphological plasticity was probably caused by environmental conditions acting upon this species. Morphological and molecular variability and relationships between northern and southern populations of R. revoluta, however, still need to be investigated.
In this paper, we aim to 1) test the monophyly and bipolarity of R. revoluta based on samples from its entire distribution area, 2) re-evaluate the status of R. dolomitica, 3) re-evaluate the morphological variation in Antarctica reported in Câmara et al. (Reference Câmara, Valente, Amorim, Henriques, Carvalho-Silva, Convey and Stech2018b) in comparison with morphological variation in the Northern Hemisphere and the molecular variation worldwide and 4) compare intraspecific molecular and morphological variation with that in other bipolar species.
Material and methods
Sampling
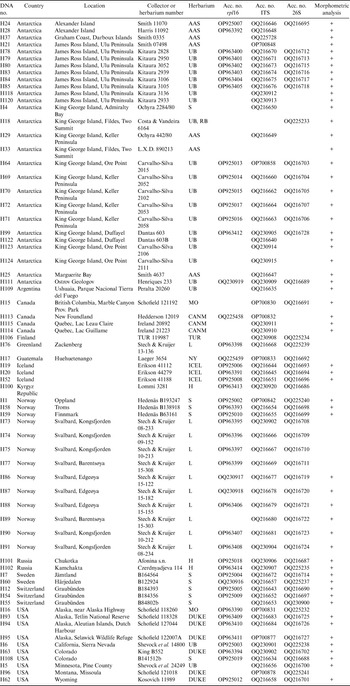
The sampling of R. revoluta specimens was based on Câmara et al. (Reference Câmara, Carvalho-Silva, Henriques, Poveda, Gallego and Stech2018a,Reference Câmara, Soares, Henriques, Peralta, Bordin, Carvalho-Silva and Stechb) but was much expanded to include representatives from the Northern Hemisphere. In the present study, we were able to include representatives from all main areas where R. revoluta is known to occur, except the South Orkney Islands, New Zealand and Uganda. For phylogenetic studies, 69 specimens were sequenced from a wide range of geographical locations. Voucher data and GenBank accession numbers are listed in Table I. In addition, ITS sequences of seven Roaldia samples, two samples each of three other species of Pylaisiaceae, namely Calliergonella curvifolia (Hedw.) B.H.Allen, Calliergonellopsis dieckii (Renauld & Cardot) Jan Kučera & Ignatov and Pseudostereodon procerrimus (Molendo) M.Fleisch., as well as of Stereodon callichrous (Brid.) Lindb. (Stereodontaceae), as outgroup representatives, were downloaded from GenBank and included in the analysis, following Câmara et al. (Reference Câmara, Carvalho-Silva, Henriques, Poveda, Gallego and Stech2018a), Schlesak et al. (Reference Schlesak, Hedenäs, Nebel and Quandt2018) and Kučera et al. (Reference Kučera, Kuznetsova, Manukjanová and Ignatov2019). A total of 95 specimens (46 from the Antarctic and 49 from the Arctic and other regions), including a selection of sequenced specimens (Table I) and further specimens not molecularly analysed, were subjected to morphometric analysis.
Voucher information and GenBank accession numbers (Acc. no.) of the sequenced Roaldia revoluta specimens.

Material was obtained from herbaria (AAS, CANM, H, DUKE, ICEL, L, MO, NY, RB, S, SP, TUR, UB; acronyms follow http://sweetgum.nybg.org/science/ih) and from fieldwork. Fieldwork in Antarctica (South Shetland Islands, James Ross Island and Antarctic Peninsula region) was carried out by PEASC, MC-S, DVV, DKH, ETdA and WSF during the summers of 2015/2016 and 2016/2017 with support of the Brazilian Antarctic Program (PROANTAR). Material in the High Arctic was collected by HK and MS during fieldwork in Greenland (2013) and Svalbard (2008, 2009, 2010 and during the Netherlands Scientific Expedition Edgeøya Spitsbergen (SEES) in 2015).
DNA extraction, polymerase chain reaction, sequencing and sequence editing
Total genomic DNA was extracted using the CTAB protocol (Doyle & Doyle Reference Doyle and Doyle1987). We amplified and sequenced the chloroplast marker rpl16 intron as well as the nuclear ribosomal markers ITS (ITS1-5.8S-ITS2) and partial 26S gene using the primers published in Hedenäs (Reference Hedenäs2012), Pisa et al. (Reference Pisa, Werner, Vanderpoorten, Magdy and Ros2013) and Cox et al. (Reference Cox, Goffinet, Shaw and Boles2004), respectively. The polymerase chain reaction (PCR) amplification mixture had a total volume of 50 μl and contained 5 μl of 5× thermophilic buffer, 5 μl of 50 mM MgCl2, 0.5 μl Taq (Promega), 2 μl of BSA (10 mg/ml), 4 μl of 1 mM dNTPs, 2.5 μl of each primer (10 μM) and 2.0 μl of DNA; the remaining volume was filled with water. The PCR profile was: 1 min at 94°C, 1 min at 56–58°C, 1 min at 72°C for 35 cycles, always preceded by an initial melting step of 2 min at 94°C, and with a final extension of 7 min at 72°C. The PCR products were purified and bidirectionally sequenced by Macrogen, Inc. (Seoul, Korea).
Sequences were assembled using Geneious v. 6.1.6 (Biomatters 2010), initially aligned using Clustal X (Higgins & Sharp Reference Higgins and Sharp1988), manually adjusted in PhyDE (Müller et al. Reference Müller, Quandt, Müller and Neinhuis2006) and exported as Nexus files. All polymorphisms were validated by visually checking of the original electropherograms.
Phylogenetic and haplotype analyses
Phylogenetic analyses of the ITS sequences, which could be obtained for all 69 specimens, were carried out using maximum parsimony (MP), maximum likelihood (ML) and Bayesian inference (BI). MP analyses were carried out using PAUP v. 4.0b10 for Macintosh (Swofford Reference Swofford2002). Heuristic searches were performed with 1000 random addition replicates and tree-bisection-reconnection branch swapping, saving a maximum of 10,000 trees. All characters were unordered and equally weighted, and gaps were either treated as missing data or coded as informative by a simple indel coding (SIC) strategy (Simmons & Ochoterena Reference Simmons and Ochoterena2000) as implemented in SeqState (Müller Reference Müller2004). ML analyses were carried out using GARLI v. 0951 for Macintosh (Zwickl Reference Zwickl2006). Clade support for MP and ML was assessed from bootstrap analyses with 1000 replicates (Felsenstein Reference Felsenstein1985). For ML and BI analyses, the best-fit model of evolution (GTR + I + Γ) was obtained based on the Akaike information criteria using jModeltest 3.06 (Posada Reference Posada2008). BI analyses were carried in MrBayes v. 3.2.5 (Ronquist et al. Reference Ronquist, Teslenko, van der Mark, Ayres, Darling and Ohna2012). Two runs with four Markov chain Monte Carlo chains were run for (Piñeiro et al. Reference Piñeiro, Popp, Hassel and Listl2012). Chains were sampled every 1000 generations and the respective trees were written to a tree file. Convergence of runs was verified by ensuring that the average standard deviation of split frequencies was < 0.01. Tracer 1.5 (Rambaut & Drummond Reference Rambaut and Drummond2013) was used to determine when the tree sampling stabilized. The first 25% of the trees were discarded as ‘burn-in’. A majority rule consensus tree and posterior probabilities (PPs) were calculated from the resulting trees.
Haplotype analyses of 44 Roaldia specimens for which all three markers could be sequenced were performed with two datasets: 1) the chloroplast marker rpl16 intron and 2) the nuclear ribosomal markers ITS (ITS1-5.8S-ITS2) and partial 26S gene concatenated. Haplotypes were inferred based on statistical parsimony using TCS v.1.21 (Clement et al. Reference Clement, Posada and Crandall2000).
Morphometric analysis
As sporophytes of R. revoluta are unknown from Antarctica, only gametophytic characters were scored. Furthermore, leaf characters were restricted to stem leaves, as plants from King George Island (Antarctica) usually produce very small branches, making it almost impossible to measure their branch leaves. Microscopic slides with several leaves taken from the median region of the gametophyte were prepared under a dissecting microscope and mounted using Hoyer's solution (Anderson Reference Anderson1954).
Nine quantitative characters of the stem leaves were selected (leaf length, leaf width, acumen length, acumen base width, acumen width, length of longer costa branch, length of shorter costa branch and length and width of five cells at mid-leaf). Each character was measured on five leaves taken from one stem per specimen using an optical microscope (Leica DM750) and a video camera (MC 170 HD) to capture the images to a computer. Leica Application Suite software (Piñeiro et al. Reference Piñeiro, Popp, Hassel and Listl2012) was used for image analysis.
A matrix was constructed with the median values obtained from the five leaves measured from each specimen for four characters (leaf length, leaf width, acumen length and acumen width) and subjected to principal component analysis (PCA) in PAST 3.15 (Hammer et al. Reference Hammer, Harper and Ryan2001). Linear discriminant analysis (LDA) was performed to ascertain the significance of the groups formed. The cell and costa characters were excluded from these analyses due to low significance in the analysis.
Results
Phylogenetic analysis
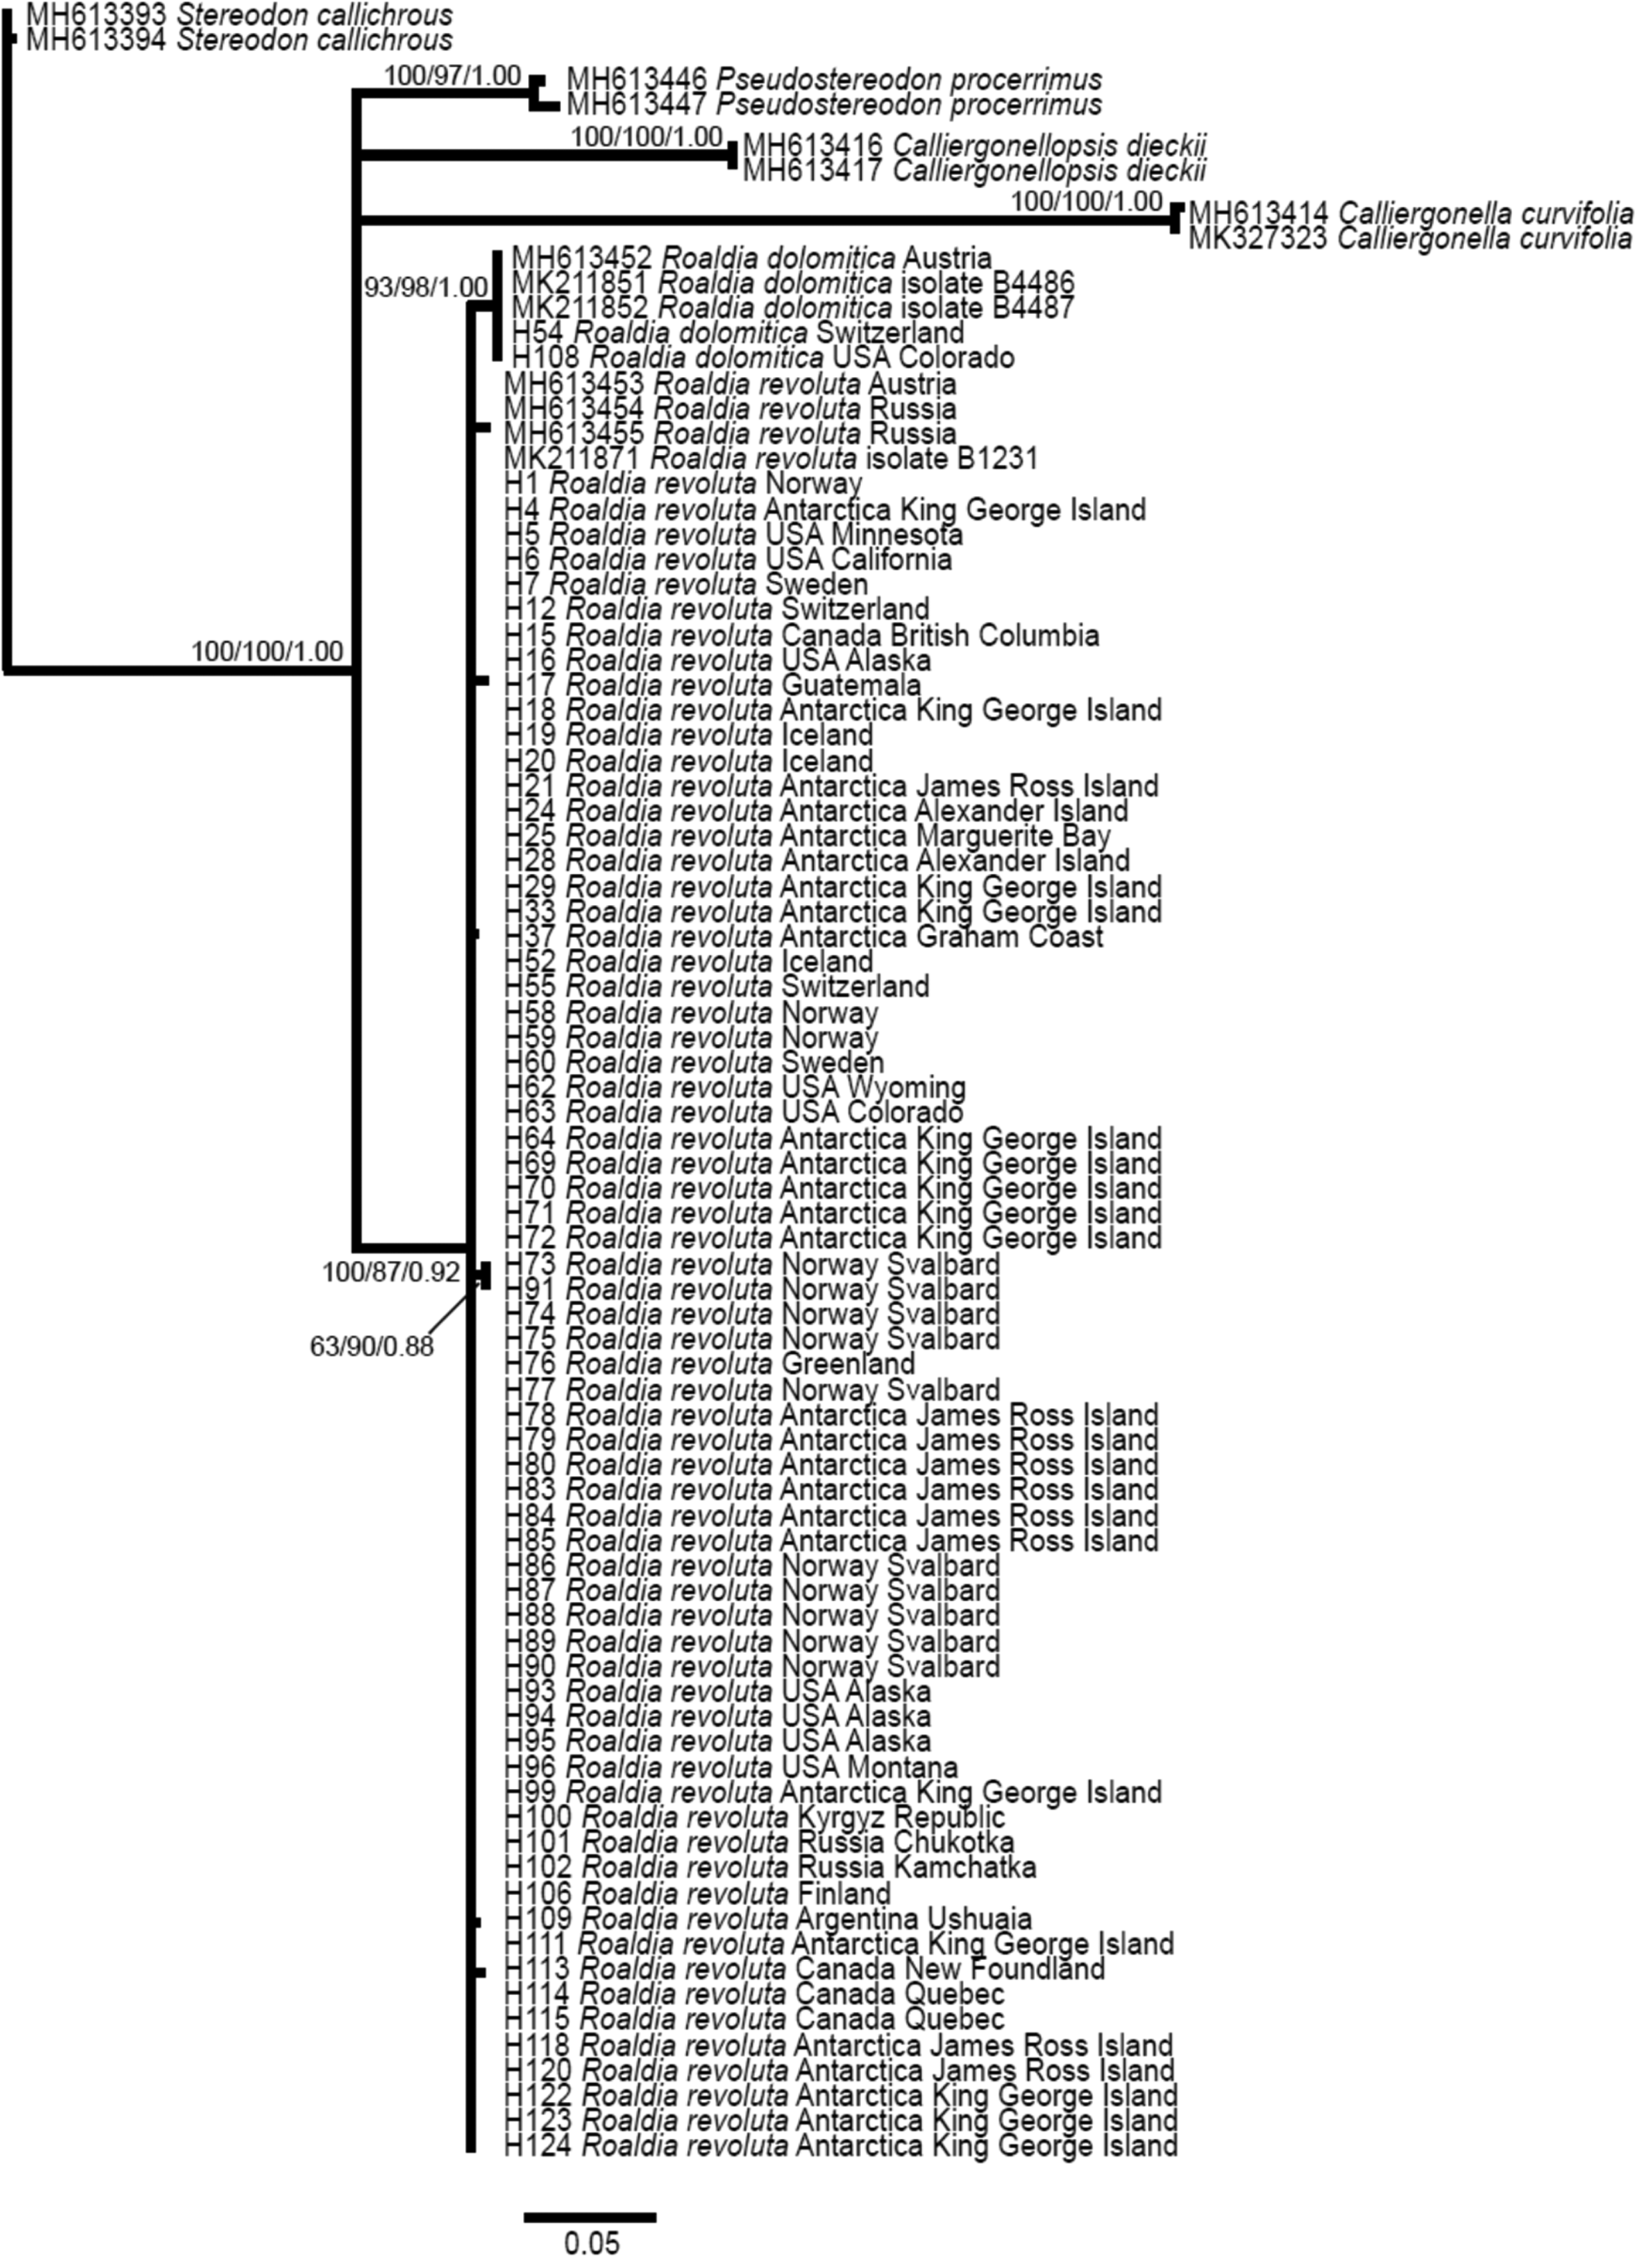
The ITS alignment for phylogenetic analysis comprised 789 positions, of which 100 were parsimony-informative. SIC yielded another 86 characters, 81 of which were parsimony-informative. The Bayesian phylogenetic reconstruction is shown in Fig. 1, with PPs and bootstrap support from the respective MP (MP-BS) and ML (ML-BS) analyses shown at the branches. All analyses revealed a monophyletic Roaldia clade with high bootstrap support (MP-BS 100%, ML-BS 87%) and a PP of 0.92. Within the Roaldia clade, one clade comprising all included specimens of R. dolomitica formed a subclade with high support (PP1, MP-BS 93%, ML-BS 98%), and two R. revoluta specimens from Svalbard formed a subclade with lower bootstrap support (MP-BS 63%, ML-BS 90%). These subclades and all other R. revoluta specimens formed a large polytomy. The clades of the species of the other included genera all received maximum support except ML-BS 97% for P. procerrimus. Relationships between these clades and the Roaldia clade remained unresolved.
Bayesian phylogenetic reconstruction from ITS sequences of Roaldia revoluta/Roaldia dolomitica and related taxa of the Hypnales, with two samples of Stereodon callichrous as outgroup representatives. Posterior probabilities (PPs) > 0.95 and bootstrap support > 60% from respective maximum parsimony (MP-BS) and maximum likelihood (ML-BS) analyses are shown at the branches in the order MP-BS/ML-BS/PP.
Haplotype analysis
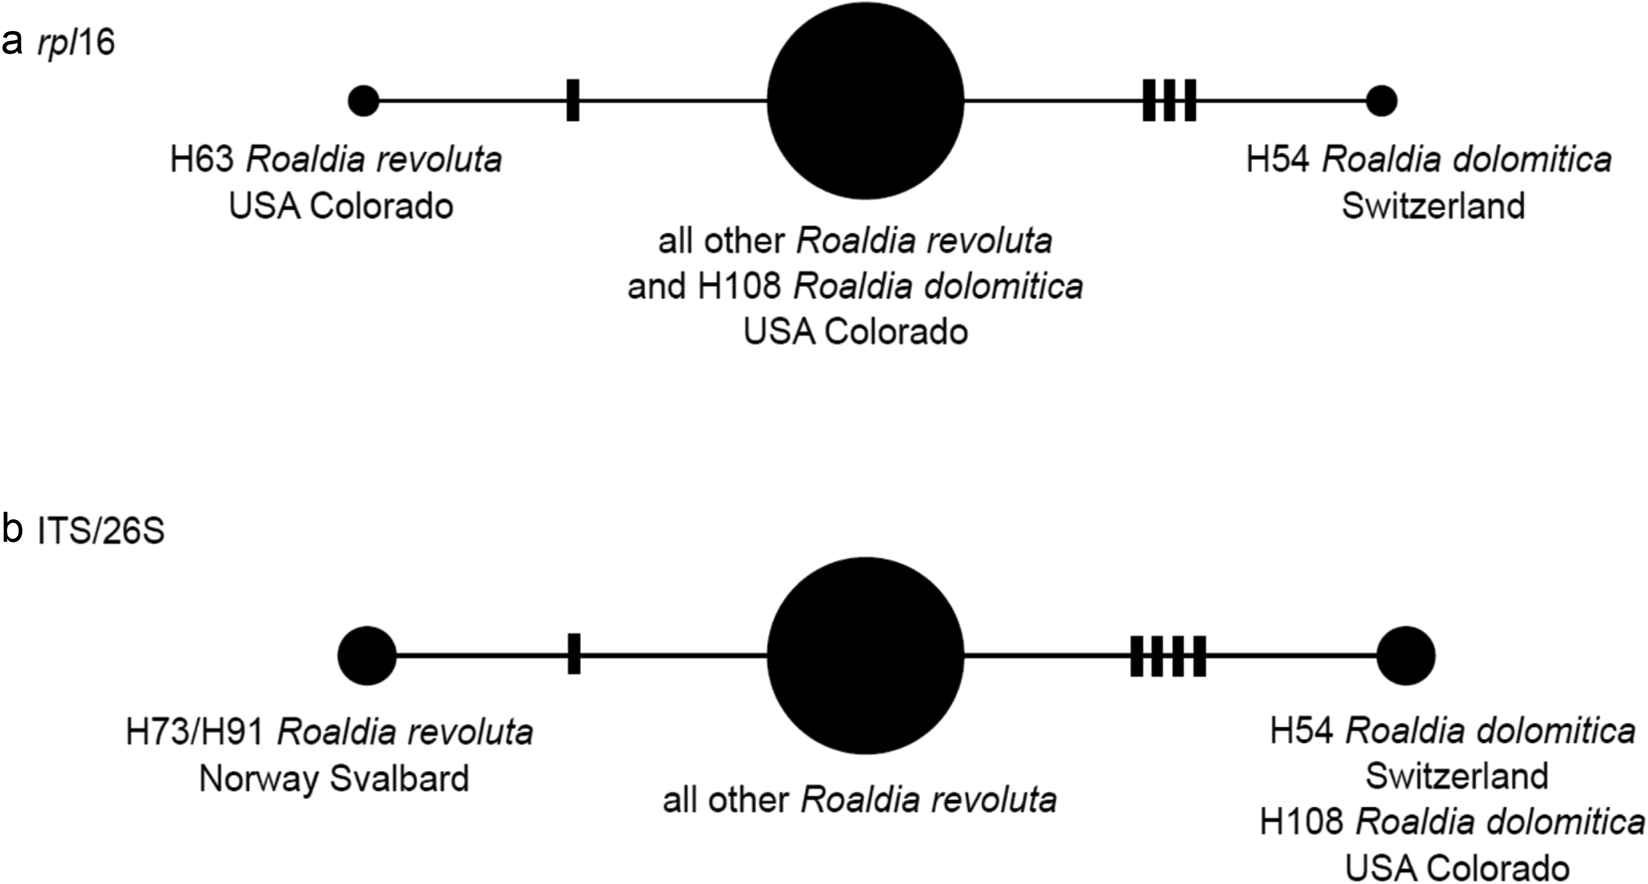
The alignments of the chloroplast rpl16 intron and nuclear ribosomal ITS/partial 26S sequences of the 44 included Roaldia specimens comprised 684 and 1633 positions, respectively, without any length variation. Three rpl16 haplotypes were observed, one in one of the two included samples of R. dolomitica (H54), the second in (Piñeiro et al. Reference Piñeiro, Popp, Hassel and Listl2012) sample H63 from the USA and the third in all remaining samples (Fig. 2a).
Haplotype networks of a. the chloroplast marker rpl16 and b. the nuclear ribosomal ITS/partial 26S of 44 specimens of Roaldia revoluta/Roaldia dolomitica.

In the nuclear region three haplotypes were observed as well, one in both included samples of R. dolomitica, the second in the two R. revoluta samples from Svalbard that were separated in the phylogenetic analysis as well and the third in all remaining samples (Fig. 2b).
Morphometric analysis
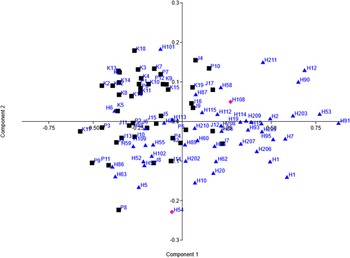
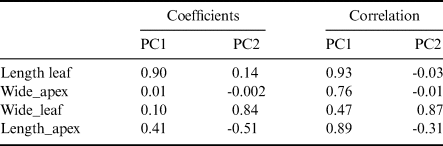
Biplots of PCA and LDA are presented in Figs 3 & 4, respectively. Table II shows the coefficient and correlation values of the variables with the components. Leaf length was most closely related to the first axis, while leaf width and length of the leaf apex were more related to the second axis. The scree plot (Fig. 5) showed that the first component was sufficient to explain the variation. The first component explained 90.8% of the variation and the second component explained 6.7% of the variation (with eigenvalues of 0.10 and 0.008, respectively). The results of the morphometric analyses show a continuous range of morphological variation, with a tendency of higher variation in the Northern Hemisphere and some differentiation, but also considerable overlap, between specimens from both hemispheres (Figs 3 & 4).
Principal component analysis of Roaldia revoluta samples from the Northern Hemisphere (blue triangles; specimens identified as Roaldia dolomitica are displayed as red diamonds) and the Southern Hemisphere (black squares).

Graphic of the linear discriminant analysis showing the intersection between the two groups of Antarctic (grey) and Arctic (green) Roaldia revoluta specimens.

Scree plot showing the line above broken stick values (red dashed line) for the first component. The percentages of eigenvalues for all components are represented by the blue line.

The coefficient and correlation values of the variables with the first and second axes of the principal component analysis.

PC = principal component.
Discussion
Our phylogenetic analyses based on ITS sequences clearly resolve Roaldia as monophyletic, confirming the preliminary results of previous studies (Câmara et al. Reference Câmara, Valente, Amorim, Henriques, Carvalho-Silva, Convey and Stech2018b, Schlesak et al. Reference Schlesak, Hedenäs, Nebel and Quandt2018, Kučera et al. Reference Kučera, Kuznetsova, Manukjanová and Ignatov2019). The lower support for the Roaldia clade in our ML and BI analyses compared to the phylogenetic trees in Schlesak et al. (Reference Schlesak, Hedenäs, Nebel and Quandt2018) and Kučera et al. (Reference Kučera, Kuznetsova, Manukjanová and Ignatov2019) probably results from the single-marker (ITS) vs multiple-marker approaches. Furthermore, our extended taxon sampling supports R. revoluta as a truly bipolar species, as specimens from both hemispheres and both polar regions comprise the same clade. Intraspecific molecular variation is low, and most specimens from both polar regions belong to a single haplotype in each investigated marker.
The only well-distinguished subgroup within the ITS-based phylogeny corresponds to H. revolutum var. dolomiticum. In the plastid marker rpl16, in contrast, only one of the two newly analysed specimens (H54) forms a separate haplotype. This specimen also appears more distinct in the PCA, whereas specimen H108 is indistinguishable from other Northern Hemisphere specimens both morphologically and by its rpl16 sequence. More extensive analyses of molecular data and possibly sporophytic characters may give more insight into the relationship between R. dolomitica and R. revoluta, but based on the available data we propose to continue distinguishing the former as a variety of R. revoluta, for which we provide a new combination.
The low intraspecific genetic diversity of R. revoluta corroborates the findings of Câmara et al. (Reference Câmara, Valente, Amorim, Henriques, Carvalho-Silva, Convey and Stech2018b) for R. revoluta and Biersma et al. (Reference Biersma, Jackson, Bracegirdle, Griffiths, Linse and Convey2018a) for the acrocarpous moss Chorisodontium aciphyllum (Hook. f. & Wilson) Broth. (Dicranaceae). According to these studies there is very low genetic variability - even in markers that are often variable at the species and population levels (particularly ITS; Stech & Quandt Reference Stech and Quandt2010) - between populations of mosses from Antarctica and South America or, as shown here, across the whole bipolar distribution area. In the case of Roaldia and Chorisodontium, this may reflect taxon-related patterns: the pleurocarpous order Hypnales is considered to have evolved by rapid diversification that resulted in generally low genetic variation, short branches and consequently low support in phylogenetic trees (Shaw et al. Reference Shaw, Cox, Goffinet, Buck and Boles2003), while several closely related genera of Dicranaceae have also been shown to exhibit low molecular variation, complicating species delimitation and phylogeographic analysis (Lang et al. Reference Lang, Kruijer and Stech2014, Reference Lang, Bocksberger and Stech2015). In other pleurocarpous species, low variation was observed as well, such as within the bipolar Drepanocladus capillifolius (Warnst.) Warnst. and the South American-Antarctic D. longifolius (Saługa et al. Reference Saługa, Ochyra, Żarnowiec and Ronikier2018), among Antarctic populations of S. uncinata (Hebel et al. Reference Hebel, Dacasa Rüdinger, Jaña and Bastias2018) and in Arctic/Scandinavian populations of Buckia voucheri and Campylium bambergeri (Hedenäs Reference Hedenäs2014a). In bipolar Polytrichum species (Polytrichaceae), however, ITS exhibited higher variation, in particular compared to the plastid marker trnL-F (Biersma et al. Reference Biersma, Jackson, Hyvönen, Linse, Griffiths and Convey2017).
Buckia voucheri, C. bambergeri and R. revoluta are all segregates of the formerly broadly treated genus Hypnum that rarely produce sporophytes. Ando (Reference Ando1972) assumed that the contemporary populations of such Hypnum s.l. species are relicts of a once more continuous distribution that lost the ability of sexual reproduction. Relict populations could then have undergone a gradual loss of haplotypes, as was inferred for populations from Scandinavian lowland glacial refugia in Rhytidium rugosum, a pleurocarpous moss species that does show significant intraspecific genetic variation (Hedenäs Reference Hedenäs2014b). It might thus be that only the current main Northern Hemisphere haplotype of R. revoluta survived in Antarctica. Another possible explanation could be one or multiple long-distance dispersal events of the same haplotype. As sexual reproduction in Roaldia is unknown in Antarctica but does occur rarely in the Northern Hemisphere (seemingly more frequently in North America than in Europe; Ando Reference Ando1973), under this scenario it is most probable that spores were transported from the Northern Hemisphere into Antarctica by means of birds or wind (cf. Lewis et al. Reference Lewis, Rozzi and Goffinet2014). However, as Hedenäs (Reference Hedenäs2014a) already concluded for B. voucheri and C. bambergeri, possible migration patterns cannot be inferred when haplotype variation is too low. In cases of such low molecular variation, sequencing approaches such as RAD sequencing (Lewis et al. Reference Lewis, Biersma, Carey, Holsinger, McDaniel, Rozzi and Goffinet2017) or hybrid capture sequencing should be applied, which may provide more genetic information than adding further single markers. Such an approach may also help us to infer the distribution history and possible dispersal routes between both polar regions of R. revoluta.
The morphometrics presented by Câmara et al. (Reference Câmara, Valente, Amorim, Henriques, Carvalho-Silva, Convey and Stech2018b) suggested the existence of two different morphotypes in Antarctica, one being more frequent in King George Island, the other more common in James Ross Island and both present in the Antarctic Peninsula. This differentiation (samples K, J and P in Fig. 3) is here extended by a broader range of morphological variation in the Northern Hemisphere, which may not be surprising considering that samples originate from a much larger area and from habitats with various environmental conditions. On the other hand, the present results suggest that there are no significant morphological differences among populations from both polar regions. Furthermore, ‘extreme’ morphotypes seem to occur at both poles (e.g. sample P8 vs H91; Fig. 3), but the large intersection of points in the middle of the graph suggests that such morphotypes are not common. Altogether, the extended sampling seems to corroborate the conclusion of Câmara et al. (Reference Câmara, Valente, Amorim, Henriques, Carvalho-Silva, Convey and Stech2018b) that intraspecific morphological variation is mainly influenced by environmental regulators at small spatial scales (microhabitats), as is also inferred in other studies (McDaniel & Shaw Reference McDaniel and Shaw2003, Pereira et al. Reference Pereira, Dambros and Zartman2013, Medina et al. Reference Medina, Albertos, Lara, Mazimpaka, Garilleti, Draper and Hortal2014, Amorim et al. Reference Amorim, Carvalho, Santos and Luizi-Ponzo2017).
Taxonomic and nomenclatural implications
Roaldia revoluta (Mitt.) P.E.A.S. Câmara & Carv.-Silva var. dolomitica (Milde) P.E.A.S. Câmara, Carv.-Silva & M. Stech, comb. nov. - Basionym: Hypnum dolomiticum Milde, Botanische Zeitung (Berlin), 22 (Beilage zu No. 17–19): 21. 1864.
Acknowledgements
We thank all of the curators of the mentioned herbaria. Antarctic logistical support was provided by the Brazilian Navy and Air Force; the Secretaria Interministerial para Recursos do Mar (SECIRM) is also gratefully acknowledged. We also thank the reviewers for providing good inputs and suggestions that helped improve our paper.
Author contributions
PEASC, MC-S, DVV, DKH, ETdA and WSF performed the fieldwork in Antarctica. PEASC and MC-S conducted the laboratory work. MC-S, WSF and MS performed the bioinformatic analysis. WSF and MS worked on the haplotype study. DVV, DKH and ETdA performed the statistical analysis. HK and MS conducted the fieldwork in the Arctic. All authors contributed to the previous and final versions of the manuscript.
Financial support
We thank the Brazilian Antarctic Program (PROANTAR), CNPq and MCTI for providing funds and scholarships. For Arctic research (contributing specimens to the Brazil-funded bipolar bryophyte project), HK and MS received funding from the Dutch Research Council NWO (grant ALW-NAP/08-01 and the Netherlands Scientific Expedition Edgeøya Spitsbergen (SEES) 2015), as well as European Union programs FP7/2007-2013, under grant agreement no. 262693 (INTERACT), and ARCFAC V (grants ARCFAC-026129-2008-31, ARCFAC-026129-2009-123), which is gratefully acknowledged.
Conflicts of interest
The authors declare none.