Patent laws are created to fulfill two functions: to strengthen the incentives for innovation and to encourage the diffusion of new ideas.Footnote 1 Previous studies have focused on incentives and paid little attention to the diffusion effects of patenting. Diffusion effects may, however, be equally important if they facilitate knowledge spillovers and cumulative innovation.Footnote 2
In the absence of intellectual property rights, inventors have fiercely guarded new ideas from spreading to outsiders. Silk weavers in seventeenth-century Bologna hanged Ugolino Menzani for sharing the knowledge of a new silk twisting machine with Venetian weavers.Footnote 3 Mechanics in New England's nineteenth-century cotton industry relied on family relations to exchange technical knowledge.Footnote 4 Today, farmers in developing countries share information about new crops and improvements in agricultural technologies primarily within local social networks.Footnote 5 To the extent that knowledge flows through local social networks, knowledge spillovers, and the boost that they provide to cumulative innovation, may be localized as well. Systematic analyses of patent citations confirm this for twentieth-century data.Footnote 6
This article examines whether patenting helps to weaken the localization of innovations. As a first order effect, patents require the disclosure of new ideas in exchange for the grant of temporary monopoly rights. However, by creating property rights in ideas, patents may also encourage inventors to advertise new ideas outside of their local social networks. In their case study of the U.S. glass industry, Naomi Lamoreaux and Kenneth Sokoloff argue that a lively trade in patented inventions in the late nineteenth century encouraged the geographic concentration of inventions in New England.Footnote 7 The emergence of journals in the mid-nineteenth-century, such as the Scientific American, the American Artisan, the American Inventor, and the Patent Right Gazette, which advertised patented inventions, facilitated such trades on a national scale. If patent rights, supported by specialized patent agents and journals, enabled trades in patented inventions across distant locations, they may have encouraged the geographic diffusion, rather than concentration, of innovations.
Anecdotal evidence from inventors' biographies suggests that inventors who held patent rights were more likely to publicize knowledge of their inventions beyond their local networks. In England, the Norwich iron founder Robert Ransome advertised his ploughshares to all ironmongers in Norwich and fifty outlets in East Anglia after he obtained a patent grant.Footnote 8 In the nineteenth-century United States, a patent on the lathe encouraged Massachusetts inventor Thomas Blanchard to advertise it widely, so that knowledge of the lathe diffused to Missouri and Arkansas.Footnote 9 Similarly, knowledge of the Fourdrinier papermaking machine began to diffuse quickly only after it had been patented.Footnote 10 In contrast, tight secrecy slowed the diffusion of innovations in the coke-smelting process.Footnote 11
This article takes advantage of an exogenous shift towards patenting to examine the effects of intellectual property rights on the geographic diffusion of innovations. Until the mid-nineteenth century, chemical innovations were difficult to reverse-engineer and rarely patented because inventors could rely on secrecy. As a result, less than 5 percent of British exhibits of chemicals at the Crystal Palace Exhibition in 1851 were patented, and not a single U.S. exhibit of chemicals was patented in 1851. After 1851 a series of scientific breakthroughs, including the publication of the periodic table in 1869, weakened the effectiveness of secrecy. As a result of this change, which was exogenous to the localization of innovations, the share of chemical exhibits that were patented increased to nearly 20 percent in 1893 and 1915.
A geographic analysis of exhibition data suggests that this shift towards patenting was followed by a weakening of localization. This decline in geographic concentration cannot be explained by changes in the location of production. Data from decennial census records for 1840 to 1920 indicate that the localization of chemical production remained relatively stable after 1876.
Difference-in-differences comparisons of changes in the localization of exhibits of chemicals and manufacturing machinery after 1876 confirm these results. Measuring localization by a geographic Herfindahl-Hirschmann index (HHI), and using 1876 as a baseline for both industries, geographic concentrations decreased by more than 70 percent for chemicals after 1876, compared with roughly 25 percent for manufacturing machinery. Difference-in-differences regressions that estimate the effect of a 1 percent increase in the share of patented innovations on geographic concentration imply that a 1 percent increase in patenting rates was associated with a 1.3 percent decrease in localization.
THE DATA
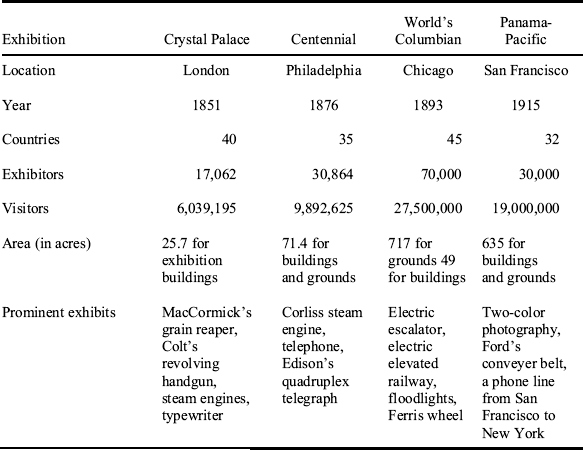
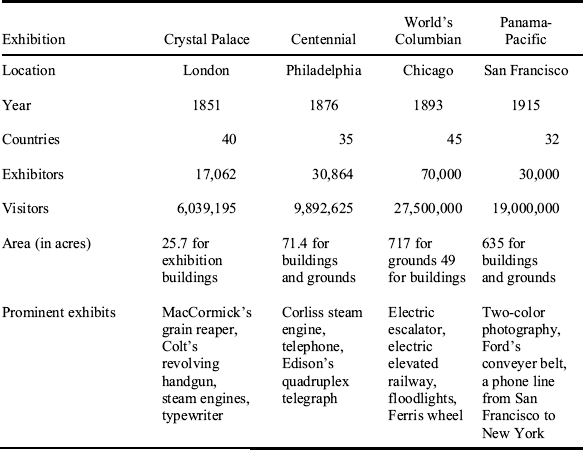
Exhibition data are drawn from the records of four world's fairs: the Crystal Palace Exhibition in London in 1851, the American Centennial Exhibition in Philadelphia in 1876, the World's Columbian Exhibition in Chicago in 1893, and the Panama-Pacific International Exposition in San Francisco in 1915 (Table 1). Exhibits ranged from early sewing machines in 1851 (U.S. exhibit 551 in 1851, exhibited by S. C. Blodgett) and power-loom lathes for the machine shops at Lowell (U.S. exhibit 447 in 1851) to Ford's conveyer belt in 1915. In 1851 Cyrus McCormick displayed his “Virginia grain reaper” (U.S. exhibit 73) and Samuel Colt showed his “revolving cylinder handgun” (U.S. exhibit 321). In 1876 exhibits included the steam engine, the telephone, and Edison's quadruplex telegraph. In 1893 exhibits showcased applications of electricity, including an electric elevator and an elevated electric railway. In 1915 the San Francisco exhibition introduced two-color photography and the first phone line to New York.
STATISTICS ON THE WORLD'S FAIRS OF 1851, 1876, 1893, AND 1915
Notes:
Data from Royal Commission, Official Catalogue; Bericht; Kretschmer, Geschichte der Weltaustellungen; Department of Publicity and Promotion, World's Columbian Exposition Chicago; and the Division of Exhibits, Panama-Pacific International Exposition San Francisco.
Catalogues that guided visitors through the fairs list the name of each exhibitor, his location, and a brief description of the innovation. For example, the competing grain reapers of Oded Hussey and Cyrus MacCormick were recorded as:
65 Hussey, O. Baltimore, Maryland. – Reaping and mowing machine. and
73 McCormick, C.H. Chicago, Illinois. – Virginia grain reaper.
To be included in a fair, inventors submitted a written application to their local commission, which specified “what is novel and important about the product, how its production shows special skillfulness and proves an original approach.”Footnote 12 A comprehensive system of evaluation and prizes helped to enforce these criteria.Footnote 13 Thus, William Felkin, mayor of Nottingham and a member of the city's local selection committee, warned applicants that, “Articles notable only for their singularity will not be admitted.”Footnote 14
Patented innovations are identified by matching exhibits with patents in the Annual Reports of the United States Patent Office.Footnote 15 For example,
“United States Patent No. 4387; Otis, Benjamin H.; Dedham, Mass.; Mortising Machine; granted Feb. 20, 1846” from the Annual Report for 1846 and
“United States Exhibit 23; Otis, B.H.; Cincinnati, Ohio; Boring and Mortising Machine” from the Royal Commission, Official Catalogue
constitute a match.
Most exhibits were not patented. In 1851, 15 percent of U.S. exhibits were protected by patents.Footnote 16 Exhibits that won a prize for being exceptionally innovative were only slightly more likely to be patented.Footnote 17
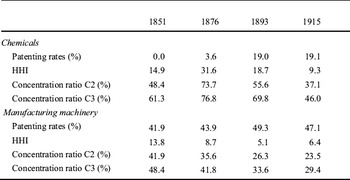
By far, the most significant variation in patenting was linked to variation in the effectiveness of secrecy. In industries where innovations were easy to reverse-engineer, such as manufacturing machinery, nearly half of all exhibits were patented; 42 percent of U.S. exhibits of manufacturing machinery were patented in 1851, 44 percent in 1876, 49 percent in 1876, and 47 percent in 1915. In comparison, less than 5 percent of U.S. exhibits of chemicals were patented in 1851 and 1876. After scientific breakthroughs lowered the effectiveness of secrecy, patenting rates increased to nearly 20 percent in 1893 and 1915 (Table 3).
Changes in Geographic Localization
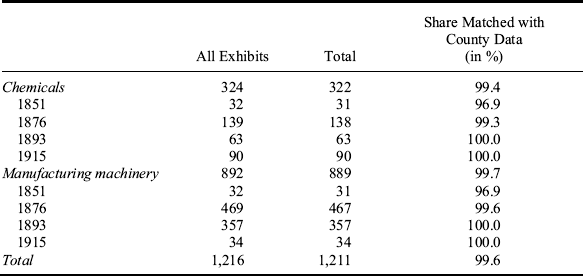
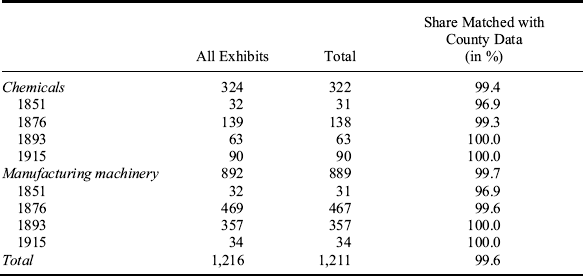
To measure changes in geographic localization, exhibits are matched with data from the National Association of Counties. Counties of origins can be identified for 99.6 percent of exhibits between 1851 and 1915 (Table 2). Concentration ratios C2 and C3, measure the share of exhibits that originate from the two and three counties with the largest number of exhibits. Herfindahl-Hirschman indices (HHI) measure localization as the square of each county's share of the total number of exhibits, summing across counties, and multiplying by 100. A value of 100 indicates complete concentration.

where Xij represents the number of exhibits from industry i and county j.
Bias in the World Fair's Data
Anecdotal evidence suggests that exhibition data are more likely to capture the high-value end of the distribution of innovations because inventors used the fairs as a way to advertise their best ideas.Footnote 18 The German firm Bayer, for example, won silver, bronze, and gold medals for the dye intermediaries that it exhibited.Footnote 19 “To win these prizes, Bayer had to remain innovative; firms displayed their dyes only when they had a reasonable chance of receiving favorable press at the exhibition.”Footnote 20
Exhibitors may also have been reluctant to display innovations that were protected by secrecy, because displaying them would have increased the risk of imitation. As a result, the data miss many innovations that were protected by secrecy and overstate the share of innovations that were protected by patents.Footnote 21
SHARE OF U.S. EXHIBITS WITH GEOGRAPHIC DATA
Notes:
Locations are identified using nineteenth-century maps and gazetteers, such as Bartholomew, Gazetteer of the British Isles, and the Getty Thesaurus of Geographic Names (http://www.getty.edu/research/tools/vocabularies/tgn/index.html).
PATENTING AND LOCALIZATION, U.S. EXHIBITS, 1851 TO 1915

Notes:
Data from Royal Commission, Official Catalogue London; United States Centennial Commission, Official Catalogue; Department of Publicity and Promotion, World's Columbian Exposition Chicago; and the Division of Exhibits, Panama-Pacific International Exposition. U.S. exhibits are assigned to counties in the records of the National Association of Counties (www.naco.org). Patenting rates measure the share of exhibits with patents. The Herfindahl-Hirschman index (HHI) is calculated by squaring each county's share of the total number of innovations in an industry, summing across counties, and multiplying by 100. The concentration ratio C3 measures the combined share of the three counties with the largest share of exhibits in an industry.
The data may also overestimate the share of innovations that originated from a host city, especially if exhibits were large or difficult to transport. This bias may be mitigated; however, by the fact that exhibitors were only required to pay for transportation cost to the nearest collection point.Footnote 22 To test for such host city bias, I compare the locations of British exhibits at the London fair of 1851 and the Philadelphia fair of 1876 (4,677 and 835 exhibits, respectively). If transportation costs bias the data towards the host city, London's share of exhibits should be smaller in 1876 when the costs of transporting exhibits to London were negligible relative to the total transportation costs. London's share was, however, nearly identical in 1851 (40.7 percent) and 1876 (39.1 percent). Nevertheless, to be conservative the analysis is carried out with and without the host city data.
AN EXOGENOUS INCREASE IN PATENTING
An exogenous increase in patenting rates creates a unique opportunity to evaluate the effects of patenting on the localization of innovations. Until the 1850s, “processes (of making chemicals and dyes) were simple and crude; exact knowledge was circumscribed and operations proceeded empirically.”Footnote 23 As a result, chemical innovations such as textile dyes were nearly impossible to reverse-engineer and therefore rarely patented. After 1851 advances in analytic tools, which were exogenous to the localization of innovations, increased inventors' tendency to patent chemicals.Footnote 24 In 1869 the Russian scientist Dmitri Mendeleev recognized that properties such as valence recur periodically if elements are organized by their atomic weights. He used this insight to publish the periodic table, which facilitated systematic chemical analyses.Footnote 25 In 1865 the German chemist August Kekulé had described the chemical structure of the benzene ring (as a six-member ring of carbon atoms with alternating single and double bonds).Footnote 26 By the 1880s Kekulé's model became widely used; it greatly influenced the theory of organic chemistry, and coal tars in particular.Footnote 27
As a result of such advances in scientific methods, chemical innovations that had been protected by secrecy became vulnerable to imitation. Innovations in dyes were particularly affected by the “dramatically increased ability of chemists to determine the composition of dyes,” which “made it more difficult for individual firms to keep dye recipes secret and prevent competitors from imitating them quickly.”Footnote 28 Methods to produce madder red, for example, had been kept secret for thousands of years.Footnote 29 In 1869, however, the German chemists Carl Graebe and Carl Lieberman announced:
“We have produced from anthracine artificial alizarine. The properties of the product obtained by us as well as the colors which we have produced with the same on mordanted cotton exhibit perfectly the identity of the artificial alizarine with that obtained from madder root.”Footnote 30
By 1876 Charles Strobel and Heinrich Caro had synthesized alizarine orange and in 1878 Rudolf Nietzki was able to match the scarlet shades of madder red.Footnote 31
As secrecy became less effective, larger shares of chemicals were patented. At the Crystal Palace Fair in 1851, none of the 32 chemical exhibits from the United States had been patented. At the American Centennial Exhibition in 1876, 3.6 percent of U.S. chemical exhibits were patented. The most significant increase in patenting rates, however, occurred after 1876. In 1893, 19 percent of U.S. chemical exhibits were patented; in 1915, 19.1 percent were patented. At the same time, patenting rates for manufacturing machinery, which had always been relatively easy to reverse-engineer, remained stable around 45 percent (42 percent in 1851, 44 in 1876, 49 in 1893, and 47 in 1915, Table 3).Footnote 32
CHEMICAL INNOVATIONS BECAME LESS LOCALIZED AFTER 1876
This shift towards patenting was followed by a weakening of geographic localization. In the third quarter of the nineteenth century, chemical innovation and production had become more localized, as young chemists moved to Philadelphia as a “center of chemistry” to acquire formal training. Benjamin Silliman, for example, went there to attend lectures by Rush, Morton, and Wistor and work in the laboratory of Robert Hare.Footnote 33 In the 1850s and 1860s “the best opportunity for real laboratory work a young chemist could find was in the analytical laboratories of consulting chemists in Philadelphia and New York.”Footnote 34 Reflecting this concentration of research activity, the HHI of geographic concentration increased from 15 in 1851 to 32 in 1876. Concentration ratios C2 and C3 similarly increase from 48 and 61 percent in 1851 to 74 and 77 percent in 1876.
After 1876 chemical exhibits became less localized. By the time of the Chicago fair in 1893, the HHI had declined to 19. By the San Francisco exhibition in 1915, it had declined even further, to a level of 9. Concentration ratios C2 and C3 confirm the decline in concentration, with a reduction to 56 and 70 percent in 1893, and a further decline to 36 and 44 percent in 1915.
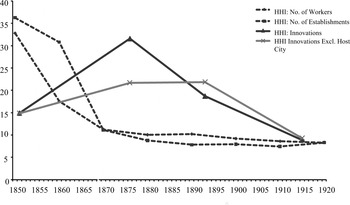
A caveat to these results is that Philadelphia's large share of chemical exhibits in 1876 may be due to host city bias, in addition to the city's role as a center of innovation. Thus the increase in localization after 1851 is weaker when data for host cities are dropped (with an HHI of 15 in 1851 and 22 in 1876, Figure 1). Philadelphia was, however, also the county with the largest number of chemical exhibits at the London fair in 1851, and it was the county with the third largest number of chemical exhibits at the Chicago fair in 1893, confirming its importance as a center of chemical innovation.Footnote 35 Moreover, the main result of a decline in localization after 1893 remains substantially unchanged (with an HHI of 22 in 1893 and 9 in 1915).
The Localization of Production Remained More Stable
To control for unobservable factors that may have contributed to the decline in geographic concentration, alternative tests compare changes in the localization of exhibits with changes in the localization of production. Innovations may be more likely to occur in centers of production where opportunities for learning-by-doing and production bottlenecks stimulate innovation.Footnote 36 Then, a potential decline in the importance of geographic factors that encourage the concentration of production, including access to waterways, natural resources, or skilled labor, may have caused the observed decline in the localization of exhibits, independent of patenting. Census data, however, indicate that the localization of chemical production remained relatively stable after 1870, with HHIs around 10 for chemical workers and firms between 1870 and 1920 (Figure 1).Footnote 37
CHANGES IN THE LOCALIZATION OF U.S. CHEMICAL INNOVATIONS AND CHEMICAL PRODUCTION, 1850 TO 1920

Changes in the Localization of Manufacturing Machinery as a Control
A difference-in-differences test compares changes in the localization of chemical exhibits with manufacturing machinery as a control. Innovations in both industries were affected by declining costs of transportation and communication, which helped to diffuse the concentration of inventive activity more generally, but only chemicals experienced a shift towards patenting.
This comparison confirms that chemical exhibits became substantially less localized after patenting increased. While the HHI for chemicals decreased from 32 in 1876 to 19 in 1893 and 9 in 1915, the HHI for manufacturing machinery remained close to its original level of 9 in 1876 at 5 in 1893 and 6 in 1915 (Table 3). Using 1876 as a baseline for both industries, this translates into a 71 percent decrease in the HHI for chemicals, compared with a 26 percent decrease for manufacturing machinery. Comparisons of concentration ratios yield similar results (Table 3). Difference-in-differences regressions estimate:

where the dependent variable y equals 1 if an exhibit originates from one of the two (C2) or three (C3) counties with the largest number of exhibits in a given year and industry.Footnote 38Chemicals distinguishes innovations in chemicals from innovations in manufacturing machinery, post-1876 distinguishes innovations in 1893 and 1915. Alternative specifications separate the post-1876 period into 1893 and 1915 to measure the timing of effects.
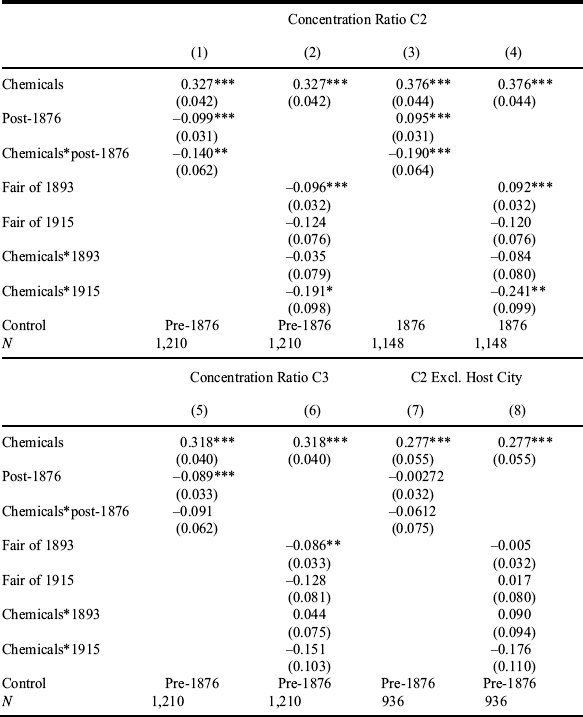
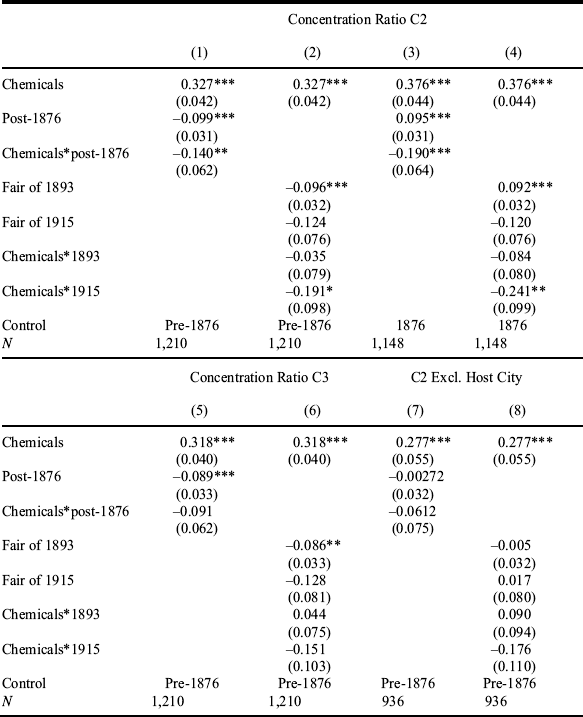
Results of such regressions confirm that chemicals became less localized after 1876. A parameter estimate of −0.140 for chemicals*post-1876 (significant at 5 percent, Table 4, column 1) implies that the probability that an exhibit originated in one of the two counties with the largest number of exhibits decreased by 14 percent more for chemicals than for manufacturing machinery after patenting increased. Similarly, an estimate of −0.191 for chemicals*1915 (significant at 10 percent, Table 4, column 2) suggests that the probability that an exhibit originated from the top two counties decreased by 19 percent more for chemicals than for manufacturing machinery in 1915 compared with 1851 and 1876. Estimates for chemicals*1893 are not significant, suggesting that the effect became stronger over time. Parameter estimates increase in regressions that use 1876 as a control (Table 4, columns 3–4). Coefficients remain negative when concentration is measured as C3, but estimates are smaller and not significant. The estimate for chemicals*post-1876 is −0.091 (Table 4, column 5), and the estimate for chemicals*1915 is −0.159 (columns 6).
DIFFERENCE-IN-DIFFERENCES ESTIMATES OF CHANGES IN LOCALIZATION AFTER 1876: C2 AND C3
* p < 0.10.
** p < 0.05.
*** p < 0.01.
Notes:
Robust standard errors are in parentheses. Estimates compare changes after 1876 in the localization of innovations, measured at the county level, in chemicals and manufacturing machinery. The dependent variable equals 1 if an exhibit originates from one of the two (C2) or three (C3) counties with the largest number of exhibits in a given year and industry. The indicator variable post-1876 distinguishes exhibits in 1893 and 1915 from exhibits in 1851 and 1876. The treatment effect of higher patenting rates is estimated by the interaction between Chemicals and post-1876. Indicator variables for 1893 and 1915 distinguish exhibits in 1893 and 1915 respectively from exhibits in 1851 and 1876. Localization is measured at the county level using the records of the National Association of Counties.
In regressions that drop exhibits from host cities, coefficients are no longer significant but they remain negative. The estimate for chemicals*post-1876 is −0.061 (Table 4, columns 7, not significant), and the estimate for chemicals*post-1893 is −0.176 (Table 4, column 8, not significant).
This loss of statistical significance may be explained by host city bias. But it may also be due to the fact that dropping chemical exhibits from Philadelphia leads to an underestimate of geographic concentration in 1876. Both the history of U.S. chemical innovations and Philadelphia's prominent representation at the London and Chicago fairs suggest that Philadelphia was an important center of chemical innovation, so that omitting it creates an underestimate of localization in 1876, and therefore the decline in localization after 1876. Dropping exhibits from host cities also leads to a significant loss of data. In 1876 a total of 191 exhibits (32 percent) originate from Philadelphia, including 71 exhibits of chemicals and 120 exhibits of manufacturing machinery; in 1893 a total of 66 exhibits (16 percent) originate from Chicago, including 16 exhibits of chemicals and 50 exhibits of manufacturing machinery; in 1915 a total of 17 exhibits (14 percent) originate from San Francisco, including 15 exhibits of chemicals and 2 exhibits of manufacturing machinery.
Effects of a One Percent Increase in Patenting Rates
An alternative test directly measures the effects of a 1 percent increase in patenting rates on geographic concentration. It implements a two-stage least square regression:
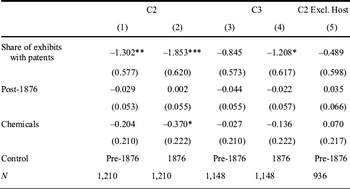
The coefficient β1 measures the difference-in-differences estimator in Table 4 rescaled by the difference in differences in patenting rates for chemicals and manufacturing machinery before and after 1876, where the dependent variable y equals 1 if an exhibit originates from one of the two (C2) or three (C3) counties with the largest number of exhibits in a given year and industry, and the share of exhibits with patents is instrumented by chemicals*post-1876.Footnote 39
DIFFERENCE-IN-DIFFERENCES ESTIMATES OF MARGINAL EFFECTS OF CHANGES IN PATENTING RATES ON LOCALIZATION USING TWO-STAGE LEAST SQUARES

* p < 0.10.
** p < 0.05.
*** p < 0.01.
Notes:
Robust standard errors are in parentheses. The dependent variable equals 1 if an exhibit originates from one of the two or three counties with the largest number of exhibits in a given year and industry. The coefficient estimate for share of innovations with patents measures the marginal effect of a 1 percent increase in the share of innovations that are patented on geographic localization. The share of exhibits with patents is instrumented by post-1876 * Chemicals. The indicator variable post-1876 distinguishes exhibits in 1893 and 1915 from exhibits in 1851 and 1876.
A point estimate of −1.302 (Table 5, column 1) indicates that a 1 percent increase in the share of exhibits with patents is associated with a 1.3 percent decrease in geographic concentration, measured as the probability that an exhibit originated in one of the two counties with the largest number of exhibits. Using 1876 as control increases the size of the estimates (Table 5, column 2), while estimates for the C3 concentration ratio are smaller and only marginally significant (Table 5, columns 3–4).Footnote 40 Dropping exhibits from host cities, also substantially reduces the size of estimated coefficients (Table 5, column 5). As noted above, this could be due to host city bias or Philadelphia's prominent position as an early center of chemical innovation, so that dropping exhibits from Philadelphia in 1876 leads to an underestimate of the decline in localization.
CONCLUSIONS
The architects of the U.S. patent system intended it to encourage the creation and diffusion of innovations. This article has taken advantage of an exogenous increase in patenting rates for chemicals to examine the effects of patenting on the diffusion of innovations.
Geographic data on the location of U.S. innovations exhibited at four world fairs between 1851 and 1915 confirm that chemical innovations became less localized after patenting rates increased. This decline in geographic concentration cannot be explained by changes in the localization of production, which stayed relatively constant after 1876, and is robust to difference-in-differences comparisons with manufacturing machinery, where patenting rates remained unchanged. Difference-in-difference estimates indicate that a 1 percent increase in the use of patents was associated with a 1.3 percent decrease in geographic localization.
These results suggest that patents may encourage the geographic diffusion of innovations. In the nineteenth-century United States, diffusion was encouraged by a unique system of complementary institutions: Independent magazines such as The Journal of the Franklin Institute (beginning in the 1820s) and the Scientific American (beginning in the 1840s) published patent specifications and regularly described important patents.Footnote 41 In the late nineteenth century, the profession of specialized patent agents emerged to further facilitate trade in patented inventions.Footnote 42 Patent agents and magazines are likely to have strengthened the effectiveness of patents as a means to diffuse new technical knowledge and weaken the localization of innovations.