Introduction
Product market competition plays a significant role in the policy recommendations of economists. The competitive market is thought to be superior to other market arrangements because it allocates scarce resources efficiently. Moreover, it is often believed that product market competition also improves quality and lowers unit costs (Nickell, Reference Nickell1996).
Competitive market arrangements have been introduced to health care in countries where health services have traditionally been produced by the public sector (Glennerster, Reference Glennerster1998; Oliver, Reference Oliver2005; Magnussen et al., Reference Magnussen, Vrangbæk and Saltman2009). On the other hand, in the United States, where health care providers are mainly private, there exists also a vast number of non-profit providers (Horwitz and Nichols, Reference Horwitz and Nichols2009). While using competition in health care to improve its performance, the fundamental question is whether health care providers react to competition and whether the reaction differs according to the ownership of the provider or the ownership mix in the market.
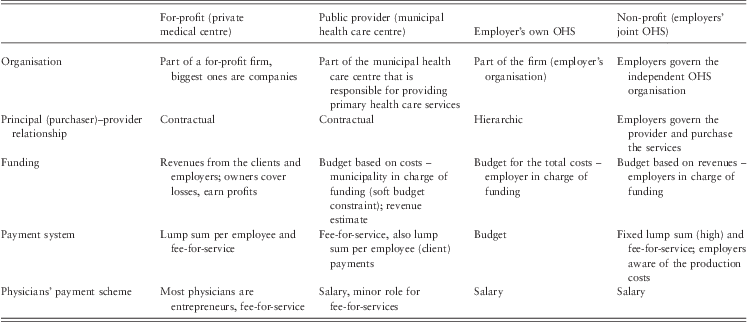
In most countries it is difficult to study how different market circumstances affect the performance of providers. It is common to have one dominant mode of organising the production of health care services, public or private, or they may each serve different populations. Finnish occupational health services (OHS) provide an unique opportunity, to study the impact of market structure and mix on health care providers’ performance. In Finland, OHS are mainly provided by private non-profit and for-profit providers. Municipal health care centres represent the public provider. They differ from each others by ownership and payment systems. For-profit providers have a fee-for-service system, so do the public providers, too. But due to the public ownership they have a soft budget constraint. Some employers have an integrated OHS provider, ‘employer's own OHS’, which has an expenditure budget. Employers have also together established non-profit associations to provide OHS services for the member companies. These providers have a combination of capitation and fee-for-service payments. The market structure for OHS varies geographically with regions with public monopolies to regions with numerous, mainly private providers and the market share of for-profit providers in Finland doubled during the study period 1992–2004.
We studied the effect of different market environment on the performance of OHS providers in a panel setting that covers the years 1992, 1995, 1997, 2000 and 2004. The performance of a provider was measured as intensity of services, productivity, the share of medical care, unit price and revenues. OHS providers are multi-professional multi-product providers and therefore we calculated a cost-weighted activity (CWA) output (Oliver, Reference Oliver2005). The first four indicators are computational indicators based on this CWA output.
Market competition and health care providers
In economics, it is well known that the market structure affects the price of a product. A monopoly has the highest price, a firm in a competitive market has the lowest price, and prices in oligopolistic markets are somewhere in between (Cabral, Reference Cabral2002). There is extensive empirical evidence mainly from the United States that higher market concentration is connected to higher prices (Gaynor and Haas-Wilson, Reference Gaynor and Haas-Wilson1999; Keeler et al., Reference Keeler, Melnick and Zwanziger1999; Gaynor and Town, Reference Gaynor and Town2011).
The quality of a product is not an issue in standard models, because the product is assumed to be homogenous. The theory of property rights (Hart, Reference Hart1995) states that for-profit firms have strong incentives to invest in innovations, which would imply that for them competition increases quality. In health care, quality or at least some attributes of it are non-contractible and providers cannot be paid for all aspects of quality. On the other hand, the incentives to control costs are strong for for-profit providers and therefore the impact of competition on their quality is ambiguous (Shen et al., Reference Shen, Eggleston, Lau and Schmid2005). There is evidence both from the United States and the United Kingdom that competition improves quality when patients may choose the hospital and prices are fixed (Kessler and McClellan, Reference Kessler and McClellan2000; Gaynor et al., Reference Gaynor, Moreno-Serra and Propper2010). When prices are market determined, the results have reflected the theoretical indeterminacy. In the United Kingdom, Propper et al. (Reference Propper, Burgess and Green2004, Reference Propper, Burgess and Gossage2008) found that quality was lower in a more competitive environment, whereas Sari (Reference Sari2002) found that higher hospital market share and concentration were associated with lower quality of care in the United States.
The predictions of market competition are based on profit-maximizing providers. Health care providers are often assumed to also have other objectives than, or instead of, the profit motive. These objectives are represented by different ownership types. Most of the empirical literature concentrates on direct effects of ownership reviewed by Eggleston et al. (Reference Eggleston, Shen, Lau, Schmid and Chan2008) and Shen et al. (Reference Shen, Eggleston, Lau and Schmid2007). In both meta-analyses the conclusion was that higher quality studies that take into account market environment and patient mix as confounding factors and use longitudinal data reveal smaller differences in performance according to the ownership. Much less has been studied the market mix, that is how the ownership structure affects the performance of a health care provider (competitive spillovers). The presence of non-profits has been regarded important for keeping the quality of the services high and the presence of for-profits to keep the costs of services low. Kessler and McClellan (Reference Kessler and McClellan2002) found in their longitudinal study that already a 10% for-profit share of first heart attack admissions was enough to lower the expenditure of all heart attack patients by 2.4% with same patient outcomes. Quality spillovers from non-profits can be expected only if at least some of the consumers are ill-informed. Then an increase in the non-profit market share will improve both for-profit and overall market quality as found in the US nursing homes by Grabowski and Hirth (Reference Grabowski and Hirth2003). Santerre and Vernon (Reference Santerre and Vernon2006) studied the welfare implication of ownership mix and concluded that it would be welfare improving to increase the share of for-profits in inpatient care and the share of non-profits in outpatient care. Market mix has an impact also on the service offerings of providers. Horwitz and Nichols studied hospitals within metropolitan statistical (Reference Horwitz and Nichols2009) and rural areas (Reference Horwitz and Nichols2011). Non-profits with low share of for-profit competitors were more likely to offer unprofitable services such as psychiatric, hospice, substance abuse and social work services than non-profits in markets with higher share of for-profit providers.
Both competition and the revenue generating process of providers such as budget funding and payment systems has influence on providers’ performance (Chalkley and Malcomson, Reference Chalkley and Malcomson2000; Kornai et al., Reference Kornai, Maskin and Roland2003). Kessler and McClellan (Reference Kessler and McClellan2000) summarised studies on the effects of competition in the United States of America that revealed the importance of the payment system for the impact of competition. Until the mid-1980s the ‘cost-plus’ reimbursement system and competition among hospitals led to excess capacity, higher production costs and prices. After the implementation of the prospective payment in 1983 competition had the opposite results. The payment system matters also for the differences between different provider types. Potter (Reference Potter2001) studied the relationship between the hospital type and expenses per admission in a panel setting (years 1980, 1985, 1990 and 1994) in the United States of America. Her findings show that the differences in efficiency measured as expenses per adjusted admission between non-profit, for-profit and public hospitals diminished after the introduction of a prospective payment system in 1983. The market environment has an impact on providers’ response to changes in the payment system. When the profitability of the home health care and skilled nursing services decreased the non-profits in markets with higher for-profit market share diminished more the provision of these services than non-profits in markets with lower for-profit market share (Horwitz and Nichols, Reference Horwitz and Nichols2009, Reference Horwitz and Nichols2011).
In addition to market structure and mix, ownership and payment system the scale and scope of services may be associated with the output of the provider. Scope inefficiencies have been found in multi-speciality groups compared with single-speciality groups by Rosenman and Friesner (Reference Rosenman and Friesner2004) and in Health Maintenance Organizations (HMOs) providing both insurance and health services (Wholey et al., Reference Wholey, Feldman, Christianson and Engberg1996). On the other hand, for small scale providers such as nursing homes, scope can help in achieving economies of scale (Christensen, Reference Christensen2004). Rosenman and Friesner (Reference Rosenman and Friesner2004) found economies of scale in both primary care and speciality care practices. Although the empirical evidence in hospitals has been conflicting, higher quality studies seem to support the finding of constant returns or diseconomies of scale (Aletras, Reference Aletras1999).
Material and methods
Finnish OHS
In Finland, employers are required by law to arrange preventive OHS for their employees. Employers may choose whether they produce the services themselves (‘employers’ own units’), found an association to provide the services (‘non-profit’) or buy the services from either municipal health care centres (‘public’) or from private medical centres (‘for-profit’). The Finnish OHS system deviates from many other countries (Hämäläinen et al., Reference Hämäläinen, Husman, Räsänen, Westerholm and Rantanen2001). In addition to health examinations and workplace assessments, 90% of employees can also obtain general practice (GP) level curative medical services from their OHS unit, although organising curative medical services is voluntary for employers. All OHS are free of charge for employees. The two other options to seek for GP level services for employees in Finland, private and public services, both involve co-payments and the access to public services is not as good as in OHS. About half of the primary care level GP visits of employees takes place within OHS (Peurala et al., Reference Peurala, Manninen, Perkiö-Mäkelä, Kankaanpää and Husman2007).
Employers bear the costs of OHS but can apply for reimbursement from the Social Insurance Institution (SII). Although the employers receive reimbursement, 60% for preventive and 50% for curative medical services, the employer is nonetheless left to bear a considerable part of the costs. The employees cannot choose the provider, thus the competition among providers is ‘buyer driven’. The total costs of organising OHS were €508 million in 2007, and the SII reimbursed €237 million to employers. The average cost was €267 per employee in 2007 [Kansaneläkelaitos (The Social Insurance Institution), 2009].
In Table 1 we have summarised the main characteristics of different OHS providers in Finland. The provider types differ according to the ownership and purchaser–provider relationship. Private medical centres are firms themselves, mainly owned by shareholders, whereas the public provider is owned by the local municipality. Still, they have a similar purchaser–provider relationship based on a contract and revenues based on fees and services provided. In employers’ own and non-profit units, employers govern the provider, but these providers have different payment systems. Employers’ own unit has a budget based on costs and non-profits have a mixture of capitation and fee-for-service payments. Employers’ own units also sell services to other employers. During the study period, the employees of these ‘buying’ employers represented one-fourth of the clientele in employers’ own units. The non-profits in Finnish OHS differ from the USA non-profits. In this study, the non-profits are associations governed by the employers, whereas in the United States they are supposed to provide services to the community in exchange for the exemption from most revenue and property taxes (Potter, Reference Potter2001). The Finnish non-profit OHS providers do have to pay taxes. Therefore, there is an incentive not to show profit. In case there would be profit they even refund the employers. The payment scheme for occupational health (OH) professionals in all three not-for-profit providers is mainly a salary, whereas in for-profits the physicians, physiotherapists and psychologists are paid on a fee-for-service basis (Gosden et al., Reference Gosden, Forland, Kristiansen, Sutton, Leese, Giuffrida, Sergison and Pedersen2001). In addition, the not-for-profit providers may have a soft budget constraint, employers have to backup their own units and non-profits and the municipal health care centre can support the public provider with taxpayers’ money.
Organisational characteristics and incentives of Finnish occupational health services providers

OHS = occupational health services.
The legislation concerning the provision of OHS is the same for all provider types with few exceptions. Only public providers have been required by the Public Health Act to provide OHS within their region. All other types may freely enter and exit the market. The fees for the public provider were set by the State Council until 1995, after that these providers were free to set prices themselves, but they were not expected to earn profits. Before the price regulation abolition the statutory set fees did not cover the production costs. So, since 1995 all prices have been market determined.
Data construction
We used data on clients, services and OH professionals from a survey conducted by the Finnish Institute of Occupational Health (FIOH) for the years 1992, 1995, 1997, 2000 and 2004. The response rate was high, over 90% per survey. Due to the reimbursement system, records on services provided by the OHS units are well standardised and the quality of the data is good. The FIOH questionnaire collected the number of hours of workplace activities (workplace surveillance, meetings, lectures, groups and counselling) and the number of health examinations and medical visits separately for physicians, nurses, physiotherapists and psychologists over a whole year.
Data on providers’ revenues were obtained from the SII, which maintains an employer-based register of the provider, content and costs of OHS. The register exists as a result of the reimbursement system. This employer-based data was combined per provider code and merged with FIOH's data using the provider's name and address at the SII. We had at our disposal an unidentified data. The first FIOH survey in 1992 was based on the provider register of the SII. Later FIOH updated the provider register itself and the fit of the survey and the SII provider register fell. In 1992, almost all of the providers in the FIOH survey could be linked to the SII register. Later the percentage decreased: in 1997 it was 90%, and further dropped to 75% in 2000 and 67% in 2004. The merged data contains during the study period on average 230 public providers, 350 employers’ own and 43 OHS associations governed by several employers and 180 for-profit medical centres, altogether 4059 observations. Because of entry and exit of providers, our data is an unbalanced panel data set.
To represent the output we constructed an indicator, the CWA output (Oliver, Reference Oliver2005). We calculated all services in minutes and summarised them by OH professional group. In order to make the output of different professional groups comparable, the minutes of each OH professional group was weighted by its wage, proportional to physicians’ wages in 2004. The wages are national averages provided by the Commission for Local Authority Employers. We checked the salary ratios in the private sector and they were similar to the public ones. Cost-weighted output is the sum of the wage-adjusted output of all OH professional groups. In OH the division of resources into prevention and medical services is important. For example, the reimbursement system aims at steering more resources into prevention. The service-mix could also reveal the differences in the objectives of provider types. Therefore, we wanted to study the service-mix and calculated the curative medical services’ share of the CWA output.
The indicator for productivity was calculated from the CWA output indicator. The weekly working hours of OH professionals were weighted by wage of each group proportioned to physicians’ wages in 2004, then summed into one figure that measured personnel resources. Productivity measure is the ratio of CWA output per personnel resources.
We used intensity of OHS as an indicator for quality. Intensity was measured as CWA output per client, which in our study is the same as an employee. It represents process quality perceived by the employee (client). Quality is assumed to be higher if there are more services per client, or if a more qualified person provides the service, for example a physician instead of a nurse.
At the SII, employers’ reimbursement applications were summed up per provider. The sum of the employers’ expenditure equals the total of the provider's revenue. Nominal values were converted to 2004 real values by the health care cost index. A Unit price was calculated by dividing the revenue of a provider by its CWA output.
The geographical market areas where the providers are expected to compete with each other are based on a classification provided by Statistics Finland and based on commuting and close collaboration of municipalities in regional development. Every provider was located to a municipality based on its zip code. There were 428 municipalities in 2004, which formed 76 geographical regions. We excluded Åland Islands with 16 municipalities and only one provider. Market structure was measured by the number of providers in the region and market mix by the market share of for-profit providers calculated from the number of clients (employees). Another option to measure market structure would have been to use Herfindahl–Hirshman index (HHI) that represents the concentration of the market. Wong et al. (Reference Wong, Zhan and Mutter2005) have empirically shown that the effects of competition remain qualitatively the same irrespective of the measure. In their study also the magnitude of the impact of competition based on number of providers and HHI was similar on the county level, the definition of market closest to our geographical market definition. In our study there was an association between both concentration and the number of providers (correlation −0.80) and the market share of the for-profit providers (−0.62).
In this study, the professions available in the unit describe the scope of the provider. Scope was measured using a dummy: 0 = OH professionals consisted of nurses and physicians only; 1 = nurses, physicians and also either a physiotherapist or psychologist; or 2 = all four professional groups. Scale was measured by the number of OH professionals.
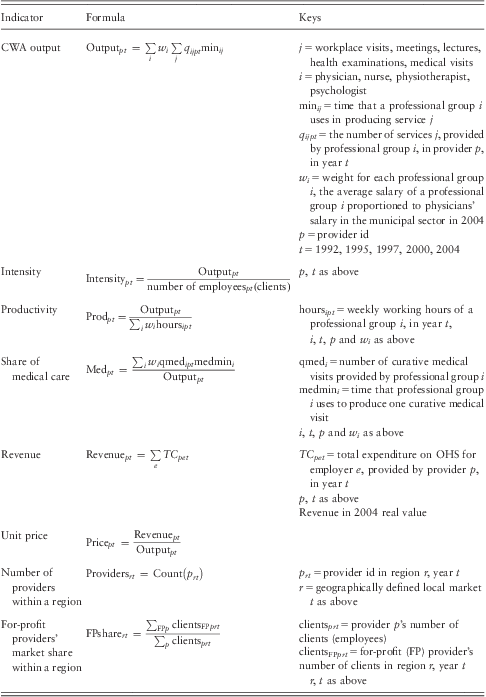
Appendix 1 presents the formulae for the performance and market indicators.
Most of our indicators are ratios and often based on summing up data. The survey had different time frames for different data, for example the number of services concerned a whole year and the number and working hours of personnel one month the following spring. If there were changes in the number of personnel during the first months of the year of the survey, the output-personnel ratios were flawed. In addition, if one professional group had missing data on some of it services it could create problems in calculating the output. Therefore, we examined the studentized residuals exceeding +2 or −2 for identifying outliers, and recoded the indicator values missing for the providers whose outlier values were due to the mismatch of timing or missing data. The share of missing data was highest in the calculation of the unit price (26%) and the lowest in the revenue of the provider (15%).
Methods
We applied ordinary least squares (OLS) regression analysis to find out how ownership type was associated with the performance and panel models to study how changes in the market structure (number of providers) or changes in the market mix (market share of for-profit providers) were associated with changes in performance.
We started the analysis with OLS regression analysis and with separate models for each year and for the pooled data. Model specification was tested using the Ramsey RESET test. Based on the test, logarithmic transformations were made for the following variables: number of OH professionals and providers, intensity, productivity, unit price and revenue. Earlier studies have shown that the relation between competition and various performance indicators might not be linear. To check this, models with a squared number of providers were made, but their performance was poorer. Heteroskedasticity of the models was tested with the Breusch–Pagan/Cook–Weisberg test and it showed heteroskedasticity in all models. Therefore, we applied cluster-robust standard errors for pooled OLS models.
The pooled OLS model:
 $$\displaylines{ & {\rm{indicato}}{{{\rm{r}}}_{pt}}\,{\rm{ = }}\,\alpha \,{\rm{ + }}\,{\rm{typ}}{{{\rm{e}}}_{pt}}\,{\rm{ + }}\,{{\beta }_{\rm{1}}}\,{\rm{provider}}{{{\rm{s}}}_{rt}}\,{\rm{ + }}\,{{\beta }_{\rm{2}}}\,{\rm{typ}}{{{\rm{e}}}_{pt}} \cr & \,\times \,{\rm{provider}}{{{\rm{s}}}_{rt}}\,{\rm{ + }}\,{{\beta }_{\rm{3}}}\,{\rm{FPshar}}{{{\rm{e}}}_{rt}}\,{\rm{ + }}\,{{\beta }_{\rm{4}}}\,{\rm{typ}}{{{\rm{e}}}_{pt}}\,\times \,{\rm{FPshar}}{{{\rm{e}}}_{rt}}\,{\rm{ + }}\,{{\beta }_{\rm{5}}}\,{\rm{scal}}{{{\rm{e}}}_{pt}} \cr & \,{\rm{ + }}\,{{\beta }_{\rm{6}}}\,{\rm{dummyscop}}{{{\rm{e}}}_{pt}}\,{\rm{ + }}\,{{\beta }_{\rm{7}}}\,{\rm{time}}\,{\rm{ + }}\,{{\beta }_{\rm{8}}}\,{\rm{typ}}{{{\rm{e}}}_{pt}}\,\times \,{\rm{time}}\,{\rm{ + }}\,{{\mu }_{pt}}, \cr}$$
where μpt~IID(0,σμ). The variables in the models can be found in Appendix 1, p refers to the provider, r to the region and t to the year. The variable time controls for time trends and shocks common to all providers.
To take advantage of our panel data, fixed effects models were applied, which are viewed as appropriate tools for eliminating bias arising from time-invariant unobserved factors (Greene, Reference Greene2003; Shen et al., Reference Shen, Eggleston, Lau and Schmid2007). Statistically, fixed effects models are always a reasonable thing to do with panel data (they always give consistent results) but they may not be the most efficient models to run. The Hausman test showed that for all indicators the fixed effects model turned out to be better than the random effects model. We applied robust standard errors. Having only five time points in our data, we did not take possible autocorrelation into account.
The fixed effects model:
 $$\displaylines{ {\rm{indicato}}{{{\rm{r}}}_{pt}}\, & {\rm{ = }}\,{\rm{(}}\alpha \,{\rm{ + }}\,{{\mu }_p}{\rm{)}}\,{\rm{ + }}\,{{\beta }_{\rm{1}}}\,{\rm{provider}}{{{\rm{s}}}_{rt}}\,{\rm{ + }}\,{{\beta }_{\rm{2}}}\,{\rm{typ}}{{{\rm{e}}}_{pt}}\,\times \,{\rm{provider}}{{{\rm{s}}}_{rt}} \cr & {\rm{ + }}\,{{\beta }_{\rm{3}}}\,{\rm{FPshar}}{{{\rm{e}}}_{rt}}\,{\rm{ + }}\,{{\beta }_{\rm{4}}}\,{\rm{typ}}{{{\rm{e}}}_{pt}}\,\times \,{\rm{FPshar}}{{{\rm{e}}}_{rt}}\,{\rm{ + }}\,{{\beta }_{\rm{5}}}\,{\rm{scal}}{{{\rm{e}}}_{pt}}\, \cr & {\rm{ + }}\,{{\beta }_{\rm{6}}}\,{\rm{dummyscop}}{{{\rm{e}}}_{pt}}{\rm{ + }}\,{{\beta }_{\rm{7}}}\,{\rm{time}}\,{\rm{ + }}\,{{\beta }_{\rm{8}}}\,{\rm{typ}}{{{\rm{e}}}_{pt}}\,\times \,{\rm{time}}\,{\rm{ + }}\,{{v}_{pt}}{\rm{,}} \cr}$$
where vpt~IID(0,σv). In fixed effects model μp is allowed to correlate with other regressors.
We studied whether different provider types’ performance had different associations with market structure and if they differed in their trajectories. Therefore, we included interactions of the variables ‘type of provider’ and the number of providers, the market share of non-profits and time (continuous) to all models. We computed the F-statistic to test (a) if the coefficients for the variables representing competition (number of providers, the market share of for-profit providers) or time and the interaction terms jointly differed from zero and (b) if the interaction terms of the public, employers’ own and non-profit providers differed from that of for-profit providers (Stock and Watson, Reference Stock and Watson2007).
We compared changes in our performance indicators associated with a huge change in competition in the panel model and ownership type. Change in market structure was assessed as a change from the 25% percentile to 75% percentile in 2004 both in the number of providers (logarithm) or the market share of for-profit providers. The dummies in the pooled OLS models represent the differences between the ownership types.
We checked the robustness of our results to the weights that we used in constructing the cost-weighted output, the base for most of our performance indicators. We estimated the models also with proportional wages for private providers obtained from trade union statistics and the municipal wages for public providers. In our models the structure of the market was measured as the number of all providers in the region. We constructed two other measures for the structure: (1) a variable based on the number of providers without employers’ own units and (2) a dummy variable based on the number of providers: a market with less than six providers, a market with 7–19 providers and a market with 20 or more providers. The reason to leave employers’ own unit out of the number of providers in the region is that they might not compete for employers the same way as the other provider types. In average, three-thirds of the clients (employees) in employer owned units were employed by the organisation that owned also the OHS provider. The cut-off point of 6 has also been used by Santerre and Vernon (Reference Santerre and Vernon2006). They justify this cut-off by 6 by the fact that equally sized hospitals would lead into an HHI of 1800, which would be regarded highly concentrated by the Federal Trade Commission and Department for Justice. Also Cabral (Reference Cabral2002) calculated that seven providers in Cournot model would be enough to achieve a price level of a competitive market. The correlation between the number of providers in the region and the number of providers without the employers’ own units was 0.92 and the correlation with the dummy was 0.86.
Finally, we examined the potential endogeneity of the market structure and compared fixed effects panel model and instrumental variables (IV) panel model. We used the number of employees, the number of employers (both from our data) and the median household income (provided by the Statistics Finland) to predict the number of providers and the share of for-profit providers in the region. Unfortunately, we did not have access to household income data for 1992. Therefore, we only used the years 1995, 1997, 2000 and 2004 in this analysis. We applied STATAs xtivreg2 (available from SSC archive) and Hausman test to examine if the fixed effect panel model is preferred to IV.
We used STATA version 9 for the analysis.
Results
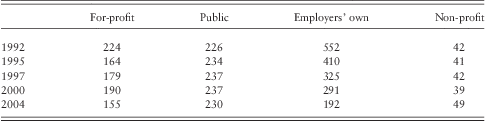
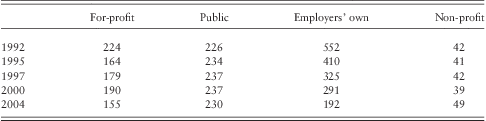
The number of all OHS providers decreased during the study period from 1006 to 621, mostly because the number of employers’ own units decreased with almost 60%. This was due to closing down of the companies during the Finnish recession of the early 1990s and later due to outsourcing. The number of for-profit providers increased until 2000, but since then mergers have decreased this number. The number of public providers and non-profit providers slightly increased during the study period (Table 2). The market shares in the whole of Finland changed during the study period. For-profit providers’ market share more than doubled to 37% in 2004. The market share of employers’ own units halved to 18% in 2004. The market share of public providers decreased by 5% units to 39% in 2004 and non-profits had a very stable market share of about 6%.
Number of providers by provider type 1992–2004
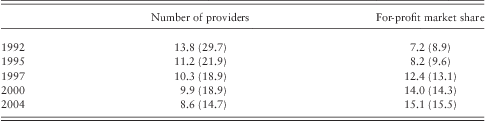
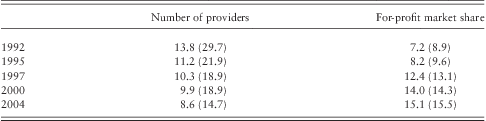
Most regions can be considered competitive, but the local markets for OHS varied greatly (Table 3). The for-profit providers and employers’ own units are concentrated in more competitive regions. For them, the average number of providers in the region was almost 50 and the for-profit market share 35% in 2004. The non-profits and public providers faced less competition. On average the non-profit providers had 30 competitors and the market share of for-profit providers was 29% in 2004; public providers had 14 competitors and the market share of for-profit providers was 19% on average in 2004.
Competitiveness of the market measured with the number of providers and the market share of for-profit providers (%) in a region (n = 76), mean and (standard deviation)
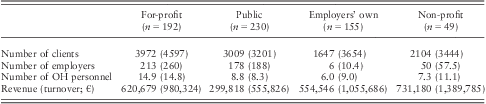
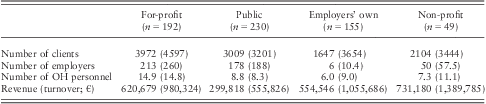
The provider types did not only differ according to the market structure and mix but also according their size and clientele. In general, Finnish OHS units are small when measured in terms of number of clients and revenue. For-profit and public providers serve also small and medium-sized employers. Municipalities as employers usually buy their OHS from the municipal health care centre, being the biggest employer client for the public provider (Table 4).
Number of clients (employees), employers and occupational health personnel and revenues (€) in 2004, mean and (standard deviation)
OH = occupational health.
The scope of the services changed during the study period. In 1992, the personnel mainly consisted of nurses and physicians only. In 2004, less than one-fifth of for-profit and public units had only nurses and physicians and almost half of them had four professions available: nurses, physicians, physiotherapists and psychologists. In the employer's own units and the non-profit units it was still common in 2004 to have only nurses and physicians (40–50% of the units), and only less than one-fifth had all four professions present.
Four of our indicators are ratios and comparable between the provider types. Figures 1–4 show the averages of these indicators by the provider type during the study period. Public providers have been catching up with the other provider types in intensity and the share of medical care (Figures 1 and 3). The variation in productivity between the provider types has disappeared almost completely (Figure 2). The unit price in employers’ own units and non-profits has been rising the whole study period but in for-profits the unit price has been quite stable and the unit price of public providers has reached the level of for-profits in 2004 (Figure 4).
Intensity of the services (cost-weighted activity output/client) according the type of the provider in 1992–2004, mean
Productivity [cost-weighted activity output/(salary weighted weekly working hours)] according the type of the provider in 1992–2004, mean
Share of medical care (%) according to the type of the provider in 1992–2004, mean
Unit price (provider's revenue/cost-weighted activity output) according the type of the provider in 1992–2004, mean, 2004 real value
For each indicator, we present the results for the pooled OLS and panel model. Both models include interactions when they are statistically significant. The pooled OLS models show if the market variables, the number of providers and the for-profits’ market share, are associated with performance indicators. The fixed effects panel models reveal if changes in the performance indicators are associated with the changes in the market variables.
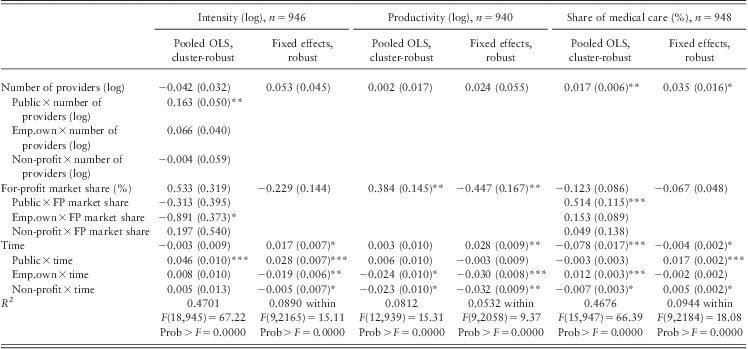
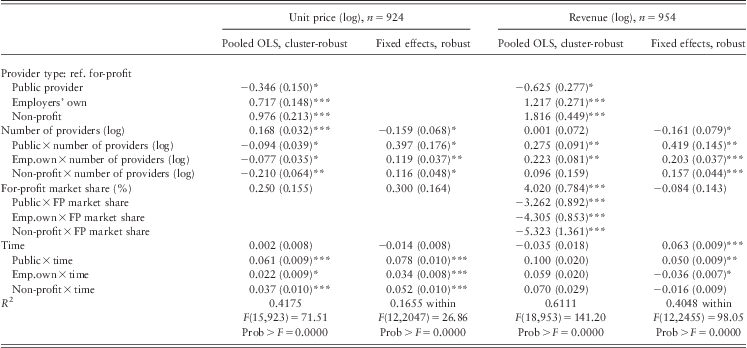
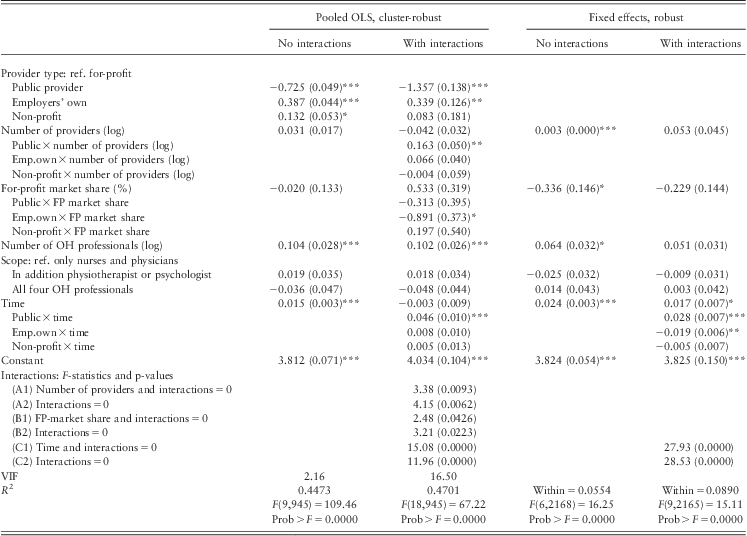
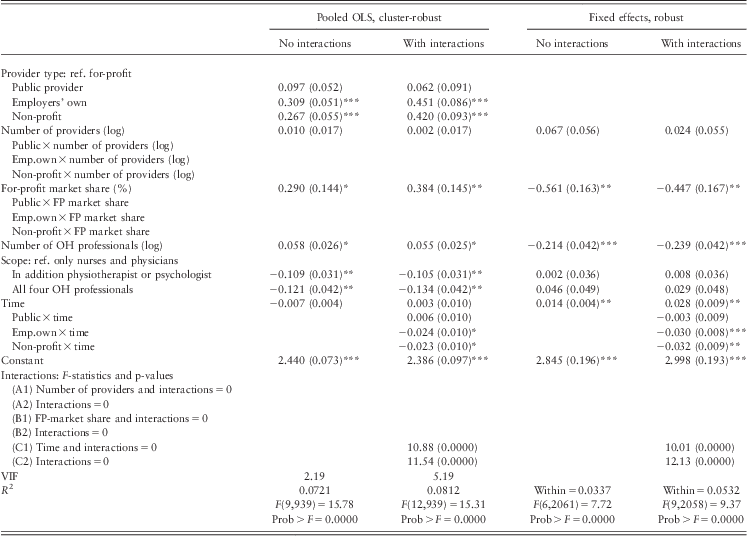
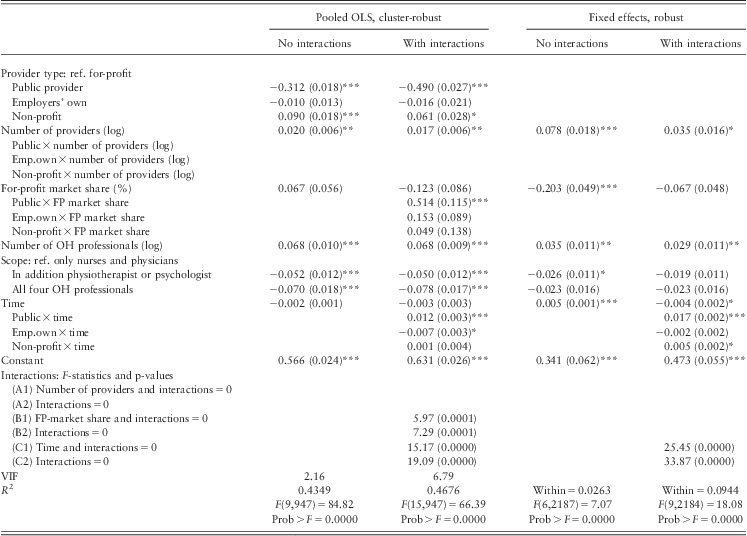
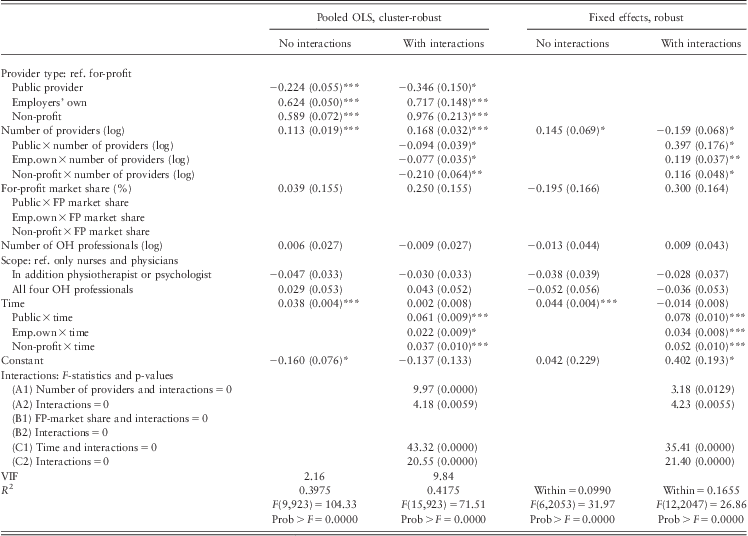
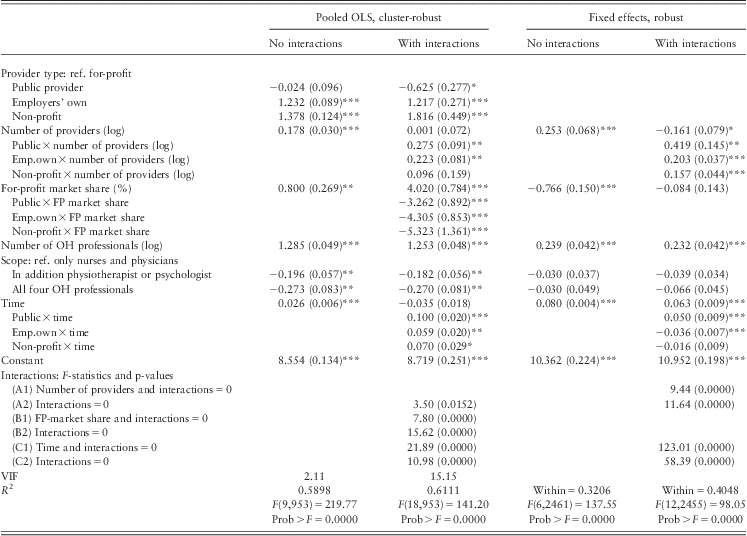
We grouped the indicators to two tables: those related to output – intensity, productivity and the share of medical care (Table 5) – and the monetary indicators – unit price and revenue (Table 6). All models include also scale and scope variables. The results of these variables are not shown in Tables 5 and 6, but available in Appendices 2–6 where we present also the F-statistics for the interactions, and the models without interactions.
Number of providers, for-profit providers’ market share and intensity, productivity and share of medical care among Finnish OHS providers in 1992–2004, pooled OLS and fixed effects panel models (standard error of the coefficient in the parenthesis)
OHS = occupational health services; OLS = ordinary least squares.
*p < 0.05, **p < 0.01, ***p < 0.001.
The pooled OLS models also include provider type dummies, and all models include scale and scope variables and a constant (data shown in Appendices 2–4).
The share of medical care was positively associated with the number of providers both in the pooled OLS and the panel model. The positive association between the market share of for-profits and productivity in the pooled OLS model changed into a statistically significant negative association in the panel model. Otherwise the variables representing market structure and mix were not associated with intensity, productivity and the share of medical care.
For output-related indicators, none of the interaction terms with the variables representing competition were statistically significant in the panel models, which we regard more important than the pooled OLS. Instead, provider type interactions with time show that the different provider types had different time trajectories. All together provider types increased intensity during the study period. But the development was different for the not-for-profits: public providers increased intensity and the employers’ own and the non-profits decreased intensity compared with for-profits. Also the overall productivity increased during the study period, although productivity in the employers’ own and non-profits units decreased compared with for-profits. The share of medical care was decreasing in time, but here again the trend differed according the provider type. Especially the public providers increased the share of medical care during the study period compared with for-profits.
Table 6 presents the results for the monetary indicators. The fixed effect model shows that for for-profit providers changes both in the unit price and the revenue of the provider were negatively associated with a change in the number of providers in the region. The interactions show that for the public providers the association was positive. Also employers’ own and non-profit providers differed from for-profit providers: their interaction coefficients with the number of providers almost offset the coefficient of for-profit providers for the unit price and the revenue. Changes in the market mix were not associated with changes in providers’ unit price and revenue. The coefficients for the for-profit market share were not statistically significant in the panel models.
The not-for-profit providers increased their prices compared with for-profits during the study period (interactions with time in the panel model), especially the public providers. The revenues in real terms had a positive time trend due to the fact that for-profit providers and the public providers increased their revenues.
The models took into account market structure and mix, scope and scale economies. Usually, in a fixed effect panel model a time trend is included in the model to capture the impact of omitted variables that change during the study period but whose impact is the same for all providers. In our study the Figures 1–4 and the provider type interactions with time show that the provider types had different paths over time.
We compared the direct effects of ownership with the changes in the market structure (the number of providers) and market mix (the market share of for-profit providers). The differences in all indicators due to the provider type were greater than the differences associated with a huge change in the competitiveness of the market we estimated based on the panel models. We varied the number of providers (logarithm) or the market share of for-profit providers from the 25% percentile values (Q1) to the 75% percentile (Q3) in 2004.
To check the consistency of the results we applied private sector wage ratios for private providers in constructing the CWA, but the results did not change. We applied also two different measures for the structure of the market. The results of the panel models with the number of providers excluding employers’ own units or dummies (less than six, 6–19 and 20 or more providers) were similar to the ones presented here for productivity and unit price. The results differed slightly for other performance indicators. A change in the number of providers excluding employers own units was positively associated with a change in intensity for for-profit providers and negatively for public and non-profit providers. In the model with the number of all providers there was no association between a change in the structure of the market and intensity. We measured the market structure also with a dummy: a market with less than six providers (during the study period, 12% of all OHS units), a market with 7–19 providers (47% of all OHS units) and a market with more than 20 or more providers (41% of OHS units). There was no association between a change in the dummy and a change in intensity, share of medical care and revenues of the provider.
We compared the fixed effects panel models with IV panel models. The models differed from the ones presented here: variable scope and interactions are not included in the model and we did not have data on household income for 1992. We used the number of employees, the number of employers (both from our data) and the median household income to predict the number of providers and the share of for-profit providers in the region. For the dependent variables share of medical care, unit price and revenue, the Hausman test revealed that the fixed effects panel model is preferred to IV [see e.g. Dougherty (Reference Dougherty2007) and Baltagi (Reference Baltagi2008)]. For intensity and productivity the test recommended IV modeling. For intensity, the market variables were not statistically significant in the fixed effects panel model; in the IV model, intensity was negatively associated with the for-profit (FP) market share. Also for productivity the results of the two models differed. In the IV model the number of providers was positively and statistically significantly associated with productivity, the coefficient for the FP market share was also positive but not statistically significant. In the fixed effects panel model the coefficient for the number of providers was not statistically significant and the coefficient for the FP market share was negative and statistically significant.
Discussion
As fixed effect panel models show whether a change in the market structure or market mix was associated with a change in the performance of a provider, the discussion here is mainly based on the results of the panel models.
In general, the market competition measured as the number of providers did not have a strong and clear association with the performance indicators related to the output: intensity, productivity and the share of medical care. Only the share of medical care was positively associated with the number of providers both in the pooled OLS and the panel models and similarly for all provider types. Also intensity was positively associated with the number of providers in the panel model without interactions. When provider type interactions were included in the model the association was not statistically significant. A change in the number of providers was not associated with changes in productivity.
Market mix was not associated with the output-related indicators either. The only statistically significant association existed between market mix and productivity: the positive association between the market share of for-profits and productivity in the pooled OLS model changed into a negative association in the panel model.
There were no differences in the associations between competition and performance in output-related performance indicators according to the ownership: interactions in the panel models for intensity, productivity and the share of medical care between provider types and both the number of providers and the market share of for-profit providers were not statistically significant.
Competition measured with the number of providers had an association with the monetary indicators but the provider types differed. For for-profit providers, the association was as the economic theory presumes: the unit price and provider's revenue both decreased when the number of providers increased in the region. Opposite to the result for for-profits, the public providers had higher unit prices and revenues when the number of providers increased. For the two other provider types, employers’ own units and non-profits, the association between the monetary indicators was weaker than for for-profits. Their provider type interactions with competition almost offset the coefficient of for-profit providers.
Change in market mix had an association only with productivity, and a negative one. Our result is against the conventional wisdom that the presence of for-profit providers would increase productivity and lower costs and prices. Shen et al. (Reference Shen, Eggleston, Lau and Schmid2007) found a similar result in their meta-analysis: there was not consistent support for for-profit hospitals operating more efficiently. Changes in the unit price of providers did not have an association with changes in the market mix in the panel models. The three other indicators, intensity, share of medical care and revenue, had first a negative association with the market share of for-profit providers. But when the interactions were included in the model, it turned out that the changes were due to provider type interactions with time rather than due to changes in market mix. The associations between changes in all five indicators and market mix were similar for all provider types: there were no provider type interactions with the market share of for-profit providers.
All performance indicators also showed a time trend that differed according to provider type. We interpret this result as a path dependency: providers have a tendency to continue the same behaviour. Path dependency has been found on system level (Oliver and Mossialos, Reference Oliver and Mossialos2005). The magnitude of difference in performance was more associated with ownership type than with changes in market structure and market mix.
A strong feature of our study is that the panel data included a large number of observations and covered almost all OHS providers in Finland. The meta-analysis by Shen et al. (Reference Shen, Eggleston, Lau and Schmid2005) showed that including data from both a survey and an official register and logarithmic transformations of variables improve the quality of a study comparing the performance of health care providers. Defining the geographical market is always difficult. Here we used regions defined by Statistics Finland based on regional collaboration and commuting, which also have the advantage of reflecting topographical features and travel time (Horwitz and Nichols, Reference Horwitz and Nichols2009). We checked the robustness of the results by constructing alternative measures for competition and received mainly similar results.
There are limitations in our study, too. We did not have data on clients (employees), which has proven important in comparing providers. The data were received from surveys to providers and a register that did not include information on the quality of the services as perceived by clients or on the impact on health. The simultaneous determination of the market structure and the performance of providers causes a potential endogeneity problem, especially in studies with cross-sectional data (Evans et al., Reference Evans, Froeb and Werden1993). We applied Hausman test in the comparison of fixed effects and IV panel models. For the variables share of medical care, unit price and revenue the Hausman test revealed that the fixed effects panel model is preferred to IV. For intensity and productivity the test recommended IV modeling, so the results for these two variables should be interpreted with caution. Our data did not enable to take into account the structure (bargaining power) of the employers.
Grabowski and Hirth (Reference Grabowski and Hirth2003) regarded the existence of spillover effects as a proof for information asymmetry in the nursing home markets. In our study, the share of for-profit providers did not have an impact on the performance indicators (except the negative association with productivity). The non-existent spillovers could then be a signal that the differences that existed and remained between the provider types were due to heterogeneity of employers and employees. On the other hand, the market shares have changed considerably in the past 10 years [Kansaneläkelaitos (Social Insurance Institution), 2007; Manninen, Reference Manninen2009]. This implies that the segments are not totally separate and there must be some competition.
The monetary indicators of for-profit providers reacted as the economic theory presumes: a change in competition (higher number of providers) was associated negatively with unit price and revenue. Although the results were the opposite for the public provider, the result is understandable. Public providers experienced a change in the regulatory environment. First in 1995 the regulation of their prices was abolished. In a more competitive environment, the public providers were more sensitive to react to the abolishment of the price regulation and raise their prices. During the study period, the public providers got more power to decide upon their resources and were more dependent on the payments by employers and less on politicians (Maarse et al., Reference Maarse, Rathwell, Evetovits, Preker and Jakubowski2005). These two changes can explain why the public providers started to resemble more and more for-profit providers [institutional isomorphism (Potter, Reference Potter2001; Horwitz and Nichols, Reference Horwitz and Nichols2009)].
Employers’ own units and non-profits had higher intensity and productivity but higher unit costs. The payment system, expenditure budget in employers’ own units and mainly capitation payments in non-profits, can be interpreted as that employers were purchasing capacity. When purchasers face uncertainty, that is, they do not know what kind of services will be needed, they buy an option for the capacity. Uncertainty connected to the demand (need) of the services creates a market for the option to use the services. In option demand markets, the providers are able to earn rent due to the uncertainty (Capps et al., Reference Capps, Dranove and Satterthwaite2003). This phenomenon could be one reason why employers’ own units and non-profits can sustain their price level.
The Finnish OHS services and markets differ from hospitals in the United States. First, consumers do not choose the provider. Second, the provider types have different payment systems and the prices are market determined – there is no prospective payment system. Third, the entry and exit in the OHS market is easier than starting or closing a hospital. However, it is of interest outside the Finnish OHS that also public providers are more sensitive to react to regulatory changes in more competitive environments. We found competitive spillovers only in productivity; information asymmetry and heterogeneity of consumers are both important issues in understanding and empirically testing market spillovers. And finally, public providers had lower intensity and share of medical care than the other provider types. Public ownership is a tool to regulate resources and capacity. Those employers who most valued high capacity seemed to be willing to pay higher prices, too.
Acknowledgment
We are grateful for the financial support received from the Finnish Work Environment Fund and the Finnish Post Graduate School in Social and Health Policy, Management and Economics. We thank the personnel of the Social Insurance Institution and the Finnish Institute of Occupational Health for the excellent collaboration and the two anonymous reviewers for their critical and constructive comments.
Number of providers, for-profit providers’ market share, unit price and revenue among Finnish OHS providers in 1992–2004, pooled OLS and panel models (standard error of the coefficient in the parenthesis)
Indicators for OHS and competition
Models for intensity among Finnish OHS providers (n = 946) in 1992–2004, pooled OLS and panel models without and with interactions
Models for productivity among Finnish OHS providers (n = 940) in 1992–2004, pooled OLS and panel models without and with interactions
Models for share of medical care among Finnish OHS providers (n = 948) in 1992–2004, pooled OLS and panel models without and with interactions
Models for unit price among Finnish OHS providers (n = 924) in 1992–2004, pooled OLS and panel models without and with interactions
Models for revenue among Finnish OHS providers (n = 954) in 1992–2004, pooled OLS and panel models without and with interactions