



1. Introduction
The investigation into the nature of thermal convection under the influence of magnetic fields has been invoked frequently to explore the fundamental principles of magnetoconvection, owing to its broad range of applications, including stable crystal growth and the optimization of heat exchanger performance (Busse & Clever Reference Busse and Clever1983; Cioni, Chaumat & Sommeria Reference Cioni, Chaumat and Sommeria2000; Tasaka et al. Reference Tasaka, Igaki, Yanagisawa, Vogt, Zuerner and Eckert2016; Liu, Krasnov & Schumacher Reference Liu, Krasnov and Schumacher2018; Akhmedagaev et al. Reference Akhmedagaev, Zikanov, Krasnov and Schumacher2020a; Vogt et al. Reference Vogt, Yang, Schindler and Eckert2021). Unlike regular fluids, flowing liquid metal under the influence of a magnetic field generates induced currents and interacts with the magnetic field to produce Lorentz force, thereby altering its original motion characteristics. Normally, due to the low viscosity of liquid metals, they tend to develop into turbulence quite easily. When a magnetic field is applied, the flow becomes anisotropic and even two-dimensional (2-D) as it stretches along the direction of the field. However, the influence of the magnetic field can manifest itself in different ways (Eckert et al. Reference Eckert, Gerbeth, Witke and Langenbrunner2001; Pothérat & Klein Reference Pothérat and Klein2017).
One classical model for studying the impact of magnetic fields on thermal convection systems driven by temperature differences is Rayleigh–Bénard convection (RBC). This system is deceptively simple. Electrically conducting fluid confined in a cuboid vessel is exposed to a horizontal magnetic field, and a destabilizing vertical temperature gradient is heated from the bottom and cooled from the top. There are three important dimensionless control parameters in such a system: the Rayleigh number, Chandrasekhar number and Prandtl number, which are given by
 \begin{equation} Ra = \frac{g\alpha\,\Delta T\,H^3}{\nu \kappa},\quad Q=B_0^{2}L^{2}\,\frac{\sigma}{\rho \nu} \quad {\rm and} \quad Pr=\frac{\nu}{\kappa}, \end{equation}
with the gravity acceleration  $g$, the thermal expansion coefficient
 $\alpha$, the temperature difference between the horizontal boundaries of the fluid layer
 $\Delta T$, the height of the layer
 $H$, the kinematic viscosity
 $\nu$, the temperature diffusivity
 $\kappa$, the electrical conductivity
 $\sigma$, the mass density
 $\rho$, and the imposed magnetic field strength
 $B_0$. The cuboid vessel has a square cross-section with horizontal side lengths
 $L$ and aspect ratio
 $\varGamma = L/H$.
For a much smaller Prandtl number flow, the transition from steady convection to turbulence occurs more drastically with increasing  $Ra$ (Krishnamurti & Howard Reference Krishnamurti and Howard1981) and gives rise to much smaller stable regions of 2-D convection rolls in RBC. Through a stability analysis, Busse (Reference Busse1978) showed that the stable convection rolls region, also called the ‘Busse balloon’, shrinks with decreasing
 $Pr$, which makes it difficult to be realized in experiments at low
 $Pr$ conditions. Nonetheless, invariably the implementation of a horizontal magnetic field is employed to surmount the aforesaid predicament. For instance, the weakly nonlinear theory postulates that magnetic fields having a diminutive
 $Q$ expand the Busse balloon region, as proposed by Busse & Clever (Reference Busse and Clever1983) regarding stability concerns. In other words, when
 $Ra$ is sufficiently high, convection rolls will become unstable, undergo transition, and exhibit a plethora of intriguing flow phenomena such as turbulence as the magnetic field decreases gradually. The research conducted by Houchens, Witkowski & Walker (Reference Houchens, Witkowski and Walker2002) indicates that for RBC, increasing the vertical magnetic field strength leads to an increase in the critical
 $Ra$ at which instability occurs.
Regarding the impact of horizontal magnetic fields on thermal convection, the essential aspect lies in the constraint imposed by the wall, such as Hartmann braking. Burr & Müller (Reference Burr and Müller2002) characterized this effect as the increasing of the onset convection threshold, and predicted an increase in the wavenumber of 2-D rolls with the rise of  $Q$. Additionally, they demonstrated further the occurrence of turbulent thermal convection induced by oscillatory convection through the adjustment (
 $Ra, Q$). The evidence of turbulent thermal convection being suppressed by an increase in
 $Q$ for a fixed
 $Ra$ is substantiated by variations in the power spectrum of temperature fluctuations within the fluid layer. Nevertheless, these variations do not depict a straightforward progression towards turbulent thermal convection, leaving some intricate flow structures unexplained due to the limited information on the flow field.
Recently, with the development of ultrasonic velocity measurement, statistical spatio-temporal convection patterns in a liquid metal have been studied experimentally, and various flow regimes and transitions between them have been uncovered (Yanagisawa et al. Reference Yanagisawa, Yamagishi, Hamano, Tasaka and Takeda2011, Reference Yanagisawa, Hamano, Miyagoshi, Yamagishi, Tasaka and Takeda2013; Yanagisawa, Hamano & Sakuraba Reference Yanagisawa, Hamano and Sakuraba2015; Tasaka et al. Reference Tasaka, Igaki, Yanagisawa, Vogt, Zuerner and Eckert2016; Vogt et al. Reference Vogt, Ishimi, Yanagisawa, Tasaka, Sakuraba and Eckert2018, Reference Vogt, Yang, Schindler and Eckert2021). Yanagisawa et al. (Reference Yanagisawa, Yamagishi, Hamano, Tasaka and Takeda2011) conducted numerous experiments on heat transfer in the presence of a horizontal magnetic field, and summarized multiple complex flow mechanisms. For instance, in a flat container with aspect ratio 5, they observed stable four-roll and four-roll reversal phenomena as the horizontal magnetic field increased, and they measured the frequency of the reversal. Subsequently, Yanagisawa et al. (Reference Yanagisawa, Hamano, Miyagoshi, Yamagishi, Tasaka and Takeda2013) increased the values of  $Ra$ and
 $Q$, and summarized various flow mechanisms within the given parameter space, including no-roll, the transition from four-roll to three-roll, four-roll oscillation, the transition from five-roll to four-roll, stable five-roll, stable four-roll, and no convection. To gain deeper insight into the mechanism of flow reversal, Yanagisawa et al. (Reference Yanagisawa, Hamano and Sakuraba2015) provided a detailed description of the reversal process and attempted to explain it in terms of skewed-varicose instability. Vogt et al. (Reference Vogt, Ishimi, Yanagisawa, Tasaka, Sakuraba and Eckert2018) also believed that this flow reversal might be caused by oscillation instability and skewed-varicose instability, but there is still no definitive mechanism to explain this conversion process. At the same time, Vogt et al. (Reference Vogt, Ishimi, Yanagisawa, Tasaka, Sakuraba and Eckert2018) cleverly designed a set of experiments that depicted the evolution of flow from stable to unstable, from two to three dimensions, by fixing
 $Ra$ and gradually reducing
 $Q$. Consequently, they obtained typical flow mechanisms similar to those discovered by Yanagisawa et al. (Reference Yanagisawa, Hamano, Miyagoshi, Yamagishi, Tasaka and Takeda2013), and also focused on secondary flow in the Hartmann layer in parallel and perpendicular magnetic field directions. Subsequently, Vogt et al. (Reference Vogt, Yang, Schindler and Eckert2021) and Yang, Vogt & Eckert (Reference Yang, Vogt and Eckert2021) conducted similar experiments and discovered that the magnetic field resulted in a significant enhancement of heat and momentum transport. However, there is a lack of mechanistic explanation for the scales relevant to the convective flow and heat transfer.
The focus of our investigation here is on the RBC with a horizontal magnetic field and sidewalls. High-resolution direct numerical simulations (DNS) of flows in a cuboid vessel with  $\varGamma =5$,
 $Pr=0.033$,
 $10^5 \leq Ra \leq 10^7$ and
 $Q\leq 9 \times 10^6$ are performed. The work follows the experiments by Yang et al. (Reference Yang, Vogt and Eckert2021) carried out at the same
 $\varGamma$ and
 $Pr$, and at
 $Ra \leq 2.6 \times 10^5$ and
 $Q \leq 6.1009 \times 10^6$ (the highest
 $Ra$ and
 $Q$ achieved so far). The work aims to answer the following general questions.
(i) How do the flow structures in the convection cavity change under the influence of a horizontal magnetic field? Additionally, what is the impact of these structures on turbulent heat and momentum transport?
(ii) Under the influence of a magnetic field, is the skewed-varicose instability the intrinsic mechanism driving the phenomenon of reversed flow in a multiple roll system of Yang et al. (Reference Yang, Vogt and Eckert2021) and Vogt et al. (Reference Vogt, Yang, Schindler and Eckert2021)?
(iii) According to the findings of Vogt et al. (Reference Vogt, Ishimi, Yanagisawa, Tasaka, Sakuraba and Eckert2018), it is evident that with the enhancement of the magnetic field, the flow in the RBC thermal convection problem undergoes a transition from three dimensions to two as well. Therefore, is there also a cutoff frequency or length scale between quasi-2-D and three-dimensional (3-D) flow structures in magnetohydrodynamics (MHD) RBC turbulence, as predicted by Sommeria & Moreau (Reference Sommeria and Moreau1982) and found by Baker et al. (Reference Baker, Pothérat, Davoust and Debray2018) and Chen et al. (Reference Chen, Pothérat, Ni and Moreau2021) in MHD channel flows? And what kind of relationship exists between the cutoff frequency and the interaction parameter?
To the best of our knowledge, this study is the first to analyse turbulent RBC at high  $Q$, realistically low
 $Pr$, and a large aspect ratio
 $\varGamma =5$ in the framework of high-resolution DNS. The only related simulations have been performed by Lim et al. (Reference Lim, Chong, Ding and Xia2019) in a cubic convection cell at unrealistic
 $Pr=8$, with
 $Ra$ up to
 $10^{10}$, and
 $Q$ up to
 $6.4\times 10^5$, and by Akhmedagaev et al. (Reference Akhmedagaev, Zikanov, Krasnov and Schumacher2020b) in a cylindrical cavity with
 $\varGamma =1$ at
 $Pr=0.025$, with
 $Ra$ up to
 $10^{9}$, and
 $Q$ up to
 $1.96\times 10^6$, where axial magnetic fields are imposed.
2. Problem statement and formulation
We consider the flow of an incompressible, viscous, electrically conducting fluid (a liquid metal) with constant physical properties contained in a square vessel under a uniform horizontal magnetic field. The governing equations are made dimensionless by using the vessel's height  $H$, the free-fall velocity
 $U=\sqrt {g\alpha \,\Delta T\,H}$, the external magnetic field strength
 $B_0$, and the imposed temperature difference
 $\Delta T=T_{bottom}-T_{top}$ as the scales of length, velocity, magnetic field and temperature, respectively. The Boussinesq and quasi-static approximations are used. The equations are
 $$\begin{gather} \boldsymbol{\nabla}\boldsymbol{\cdot} {{\boldsymbol{u}}} = 0, \end{gather}$$
 $$\begin{gather}\frac{\partial {{\boldsymbol{u}}}}{\partial t} + ({{\boldsymbol{u}}} \boldsymbol{\cdot} \boldsymbol{\nabla}) {{\boldsymbol{u}}} =- \boldsymbol{\nabla} p + \sqrt{\frac{Pr}{Ra}}\left(\nabla^2 {{\boldsymbol{u}}} + \frac{Q}{\varGamma^2}\,(\,{{\boldsymbol{j}}} \times {{\boldsymbol{e}}}_b)\right) + T{{\boldsymbol{e}}}_z, \end{gather}$$
 $$\begin{gather}\frac{\partial T}{\partial t} + {{\boldsymbol{u}}} \boldsymbol{\cdot} \boldsymbol{\nabla} T = \frac{1}{\sqrt{Ra\,Pr}}\,\nabla^2 T, \end{gather}$$
 $$\begin{gather}{{\boldsymbol{j}}} =- \boldsymbol{\nabla} \phi + ({{\boldsymbol{u}}} \times {{\boldsymbol{e}}}_b), \end{gather}$$
 $$\begin{gather}\nabla^2 \phi = \boldsymbol{\nabla}\boldsymbol{\cdot}({{\boldsymbol{u}}} \times {{\boldsymbol{e}}}_b), \end{gather}$$
where  $p$,
 ${{\boldsymbol {u}}}$,
 $\phi$ and
 $T$ are the fields of pressure, velocity, electric potential and deviation of temperature from a reference value, and
 ${\boldsymbol {e}}_{b}$ is the unit vector in the direction of the imposed magnetic field
 ${\boldsymbol {B}}_{0}$. In the present study, the magnetic fields are paralleled with
 $y$-axial direction. The top and bottom walls are maintained at constant temperatures
 $T=-0.5$ and
 $T=0.5$, respectively. The lateral walls are thermally insulated, so having
 $\partial T/\partial n=0$. No-slip boundary conditions for velocity are applied at the walls. All walls are perfectly electrically insulated, which implies
 $\partial \phi /\partial n=0$.
The governing equations (2.1)–(2.5) are solved numerically using a second-order finite volume method on a non-uniform Cartesian mesh, discussed in detail in Chen et al. (Reference Chen, Pothérat, Ni and Moreau2021). Table 1 summarizes the most important parameters of our DNS runs, and reports the (turbulent) momentum transfer quantified by the Reynolds number  $Re=u_{rms}\sqrt {Ra/Pr}$ with root mean square velocity
 $u_{rms}=\sqrt { \langle u_x^2+u_y^2+u_z^2 \rangle _{V,t}}$ and (turbulent) heat transfer measured by the Nusselt number
 $Nu=1+\sqrt {Ra\,Pr}\, \langle u_zT \rangle _{V,t}$, where
 $\langle \cdot \rangle _{V,t}$ stands for volume and time averaging, respectively. The time averaging is performed over 40 convective time units. The values of
 $Re$ and
 $Nu$ of run 1 are comparable to those from Liu et al. (Reference Liu, Krasnov and Schumacher2018) for RBC in mercury at
 $Pr = 0.025$ in a closed square cell at
 $\varGamma = 4$, where
 $Nu= 9.75\pm 0.05$ and
 $Re = 7946 \pm 19$ are reported. We find that grids with
 $N_{x}\times N_{y}\times N_{z} =1536\times 1536\times 384$, and the points inside the boundary layers, are sufficient for non-magnetic/magnetic flows. Further refinement of the grid does not lead to significant changes. In addition, suppression of velocity gradients by the magnetic field allows us to alleviate the resolution requirements for the
 $x, z$ directions.
The grid sensitivity study for cases with  $Pr=0.033$,
 $Ra=10^{7}$ and
 $\varGamma =5$. The grid number inside the Hartmann layer with thickness
 $\delta _{Ha}$ is listed. For the case
 $Q=0$, the viscous boundary layer thickness
 $\delta _{v}$ is adopted instead of the Hartmann layer thickness. We use
 $N_{BL}$ to denote the number of the grid points within the boundary layer. The total runtime is scaled with the free-fall time,
 $t_{f} =H/U_{f}$.

In addition to the internal structure of the flow, four boundary layers need to be resolved accurately (Grossmann & Lohse Reference Grossmann and Lohse2001; Davidson Reference Davidson2002): the thermal boundary layer of thickness  $\delta _T \approx 1/(2Nu)$, the viscous boundary layer with
 $\delta _v \approx 1/(4\sqrt {Re})$, the Shercliff layer with
 $\delta _{Sh} \approx 1/\sqrt [4]{Q}$ at the lateral, top and bottom walls, and the Hartmann layer with
 $\delta _{Ha}=1/\sqrt {Q}$ at the walls perpendicular to the magnetic field. Therefore, coordinate transformation is applied for generation of a non-uniform grid (see Akhmedagaev et al. Reference Akhmedagaev, Zikanov, Krasnov and Schumacher2020a). In the present simulation, grids
 $512\times 512\times 128$,
 $1024\times 1024\times 256$,
 $1536\times 1536\times 384$, and the clustering parameter 2.0 (Akhmedagaev et al. Reference Akhmedagaev, Zikanov, Krasnov and Schumacher2020b) are applied for flows with
 $Q \leq 9 \times 10^4$ at
 $Ra=10^5$,
 $10^6$ and
 $10^7$, respectively. When the magnetic field is relatively strong,
 $Q > 9 \times 10^4$, taking into account the quasi-2-D character of the MHD flow (i.e. weak axial gradients of velocity in the core), we appropriately reduce the grid points in the direction of the magnetic field (but not less than
 $4/5$ of the original number), and the grid points in the Hartmann layer are no less than 10.
3. Results and discussion
3.1. Global heat and mass transfer
With the increasing of magnetic field imposed on RBC, the electromagnetic force gives rise to a transition from a 3-D convective roll pattern (called cell structures by Vogt et al. (Reference Vogt, Yang, Schindler and Eckert2021); see figure 1a) to a quasi-2-D flow pattern (see figure 1d) in a way that convective rolls become more and more aligned with the magnetic field (see figures 1b,c). Such an evolution has been observed already in the previous investigations by Burr & Müller (Reference Burr and Müller2002), Tasaka et al. (Reference Tasaka, Igaki, Yanagisawa, Vogt, Zuerner and Eckert2016) and Vogt et al. (Reference Vogt, Yang, Schindler and Eckert2021). Generally speaking, the quasi 2-D roll-like structure ensures a direct heat transfer between the bottom and the top, and extends the uniform bulk central region of the convection, thinning the thermal boundary layers and causing an increase of heat transfer coefficient for moderate  $Q$ as shown in figure 2(a).
The isosurfaces of  $\varOmega = 0.5$ are shown, coloured with vertical velocity
 $u_{z}$ for
 $Ra=1 \times 10^{6}$. The identified method of the vortex structures (
 $\varOmega$) applied here is defined by Liu et al. (Reference Liu, Wang, Yang and Duan2016). Isosurfaces are for (a)
 $Q/Ra=0$, (b)
 $Q/Ra=0.16$, (c)
 $Q/Ra=0.64$, and (d)
 $Q/Ra=2.25$.

(a) Relative deviations of the heat transfer from the reference state of RBC (without magnetic field),  $(Nu-Nu_{0})/Nu_{0}$, as a function of
 $Q$ for three different
 $Ra$ values. Data from Vogt et al. (Reference Vogt, Yang, Schindler and Eckert2021) are used for comparison. (b) The corresponding values of the compensated
 $Re$ number,
 $Re\,Pr/Ra^{2/3}$, plotted versus
 $Q$, where
 $Re$ from Yang et al. (Reference Yang, Vogt and Eckert2021) is based on
 $\max (u_{x})$. The
 $Q$ values in the simulation are listed in ascending order as follows:
 $2.5 \times 10^3$,
 $10^4$,
 $2.25\times 10^4$,
 $4\times 10^4$,
 $9\times 10^4$,
 $1.6\times 10^5$,
 $2.5\times 10^5$,
 $6.4\times 10^5$,
 $10^6$,
 $1.5625\times 10^6$,
 $2.25\times 10^6$,
 $3.0625\times 10^6$,
 $4\times 10^6$,
 $6.25\times 10^6$ and
 $9\times 10^6$.

However, prior to the augmentation of heat transfer, it is noteworthy that  $Nu$ exhibits a decline under relatively weak magnetic fields, particularly in cases of higher
 $Ra$, which is consistent with the findings of the experiments conducted by Burr & Müller (Reference Burr and Müller2002) and Vogt et al. (Reference Vogt, Yang, Schindler and Eckert2021). The reduction can be attributed to the suppression of small-scale convective vortices by the Lorentz force, which results in a decrease in the injection of plumes, the primary agents of heat transfer. It is also important to mention that
 $Re$ follows a similar trend to the Nusselt number with the increase of
 $Q$, indicating that convective heat conduction is always dominant within our parameter space. Moreover, this trend exhibits the intricate way in which a magnetic field affects a turbulent flow. For small
 $Q$, the velocity in the magnetic field is inhibited, and damping becomes the primary effect on flow, resulting in a decrease in
 $Re$. However, for moderate
 $Q$, the enhancement of flow perpendicular to the magnetic field dominates, leading to an increase in both
 $Nu$ and
 $Re$. This phenomenon has also been observed in duct flow (Sukoriansky, Zilberman & Branover Reference Sukoriansky, Zilberman and Branover1986; Zikanov et al. Reference Zikanov, Krasnov, Boeck and Sukoriansky2019), electromagnetically driven square cavity flow (Pothérat & Klein Reference Pothérat and Klein2017) and vertical convection flow in a square container under the influence of magnetic fields (Chen, Liu & Ni Reference Chen, Liu and Ni2018).
Furthermore, we note that  $Re\,Pr/Ra^{2/3}$ scales well with
 $Q^{-n}$ (
 $n=0.35$) for cases at sufficiently large
 $Q$, where quasi-2-D roll structures have been well developed. Now we incorporate Grossmann–Lohse (GL) theory (Grossmann & Lohse Reference Grossmann and Lohse2000) into the MHD-RBC flow, and provide an explanation for this scaling relationship. Regarding a regular flow, the GL theory takes into account the spatial- and time-averaged viscous and thermal dissipation rates,
 $\varepsilon _{\nu }$ and
 $\varepsilon _{\kappa }$, in convective heat transfer:
 $$\begin{gather} \varepsilon_{\nu} = \frac{\nu}{2}\,\langle(\partial_{i}u_{j} + \partial_{j}u_{i})^{2}\rangle, \end{gather}$$
 $$\begin{gather}\varepsilon_{\kappa} = \kappa \langle (\partial_{i}T)^{2} \rangle. \end{gather}$$
Here, the Einstein summation convention is used over the coordinates  $i, j=x, y, z$, and
 $\partial _{i} = \partial / \partial x_{i}$ is a short notation for the spatial partial derivatives.
As suggested by Zürner (Reference Zürner2020), under the influence of a magnetic field, the additional Joule dissipation rate
 \begin{equation} \varepsilon_{\eta} = \frac{\eta}{2}\,\langle(\partial_{i}b_{j} + \partial_{j}b_{i})^{2}\rangle \end{equation}
has to be considered. Here, the secondary magnetic field  ${{\boldsymbol {b}}} = b_i{{\boldsymbol {e}}}_i$ is induced by the interaction of
 ${{\boldsymbol {u}}}$ and the imposed magnetic field
 ${{\boldsymbol {B}}}_0$, and
 $\eta$ is the the magnetic diffusivity. When turbulence reaches a relatively steady state, the average dissipation rate satisfies the following rigorous relations, which are derivable easily from (2.2), (2.3), the transport equation for magnetic induction, and the definition of
 $Nu$ (see Shraiman & Siggia Reference Shraiman and Siggia1990; Chakraborty Reference Chakraborty2008; Zürner et al. Reference Zuerner, Liu, Krasnov and Schumacher2016):
 $$\begin{gather} \varepsilon_{\nu} + \frac{\varepsilon_{\eta}}{\mu \rho_{0}} = \frac{\nu^{3}}{H^{4}}\,\frac{(Nu-1)\,Ra}{Pr^{2}}, \end{gather}$$
 $$\begin{gather}\varepsilon_{\kappa} = \kappa\,\frac{(\Delta T)^{2}}{H^2}\,Nu, \end{gather}$$
where  $\mu$ represents the the magnetic permeability. Based on the GL theory, the contributions of the dissipation rate from the bulk region and the boundary layer are separated:
 $$\begin{gather} \varepsilon_{\nu} = \varepsilon_{\nu,Bulk} + \varepsilon_{\nu,BL}, \end{gather}$$
 $$\begin{gather}\varepsilon_{\eta} = \varepsilon_{\eta,Bulk} + \varepsilon_{\eta,BL}, \end{gather}$$
 $$\begin{gather}\varepsilon_{\kappa} = \kappa\,\frac{(\Delta T)^2}{{H}^2} + \varepsilon_{\kappa,Bulk} + \varepsilon_{\kappa,BL}. \end{gather}$$
Zürner (Reference Zürner2020) made estimates for the different terms in the above equations, based on the following assumptions: (1) the Prandtl number of liquid metals is sufficiently low,  $Pr\ll 1$; (2)
 $Q^{1/2}$ is sufficiently large, and the viscous boundary layers on the walls perpendicular to the magnetic fields are replaced by the Hartmann layer; (3) the magnetic Reynolds number is low enough,
 $Rm \ll 1$; and (4) additional regime transitions, e.g. transition concerning the onset of convection under the effects of magnetic fields. He obtained the following relationships:
 $$\begin{gather} \varepsilon_{\nu,Bulk} \sim \frac{{\nu}^{3}}{H^{4}}\,Re^{3}, \end{gather}$$
 $$\begin{gather}\varepsilon_{\nu,BL} \sim \frac{{\nu}^{3}}{H^{4}}\,Re^{2}\,Q^{1/2}, \end{gather}$$
 $$\begin{gather}\varepsilon_{\eta,Bulk} \sim \mu \rho_{0}\,\frac{{\nu}^{3}}{H^{4}}\,Re^{2}\,Q, \end{gather}$$
 $$\begin{gather}\varepsilon_{\eta,BL} \sim \mu \rho_{0}\,\frac{{\nu}^{3}}{H^{4}}\,Re^{2}\,Q^{3/2}, \end{gather}$$
 $$\begin{gather}\varepsilon_{\kappa,Bulk} \sim \kappa\,\frac{(\Delta T)^{2}}{H^{2}}\,Re\,Pr, \end{gather}$$
 $$\begin{gather}\varepsilon_{\kappa,BL} \sim \kappa\,\frac{(\Delta T)^{2}}{H^2}\,\sqrt{Re\,Pr}. \end{gather}$$
When  $N$ (
 $=Q/Re$) is large enough, the bulk flow region approaches a quasi-2-D state, where the viscous dissipation should be dominated by
 $\varepsilon _{\nu,BL}$. To substantiate this viewpoint more rigorously, we have tabulated the time-averaged values of viscous and Joule dissipation in the bulk flow and boundary layer regions, respectively, when
 $Ra=1\times 10^6$, as shown in table 2. It is worth noting that when considering dissipation, especially in the bulk flow region, forces other than the Lorentz force, such as the inertial force, must also be taken into account (Pothérat & Klein Reference Pothérat and Klein2017). Therefore,
 $N$ is used as a control parameter here. The results demonstrate strongly that when
 $N \geq 253.46$, the viscous dissipation in the bulk flow region is much smaller than that in the boundary layer, almost
 $\varepsilon _{\nu,Bulk}\approx 0.1\varepsilon _{\nu,BL}$. Therefore, it can be concluded that the main contribution to viscous dissipation comes from the boundary layer, i.e.
 $\varepsilon _{\nu } \sim \varepsilon _{\nu,BL}$. This approximation is evidently unsuitable for cases where
 $N$ is relatively small. For instance, when
 $N = 75.60$, the viscous dissipation in the bulk flow region is similar to that in the boundary layer. Meanwhile, the thermal dissipation for convective liquid metals with
 $Pr \ll 1$ satisfies
 $\varepsilon _{\kappa } \sim \varepsilon _{\kappa,BL}$.
Comparison of the volume- and time-averaged viscous dissipation  $\varepsilon _{\nu }$, the Joule dissipation rates
 $\varepsilon _{\eta }$, and the averaged number of the roll structures at
 $Ra=1\times 10^6$.

For the Joule dissipation, when the magnetic field is strong enough, it can be inferred from (3.11) and (3.12) that the contribution from the boundary layer should be greater than that from the bulk region. This phenomenon can be explained easily from a physical perspective. Under a strong magnetic field, the flow becomes more regular, and the Joule dissipation in the bulk region is small. The electric current concentrates mainly in the Hartmann layer, thus resulting in greater Joule dissipation in the boundary layer. The computational results also confirm this viewpoint. When the magnetic field is weak, such as  $N=75.60$,
 $174.69$ and
 $253.46$, the Joule dissipation in the bulk region is roughly equivalent to that in the boundary layer. However, as the magnetic field continues to increase and
 $N$ reaches
 $530.34$ and
 $1045.96$, the Joule dissipation in the bulk region is significantly lower than that in the boundary layer.
It is difficult to obtain the relative magnitudes of viscous dissipation and Joule dissipation from the approximate equations (3.9)–(3.12) under a strong magnetic field. Based on the calculation results, it can be observed that when the magnetic field is weak, such as  $N < 253.46$, the contributions of viscous dissipation and Joule dissipation are relatively close. When
 $N\geq 253.46$, viscous dissipation will be much greater than Joule dissipation, and as the magnetic field continues to increase, the difference between the two will become more significant. Therefore, under a strong magnetic field, we can conclude that
 \begin{equation} \varepsilon_{\nu}+ \varepsilon_{\eta}\sim \varepsilon_{\nu} \sim \varepsilon_{\nu,BL}. \end{equation}
From this, it can be derived that the momentum dissipation (including both the viscous dissipation and Joule dissipation) and thermal dissipation for  $Pr \ll 1$ (Grossmann & Lohse Reference Grossmann and Lohse2000) satisfy approximately
 $$\begin{gather} \frac{(Nu-1)\,Ra}{Pr^{2}} \sim Re^{2}\,Q^{1/2}, \end{gather}$$
 $$\begin{gather}Nu-1 \sim \sqrt{Re\,Pr}. \end{gather}$$
Regarding the flow of liquid metal studied in this paper, with  $Pr$ being unchanged, it can be obtained that
 \begin{equation} (\sqrt{Re\,Pr})Ra \sim Re^{2}\,Q^{1/2} \rightarrow Re\,Pr/Ra^{2/3} \sim Q^{-1/3}. \end{equation}
As shown in figure 2(b), the numerical results exhibit a scaling law of 0.35 for cases at different  $Ra$, which agrees well with the derived scaling law of
 $1/3$.
3.2. Flow reversal and turbulence intermittency
The phenomenon of flow reversal, which was observed previously in experimental studies at  $Ra\sim 10^5$ (Yanagisawa et al. Reference Yanagisawa, Yamagishi, Hamano, Tasaka and Takeda2011, Reference Yanagisawa, Hamano, Miyagoshi, Yamagishi, Tasaka and Takeda2013) and numerical studies at
 $Ra \leq 10^6$ (Vogt et al. Reference Vogt, Ishimi, Yanagisawa, Tasaka, Sakuraba and Eckert2018; Liu Reference Liu2019), has been rediscovered in the present work at
 $Ra=10^7$ with a larger aspect ratio
 $\varGamma =5$. Our investigations have revealed that this reversal phenomenon is an inherent characteristic of MHD-RBC flows, and is associated with specific parameter combinations. Furthermore, we intend to provide a detailed depiction of the evolution process of flow reversals based on the integrated kinetic energy equation
 \begin{equation} \dfrac{{\rm d}}{{\rm d}t}\int\dfrac{u^{2}}{2}\,{\rm d}V =-\int\varepsilon_{\nu} \,{\rm d}V-\int\varepsilon_{\eta} \,{\rm d}V+\int u_{z}T \,{\rm d}V, \end{equation}
where  $V$ represents the entire domain. Presented here are the developments in the flow field resulting from a singular flow reversal procedure, as well as the subsequent evolutions of the kinetic energy
 $u^{2}$, with regard to
 $u_{x}^{2}$,
 $u_{y}^{2}$ and
 $u_{z}^{2}$, the rate of viscous dissipation
 $\varepsilon _{\nu }$, the rate of Joule dissipation
 $\varepsilon _{\eta }$, and the thermal flux
 $u_{z}T$.
The exemplification of temporal progression manifests in figures 3 and 4, where turbulent bursts alternate with periods of quasi-2-D behaviour. As delineated in figure 4(a), the nascent phase ( $t_{1}$) manifests as quasi-2-D, comprising four quasi-2-D rolls labelled as 1, 2, 3 and 4, correspondingly. At this juncture, the vertical energy diminishes substantially but does not reach null, while the energy within the plane perpendicular to the magnetic field attains its zenith, illustrated in figure 3(c). Progressing from time
 $t_{1}$ to
 $t_{2}$, the rolls undergo curvature where the latter halves of rolls 1 and 2 contract, whereas rolls 3 and 4 expand, exhibiting an evolution contrary to that near the frontal wall. Throughout this process, depicted in figure 3, both
 $u^{2}_{y}$ and the Joule dissipation
 $\varepsilon _{\eta }$ escalate, reaching their peak at
 $t_{2}$, signifying that the restoration of 3-D turbulent flow occurs. Following this, from
 $t_{2}$ to
 $t_{3}$, as the rolls persist in their curvature, rolls 5 and 6 materialize at the extremities of the vessel, as portrayed in figure 4(c), while the roll-like configurations adjacent to the remaining corners almost dissipate. Concurrently, rolls 2 and 3 undergo displacement in the centre (refer to figure 4). During this phase,
 $u^{2}_{y}$ declines, and the predominant contributions of kinetic energy,
 $u^{2}_{x}$ and
 $u^{2}_{z}$, also dwindle further as
 $\varepsilon _{\nu }+\varepsilon _{\eta }$ continues to surpass
 $u_{z}T$. When the intersection of
 $\varepsilon _{\nu }+\varepsilon _{\eta }$ with
 $u_{z}T$ occurs at
 $t_{3}$,
 $u^{2}_{x}$ and
 $u^{2}_{z}$ attain their minimum values.
Results for  $Q=2.25\times 10^6$,
 $Ra=1 \times 10^{7}$. (a) Time-space maps of vertical velocity along line
 $(2.5,y,0.75)$. (b) Time variations of energy
 $u_{x}^{2}$,
 $u_{y}^{2}$,
 $u_{z}^{2}$. (c) Time variations of the volume-averaged heat transport
 $u_{z}T$, viscous dissipation rate
 $\varepsilon _{\nu }$, and Joule dissipation rate
 $\varepsilon _{\eta }$.

Flow evolution during one reversal procedure with  $Q=2.25\times 10^6$,
 $Ra=1 \times 10^{7}$. Six snapshots are shown, denoted by the six vertical dashed lines in figure 3. The streamlines of 3-D velocity field are coloured with vertical velocity: red for upwards motion, and blue for downwards motion.

From the interval between  $t_{3}$ and
 $t_{5}$, the fragmented convection rolls begin a process of reintegration. Roll 5, newly formed, inclines towards the posterior section of roll 2, while the leading half of roll 3 appears to merge with the recently generated roll 6. Within the central zone, the trailing half of roll 3 endeavours to connect with the leading half of roll 1, while the frontal section of roll 2 seeks to bond with the rear part of roll 4. Throughout this phase, the magnitude of
 $u_{z}T$ surpasses that of
 $\varepsilon _{\nu }+\varepsilon _{\eta }$, consequently initiating an ascent in both
 $u_{x}^{2}$ and
 $u_{z}^{2}$. As alignment between the rolls and the magnetic field occurs at
 $t_{4}$, the values of
 $u_{y}^{2}$ and
 $\varepsilon _{\nu }+\varepsilon _{\eta }$ descend to their minimal levels. By
 $t_{6}$,
 $\varepsilon _{\nu }+\varepsilon _{\eta }$ exceeds
 $u_{z}T$, leading to a surge in
 $u_{x}^{2}$ and
 $u_{z}^{2}$. A novel quasi-2-D structure emerges, comprising four rolls rotating in the opposite direction to those observed at
 $t_{1}$.
Let us now examine the possible physical mechanisms of flow reversal, i.e. the skewed-varicose instability. As mentioned by Greenside, Cross & Coughran (Reference Greenside, Cross and Coughran1988) and Busse, Kropp & Zaks (Reference Busse, Kropp and Zaks1992), the skewed-varicose instability is crucial for understanding the transition of fluid from small to medium  $Pr$ (
 $Pr\leq 1$) towards chaos. One of its key elements is the mean flow, which refers to the flow with a larger length scale compared to the wavelength of convective eddies. Yanagisawa et al. (Reference Yanagisawa, Hamano, Miyagoshi, Yamagishi, Tasaka and Takeda2013, Reference Yanagisawa, Hamano and Sakuraba2015) and Vogt et al. (Reference Vogt, Ishimi, Yanagisawa, Tasaka, Sakuraba and Eckert2018) explained the process of flow reversals in RBC as the creation of new rolls and the following skewed-varicose instability (instability in both directions perpendicular and parallel to the axis of roll). In this process, the horizontal circulation plays an important role, which can be quantified by introducing the global angular momentum. For our research, the global angular momentum along the
 $z$ direction around the centre point
 $C(x_c, y_c, z_c)$ of the container can well reflect the mean flow. This is defined as
 $L(z) = \langle (x-x_c)u_y-(y-y_c)u_x \rangle _{V}$, where the brackets denote the spatial average.
Upon examining figure 5, it is apparent that under the condition  $Ra=1\times 10^6$, when
 $Q=2.5\times 10^5$, the flow pattern exhibits an irregular three-roll structure, accompanied by a flow reversal. When
 $Q=6.4\times 10^5$, the flow displays a relatively regular four-roll structure, with a flow reversal occurring periodically. Conversely, when
 $Q=2.25\times 10^6$, the flow maintains a stable five-roll structure, without any instances of reversal, as shown in figure 1(d). Figure 6 illustrates the global angular momentum
 $L(z)$ corresponding to these three conditions. When
 $Q=2.5\times 10^5$, the global angular momentum
 $L(z)$ reaches its peaks at
 $t=176$ and
 $t=221$, respectively, and these peaks are greater than those observed under
 $Q=6.4\times 10^5$. However, as shown in figure 5, the flow does not undergo a rapid reversal after these two peaks, but rather gradually reverses at
 $t=230$. In contrast, for
 $Q=6.4\times 10^5$, the flow experiences rapid reversals after the global angular momentum
 $L(z)$ reaches its peaks at
 $t=46$,
 $102$,
 $160$ and
 $220$. It is worth noting that a change in the direction of flow does not necessarily imply a change in the sign of the global angular momentum. The two are not directly related, as both positive and negative global angular momentum can lead to the same result in terms of flow reversal. When
 $Q=2.25\times 10^6$, the flow does not undergo any reversal, resulting in the global angular momentum
 $L(z)$ almost entirely equalling 0. Therefore, the global angular momentum
 $L(z)$, which reflects the mean horizontal circulation, can explain to some extent the occurrence of a flow reversal. Additionally, when the magnetic field is weak, the many small-scale, 3-D vortices attached to the primary convective roll contribute to an increase in the global mean horizontal circulation. As a result,
 $L(z)$ becomes less useful in explaining a flow reversal under these conditions.
Time–space maps of vertical velocity along line  $(2.5,y,0.75)$ for the case with
 $Ra=1\times 10^6$ and (a)
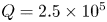 $Q=2.5\times 10^5$, (b)
 $Q=6.4\times 10^5$.

Global angular momentum  $L(z)$ along the
 $z$ direction at the central point of the vessel for three typical flow regimes with
 $Ra=1\times 10^6$ and
 $Q=2.5\times 10^5$,
 $6.4\times 10^5$,
 $2.25\times 10^6$.

In fact, it is not difficult to observe that this periodic reversal bears resemblance to the large-scale temporal intermittency observed in channel flow with a spanwise magnetic field (Boeck et al. Reference Boeck, Krasnov, Thess and Zikanov2008), forced turbulence in a periodic box (Zikanov & Thess Reference Zikanov and Thess1998), and inviscid flow in a triaxial ellipsoid (Thess & Zikanov Reference Thess and Zikanov2007). In these cases, the flows experience prolonged periods of nearly steady laminar states, punctuated by brief turbulent bursts. And the typical duration of the large-scale intermittent cycle is linked intricately to both driving strength and magnetic field intensity. The evolution of all the phenomena also appears to be analogous. When  $Q$ is moderate, the magnetic field is not potent enough to suppress 3-D secondary instabilities, but is strong enough to impede their transition to fully developed turbulence. After a brief outburst, the flow reverts to a nearly laminar base state, where the Joule dissipation is low, and instabilities can subsist. However, with increasing
 $Q$, the strength of the turbulent burst diminishes, and the duration of the instability growth phase extends, resulting in a longer reversal period.
3.3. Three-dimensionality
As described above, a horizontal magnetic field of sufficient strength can convert convective motion into quasi-2-D rolls that align parallel to the magnetic field. Additionally, the derivation of the scaling relationship for the cutoff frequency  $f_{c}$ (or cutoff length scale) that distinguishes high-frequency fluctuations in three dimensions from low-frequency fluctuations in two dimensions relies solely on the true interaction parameter Sommeria & Moreau (Reference Sommeria and Moreau1982). Hence we expect the scaling law between the interaction parameter and cutoff frequency to apply in the case of turbulent thermal convection influenced by a horizontal magnetic field, as observed in turbulence with a strong background flow (Klein & Pothérat Reference Klein and Pothérat2010; Pothérat & Klein Reference Pothérat and Klein2014; Baker et al. Reference Baker, Pothérat, Davoust and Debray2018) and shear turbulence (Chen et al. Reference Chen, Pothérat, Ni and Moreau2021).
Figures 7(c–f) display pairs of spectra obtained by applying different filter frequencies to the frontal velocity signal. It is noteworthy that, according to the discussion of Kumar & Verma (Reference Kumar and Verma2018), the Taylor assumption is applicable to turbulent convection. The original signals were collected at positions on the Hartmann walls that aligned precisely with the magnetic field lines (i.e. at  $y=0$ and
 $y=\varGamma$) but at the same coordinates
 $(x,z)$, and the probes were located in the central square region to minimize the influence of the sidewalls. Moreover, it should be noted that only the velocity signals recorded by probes positioned in the middle region of adjacent convection rolls are utilized. In the case where
 $Ra=10^6$ and
 $Q=2 \times 10^5$, the frontal and back spectra are partially identical in figure 7(c), which is expected since the flow tends to exhibit quasi-2-D behaviour at most scales. However, the spectra differ significantly at higher frequencies, indicating that small-scale structures are more sensitive to three-dimensionality. As
 $Q$ decreases (with
 $Ra$ fixed), the frequency range affected by three-dimensionality extends to lower frequencies, eventually contaminating the entire spectrum at the lowest
 $Q$ values (e.g.
 $Q=0$). By comparing pairs of spectra, the theory of Sommeria & Moreau (Reference Sommeria and Moreau1982) and experiments conducted by Baker et al. (Reference Baker, Pothérat, Davoust and Debray2018) have identified a cutoff length scale
 $k_{c}$ (corresponding to
 $f_{c}$) that separates quasi-2-D structures from 3-D structures.
(a) Variations of partial correlation  $c(\,f)$ with the cutoff frequency of filter
 $\mathscr {B}_{f}$ applied to the velocity signal measured at the frontal wall. Curves are obtained for
 $Ra =10^{6}$ and
 $Q=2 \times 10^{5}$ for a pair of probes within the centre square. Curves obtained for different parameters exhibit the same features. (b) The cutoff frequency
 $f_{c}$, separating quasi-2-D large structures from the small 3-D ones with the interaction parameter
 $N$. (c–f) Power spectral density (PSD) of the filtered frontal and back signals plotted in terms of the frequency.

Here, we applied a partial correlation function between signals on the front and back Hartmann walls (see Pothérat & Klein Reference Pothérat and Klein2014) to quantify the variation of  $f_{c}$ with
 $N$ (
 $=Q/Re$):
 \begin{equation} c(\,f)= \dfrac{\sum_{t=0}^{Ti} \mathscr{B}_{f}\,u_{front}(t)\,u_{back}(t)}{\sqrt{\sum_{t=0}^{Ti} \mathscr{B}_{f}\,u^{2}_{front}(t)\,u^{2}_{back}(t)}}. \end{equation}
Here, Ti is the duration of the recorded signals. The signal obtained from the frontal wall is replaced with a filtered counterpart, processed through an eighth-order low-pass filter of cutoff frequency denoted as  $\mathscr {B}_{f}\,u_{front}$, as shown in figure 7(a). Generally, the large frequency displayed in the spectrum corresponds to a small flow structure in physical space. As the filter frequency
 $f$ is increased from 0, more and more fluctuation scales are added to the filtered frontal signal, resulting in better correlation with the back signal in the quasi-2-D flow field. However, when
 $f$ is increased beyond a critical value
 $f_{c}$ (refer to figure 7f), the small scales, where three-dimensionality is still present, will disrupt the correlation between the two signals, leading to a decrease in
 $c(\,f)$. Hence the position of the maximum
 $f_{c}$ provides an excellent measure of the separation between large-scale 2-D structure and small-scale 3-D structure.
Figure 7(b) depicts the variations of the spatially averaged cutoff frequency  $f_{c}$ with
 $N$, indicating that the changes in
 $f_{c}$ for all the analysed cases converge onto a single curve. This result implies that
 $f_{c}$ follows a scaling law that is determined by
 $N$:
 \begin{equation} f_{c} \sim N^{0.36}. \end{equation}
This general scaling law provides a precise estimate for the minimum frequency of vortices that are influenced by 3-D inertial effects. Thus, similar to shear turbulence or turbulence with a strong background flow, the MHD-RBC turbulence also exhibits the same scaling law for the cutoff frequency  $f_{c}$ (Klein & Pothérat Reference Klein and Pothérat2010; Pothérat & Klein Reference Pothérat and Klein2014; Baker et al. Reference Baker, Pothérat, Davoust and Debray2018).
4. Concluding remarks
The present study reports 3-D DNS of magnetoconvection in a cuboid vessel under the influence of an external horizontal magnetic field. The range of high  $Ra$ and
 $Q$ never previously explored in numerical simulations is considered.
The results of our DNS are consistent with available experimental and numerical data. In particular, we find a new regime where  $Nu$ and
 $Re$ reduce with
 $Q$ in flows with weak magnetic fields before the heat transfer enhancement region, demonstrating that this interesting phenomenon is not caused by experimental errors (observed in Burr & Müller Reference Burr and Müller2002; Vogt et al. Reference Vogt, Yang, Schindler and Eckert2021). The similar variation trend in
 $Nu$ and
 $Re$ indicates the strong correlation between heat transfer and momentum transfer. In other words, under a weak magnetic field, the small-scale 3-D vortex structures are inhibited by the Lorentz force, resulting in a decrease in the injection of plumes. These plumes are the main carriers of heat, thus as
 $Re$ decreases,
 $Nu$ decreases accordingly.
As the magnetic field strength increases, the flow gradually reaches a quasi-two- dimensional (quasi-2-D) state. At this point, numerical results show that there is a  $-1/3$ scaling relationship between
 $Re$ and
 $Q$. To better explain this scaling rate, we introduce GL theory into the MHD thermal convection, and use numerical results combined with physical analysis to compare the orders of magnitude of viscous dissipation in the bulk flow region, viscous dissipation within the boundary layer, Joule dissipation in the bulk flow region, and Joule dissipation within the boundary layer, respectively. It is found that under strong magnetic effects, viscous dissipation plays an overwhelmingly dominant role compared to Joule dissipation, and the viscous dissipation within the boundary layer is also much greater than that in the bulk flow region. Therefore, the energy dissipation of the system comes mainly from the viscous dissipation within the boundary layer, i.e.
 $\varepsilon _{\nu }+ \varepsilon _{\eta }\sim \varepsilon _{\nu } \sim \varepsilon _{\nu,BL}$. Combining the heat transfer characteristics under a low
 $Pr$, we obtain the relationship between heat transfer efficiency and
 $Re$, and thus derive the
 $Re \sim Q^{-1/3}$ relationship of the system under strong magnetic fields, which well validates the numerical results.
As for the flow reversal phenomenon observed frequently in liquid metal experiments, we have conducted mechanistic analysis from the method of skewed-varicose instability. For the skewed-varicose instability, the mean horizontal circulation is the most critical influencing factor, which can be measured by the vertical global angular momentum. Our results indicate that the global angular momentum is more suitable for explaining the regular flow reversal phenomenon. For more chaotic flow reversal phenomena, the global angular momentum cannot reflect the evolution process of flow reversal very well. Indeed, the global angular momentum is greatly influenced by the walls of the container, such as the axial secondary flow caused by the Ekman effect. Therefore, setting the remaining walls, except for the top and bottom plates, as periodic boundaries to observe if the flow reversal phenomenon persists might offer a clearer explanation.
In the meantime, the three-dimensionality is characterized locally by analysing the frequency spectra of the velocity signals near the two Hartmann walls. As predicted by Sommeria & Moreau (Reference Sommeria and Moreau1982), the cutoff frequency  $f_{c}$ is in accordance with
 ${\sim }N^{0.36}$, indicating the existence of a cutoff frequency that separates 3-D and quasi-2-D turbulent structures in MHD-RBC turbulence, besides the turbulence with a strong background flow (see Baker et al. Reference Baker, Pothérat, Davoust and Debray2018) and shear turbulence (see Chen et al. Reference Chen, Pothérat, Ni and Moreau2021), which corresponds to the cutoff wavelength scaling predicted by Sommeria & Moreau (Reference Sommeria and Moreau1982).
Funding
The authors acknowledge support from the NSFC under grant nos 51927812 and 52076204. The authors also appreciate the anonymous reviewers for their comments, which improved the manuscript significantly.
Declaration of interests
The authors report no conflict of interest.



