

In June of 2015, Lars Løkke Rasmussen, the leader of the Venstre party, announced the formation of a single-party minority government in Denmark. Denmark is situated in the upper ranks of global tables for women's legislative representation and routinely registers as one of the best places in the world to live as a woman. Rasmussen's seventeen-member cabinet, however, had only five women. The new Venstre cabinet was markedly less gender balanced than the 179-member Folketing that Danish citizens had just elected. But the fact that the Venstre government was dominated by men was not entirely surprising, as Venstre's party delegation in the Folketing had similar levels of women's representation.
This paper seeks to gauge the extent to which the pattern observed in Rasmussen's cabinet represents a generalizable relationship between women's representation in legislative party delegations and women's representation in the cabinet. In investigating the possible links between parliamentary and cabinet math, we work within the tradition of William Gamson (Reference Gamson1961), who identified a strong correlation, across parliamentary systems, between the proportion of legislative seats a party contributes to a governing coalition and the proportion of portfolios the party receives in the cabinet. Gamson's law has been described as “one of the strongest empirical relationships documented in the social sciences” (Laver and Schofield Reference Laver and Schofield1990, 171). Here, we attempt to gender Gamson's law by arguing that the politicians who form cabinets do not simply base decisions about cabinet seat apportionment on parliamentary math. In addition, we suggest, the weight that top politicians assign to gender as a representative characteristic for their cabinet teams depends upon the gender composition of governing parties’ parliamentary delegations.
To date, scholars have not been able to investigate the relationship between women's legislative seats shares and women's cabinet seats because of data limitations. This article draws, therefore, on a new dataset covering 18 OECD parliamentary systems from 1990 through early 2019. Like other recent studies (e.g., Annesley Reference Annesley2015; Annesley, Beckwith, and Franceschet Reference Annesley, Beckwith and Franceschet2019; Goddard Reference Goddard2019), we examine the ways that gender and partisanship interact in cabinet formation processes. We focus on the relationship between women's representation in parliamentary parties and women's representation in the cabinets those parties create. We argue that there is a relationship between the gender composition of seats controlled by governing parties and the gender composition of the cabinets those parties create. Scholars have frequently observed an association between the share of seats that women control in the legislature as a whole and the share of seats that women control in the cabinet. If 24% of a country's legislators are women, for example, then about 24% of the country's ministers will be women. We argue, however, that the mechanism running from legislators to cabinet members runs through parliamentary parties. Specifically, we argue that the gendered Gamson's percentage—the percentage of seats that women control among the set of legislators from the party or parties that support a government—affects the appointment decisions of cabinet selectors and, thereby, the gender composition of the cabinet.
After establishing the theoretical foundations for this idea and providing an overview of our data, methods, and research strategy, we outline descriptive trends and move toward explanation of variation. Consistent with our theoretical expectations, we find a strong relationship between the gendered composition of governing parties’ parliamentary delegations and the percentage of cabinet seats that women control. Our findings suggest that in the process of selecting cabinet members, party leaders take both partisan and gender cues from the legislative delegation/s of government-supporting parties.
PARTIES, CABINETS, AND GENDER IN PARLIAMENTARY SYSTEMS
The idea that parliamentary math will be mirrored in cabinet math has a venerable history. The logic behind the idea traces to William Gamson (Reference Gamson1961), whose abstract surmise has been tested empirically in a number of settings throughout the years. Political scientists who have built on Gamson's foundations start with the assumption that political parties are the relevant participants in the bargaining scenarios that surround coalition formation. Gamson was concerned with the payoffs that participants receive as a result of coalition negotiations. He proposed that in any coalition negotiation process, a “participant will expect others to demand from [the] coalition a share of the payoff proportional to the amount of resources which they contribute to [the] coalition” (Gamson Reference Gamson1961, 376). In the context of multi-party negotiations over cabinet composition, each party's payoff is the proportion of total cabinet seats it receives. Resources, in turn, are the proportion of legislative seats that each party contributes to the coalition's total sum of legislative seats. Warwick and Druckman (Reference Warwick and Druckman2001, 627) succinctly summarize Gamson's law: “parties in a governing coalition tend to receive portfolios in one-to-one proportion to the amount of legislative support they contribute to the coalition.”
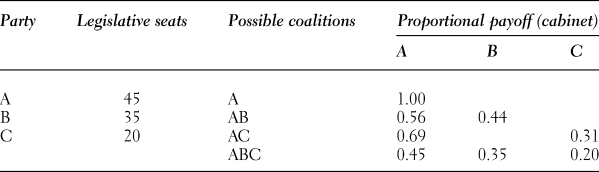
Table 1, which comes directly from Browne and Franklin's (Reference Browne and Franklin1973, 457) pioneering empirical study of Gamson's law, helps us to visualize Gamson's logic. The table assumes a parliamentary form of government and asks us to imagine a legislature that contains 100 members from three parties—A (45 seats), B (35), and C (20). There are seven possible governments that can come out of this scenario. Three of the seven governments (A, B, C) will be single-party minority governments; three others (AB, AC, BC) will be minimum-winning coalitions; and ABC will be a surplus majority coalition. In real-world scenarios characterized by a different number of parliamentary parties and/or different distributions of legislative seats, there will be other possibilities, e.g., single-party majority governments and/or minority coalition governments.
Gamson's Partisan Proportionality Proposition

For the sake of simplicity, Table 1 presents four of the seven possible cabinets in the example sketched above—A; AB; AC; and ABC. In Browne and Franklin's words (Reference Browne and Franklin1973, 457), Gamson's law predicts that “the percentage share of ministries received by a party participating in a governing coalition and the percentage share of that party's coalition seats will be proportional on a one-to-one basis.” Thus, if A is the only party in government, A will control about 100% of the seats in the cabinet. If A forms a coalition with B, then A will control about 56% [45/(45 + 35)] of cabinet seats, and B will control about 44% [35/(45 + 35)] of the seats. And so on.
Browne and Franklin (Reference Browne and Franklin1973) conducted the first empirical and cross-national test of Gamson's logic in the context of coalition cabinets. Drawing on data from thirteen European parliamentary democracies between 1945 and 1969, they discovered a strong correlation (r = 0.926) between the percentage of legislative seats controlled by coalition partners and the percentage of cabinet seats each partner receives from cabinet negotiations. They found that 85.5% of the variance in the percentage of seats a party receives in the cabinet was explained by the percentage of legislative seats the party contributed to the legislative coalition. While subsequent generations of scholars have tested Gamson's logic in different ways (e.g., by taking into account the visibility/prestige/power of particular ministerial portfolios), Browne and Franklin's key finding has stood up well across a variety of contexts (Browne and Frendreis Reference Browne and Frendreis1980; Bucur Reference Bucur2018; Carroll and Cox Reference Carroll and Cox2007; Cutler et al. Reference Cutler, De Marchi, Gallop, Hollenbach, Laver and Orlowski2016; Druckman and Roberts Reference Druckman and Roberts2005; Falcó-Gimeno and Indridason Reference Falcó-Gimeno and Indridason2013; Laver Reference Laver1998; Schofield and Laver Reference Schofield and Laver1985; Warwick and Druckman Reference Warwick and Druckman2001).
While Gamson's law goes a long way toward explaining party seat shares in coalition contexts, we begin by stressing that cabinet formation is about more than party seats shares—it is also about which individuals ultimately receive cabinet seats. In proposing to gender Gamson's law, we are not suggesting that analysts expand their conception of cabinet formation participants. Party leaders remain the principal negotiators. They seek to assure that the distribution of seats accurately reflects the resources (legislative seats) that they bring to the process. We are proposing, rather, that party leaders are additionally concerned with which individuals fill cabinet seats and that they pay attention to gendered parliamentary arithmetic when deciding which individuals should fill those seats.
In this sense, we can view cabinet formation as involving two steps. In the first step, which Gamson discusses, principals decide how many cabinet positions will exist and how (in the case of coalition governments) the total number of seats will be shared. In the second step, which we prioritize, principals decide which specific individuals will take cabinet seats. The two steps are distinctive but involve a common point of reference: in both, characteristics of parties’ legislative delegations guide principals’ decisions.
In focusing on the second step, we draw from the expanding literature on gender in cabinets, which stresses that, regardless of government type (e.g., single-party, minimum-winning coalition, or otherwise), cabinets are key sites of political representation (Annesley, Beckwith, and Franceschet Reference Annesley, Beckwith and Franceschet2019; Claveria Reference Claveria2014; Jacob, Adams, and Scherpereel Reference Jacob, Scherpereel and Adams2014; Krook and O'Brien Reference Krook and O'Brien2012). The literature stresses, more specifically, that when party leaders assemble cabinets, they pay attention to a range of issues beyond whether participating parties receive a fair share of cabinet seats. Annesley, Beckwith, and Franceschet (Reference Annesley, Beckwith and Franceschet2019, 96), for example, stress that the selectors who, after elections, are in charge of constructing cabinets, see those cabinets as collective teams. They approach the project of who will sit in the cabinet with “a checklist of characteristics that must be present in the team. These characteristics apply to the collective cabinet, not to individual cabinet ministers.” The authors suggest that the characteristics that appear on party leaders’ checklists vary across space and time but that such characteristics generally fall within one of three categories: experiential (e.g., the extent to which members of the team possess expertise in specific policy areas), affiliational (e.g., the extent to which members of the team have personal relationships with the head of government and/or other party leaders), and representational (e.g., the extent to which members of the team represent specific parties, genders, geographic divisions, races, religious groups, social classes, and/or other relevant categories).
The notion that gender is a relevant representational characteristic in the context of cabinet formation has been reinforced by developments that have transpired over the course of the last half century (Krook and True Reference Krook and True2012; Paxton and Hughes Reference Paxton and Hughes2015). The 1975 Mexico City World Plan of Action, for example, called on governments to develop systematic strategies for increasing women's participation in elective and appointed offices by 1985. Subsequent decennial UN conferences (Nairobi 1985, Beijing 1995) reinforced and refined the emergent gender-balanced decision-making norm. The Beijing Platform for Action, for example, encouraged all UN states to achieve 30% women in decision-making posts. The last thirty years have also witnessed widespread experimentation, across a diverse range of countries, with quotas designed to increase women's representation in legislative office (Krook Reference Krook2009) and on corporate boards (Hughes, Paxton, and Krook Reference Hughes, Paxton and Krook2017). More recently, a number of nation-states (e.g., Niger) and sub-national bodies (e.g., various Spanish autonomous communities) have established gender quotas at the cabinet level, and sizeable political parties/alliances (e.g., the Left alliance in Poland, 2019) have campaigned on the idea of establishing cabinet quotas. Heads of government in an increasing number of states—Albania (2017), Bolivia (2010), Bulgaria (2016), Canada (2015), Cabo Verde (2014), Chile (2006), Colombia (2018), Costa Rica (2018), Ethiopia (2018), Finland (2007), France (2012), Grenada (2018), Iceland (2009), Liechtenstein (2014), Mexico (2018), Nicaragua (2017), Norway (2013), Rwanda (2018), Seychelles (2018), Slovenia (2017), South Africa (2019), Spain (2004), and Sweden (1994)—have established parity or majority-women cabinets, and their efforts have received widespread international attention.Footnote 1 It is now rare, anywhere on earth, for a newly established executive leadership team not to be viewed through a gendered lens: “family photos” posted when cabinets take office become powerful symbolic representations of government leaders’ understandings of and sensitivity to gender concerns.
Taken together, these developments have had uneven effects across contexts and actors. In general, though, they have increased the relevance of gender as a representational characteristic—as a factor that matters to the principals who construct cabinet teams. We expect that this context—where party leaders are accustomed to consulting parliamentary delegational arithmetic and where domestic and international audiences are stressing gender as a representational category—affects party leaders’ approaches to step two of the cabinet formation process.
We suggest that parliamentary systems of legislative-executive relations provide the most appropriate setting for determining whether and how intersections between gender and partisanship unfold. Parliamentary systems are defined by a fusion of legislative and executive functions. Cabinets in parliamentary governments can only begin operating once a sufficient number of members of parliament have recognized their legitimacy. In this setting, we expect the party leaders who participate in the cabinet formation process to pay particular attention to the gendered personnel composition of party delegations in the legislature. We expect them to obey a gendered Gamson's logic.
Before specifying what precisely we mean by a gendered Gamson's logic, it is important to note that we are slightly adjusting the focus that is common in the Gamson's law literature—not just by prioritizing step two but also by considering single-party cabinets alongside coalition cabinets. Our basic idea—that the principals who fill cabinet slots attend to the gendered composition of parliamentary delegations—can pertain under conditions of both single-party and coalition government. Regardless of the partisan composition of a cabinet, principals’ appointment decisions will have a gender component. For the reasons discussed above, we expect that all principals will be aware of the gender-dimension of their appointment decisions.
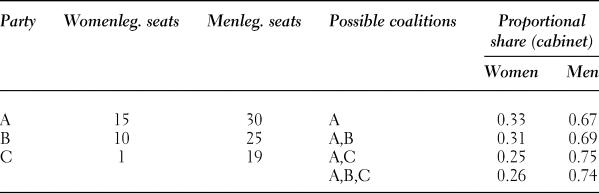
Table 2 transforms the (step one-focused) Gamson's logic presented in Table 1 into a (step-two focused) gendered Gamson's logic. The structural (parliamentary system; 100-seat legislature) and partisan (A has 45 seats; B has 35; C has 20) components of the example scenario remain the same, but Table 2 also considers the number of seats controlled by women and men among each party's parliamentary delegation. In gendering Gamson's law, we propose that the percentage share of cabinet seats received by women participating in a cabinet and the percentage share of legislative seats held by legislators from members of the governing party or parties will be proportional on a (roughly) one-to-one basis.
Gamson's Gender Proportionality Proposition

Under the conditions foreseen in Table 2, if party A forms a single-party minority government, roughly 33.3% [15/(15 + 30)] of the cabinet seats will be occupied by women, and approximately 66.7% of the seats will be occupied by men. If parties A and B establish a coalition, women will control roughly 31% {(15 + 10)/[(15 + 30)+(10 + 25)]} of cabinet seats, and men will control approximately 69% of the seats. If A forms a coalition with C—which is this legislature's least gender-balanced party—we expect the resulting cabinet to be comprised of about 25% women {(15 + 1)/[(15 + 30)+(1 + 19)]} and 75% men.
These considerations inform the paper's guiding hypothesis:
H1: There will be a close association between the percentage of seats that women contribute to a governing party's (or governing parties’) parliamentary delegation/s and the percentage of cabinet seats that women control in the country's cabinet.
Existing literature on gender and cabinets is ambiguous with respect to the subjects on which cabinet selectors focus when they look to the legislature. Do they focus on the gender composition of the legislature as a whole? Or do they focus on the gender composition of the delegation/s of the governing party or parties?
Many studies find a positive association between women's full-chamber representation and women's representation in the cabinet (Barnes and O'Brien Reference Barnes and O'Brien2018; Claveria Reference Claveria2014; Davis Reference Davis1997; Escobar-Lemmon and Taylor-Robinson Reference Escobar-Lemmon and Taylor-Robinson2005; Reynolds Reference Reynolds1999; Siaroff Reference Siaroff2000). In Davis's (Reference Davis1997, 64) words, “whether or not a party appoints women to government seems to depend on the number of women parliamentarians from outside the party as much as—if not more than—the number who are party members.” While the association between percent women legislators and percent women cabinet members is empirically robust, scholars have not provided a clear account of the mechanism behind the association.Footnote 2 Why should we expect the individuals making cabinet appointments to base their personnel decisions on the composition of the entire legislative chamber? Annesley (Reference Annesley2015, 619) addresses this question directly in the context of systems that restrict the pool of potential ministers to politicians who hold a legislative mandate. “It makes little sense,” she writes, “to correlate women's ministerial presence with the aggregate number of women in parliament, as it is only women from the governing party or parties, and not the lower house as a whole, who are in the ministerial eligibility pool.” Imagine the case of a victorious coalition whose participating parties have all taken steps to promote parity in their legislative delegations. Imagine, further, that no opposition parties have taken such steps. Under such circumstances, why would principals appoint a cabinet that looks more like parliament as a whole and less like the parliamentary delegations of the participating parties?
The Gamson's law literature suggests that when party leaders consider the cabinet, they focus more narrowly on the characteristics of the parliamentarians that belong to governing parties. Studlar and Moncrief (Reference Studlar and Moncrief1997) provide some support for the “narrow focus” idea in a study of gendered cabinet appointments in the Canadian provinces, where single-party governments are the norm. They discover that the two phenomena—the total percentage of women in provincial legislatures, on one hand, and the percentage of women within governing parties’ parliamentary delegations, on the other—are associated but that the latter, narrower variable is a particularly strong predictor of women's cabinet shares. “The proportion of women in the governing party,” they find, “far overrides all of the other variables [including the percentage of women in the legislature] as an influence on the percentage of women in the cabinet” (Reference Studlar and Moncrief1997, 76).
These considerations suggest that cabinet selectors are particularly attuned to the representational characteristics of the members of parliament who support the government and that the effect of women's seat shares in the set of government-supporting MPs may depend on the type of government in place.
To summarize the causal logic that informs our guiding hypothesis: parliamentary systems fuse legislative and executive powers and prioritize the construction of legislative delegations that support governing cabinets. Party leaders face two logically separable decisions in the cabinet formation process. In the first step, they determine how many cabinet positions will exist and how many cabinet seats each party will control. In the second step, they determine which individuals will occupy the aforementioned seats. Party leaders consider parliamentary arithmetic during both steps. In step one, they consider the relative power of parties within the set of cabinet-supporting legislators. In step two, they consider gendered representational patterns among the set of cabinet-supporting legislators. Both the number of seats partitioned to governing parties and the relative importance of gender as a checklist item depend on parliamentary math. When cabinet-forming principals look to the legislature, they see partisan constellations and gendered partisan constellations. They appoint cabinets whose partisan balances and gender characteristics mirror the partisan balances and gender characteristics of their legislative allies.
DATA, METHOD, AND RESEARCH STRATEGY
The percentage of women in the world's legislatures has held steady or risen every year for the past twenty or so years. The general picture seems to imply that different parties—regardless of ideology—are all on an upward trajectory. At present, though, no organization publishes the kind of comparative party-disaggregated data that would allow us to determine whether this is the case.
Thus, we have gathered party-disaggregated data on MPs and cabinet members in eighteen of the nineteen contemporary OECD countries that Elgie (Reference Elgie2018) classifies as having parliamentary systems. The primary reason we restrict our remit to OECD countries relates to data availability. It is easier to collect the names, party affiliations, and genders of legislators and cabinet members in OECD states over time than it is to collect such data from less-developed countries.Footnote 3 As noted above, we focus on parliamentary systems because such systems epitomize the fusion of legislative and executive powers. Chief executives in semi-presidential and presidential systems may consider gender as a representational characteristic, but the legislative-executive connection is particularly tight in parliamentary systems. Thus, such systems are likely to provide the most direct test of the gendered Gamson's logic sketched above. Our focus on OECD states also allows us to highlight relationships in contexts where liberal democracy is relatively well-established;Footnote 4 the gendered Gamson's logic assumes that the distribution of legislative seats reflects a relatively free and fair process of electoral contestation. We restrict our temporal remit to the 1990–2019 period for two reasons. First, as discussed above, the global gender-balanced decision-making norm only crystallized in the mid-1990s. While gender was certainly a relevant category before the 1990s, most principals interpreted it very differently after the United Nations Decade for Women (1975–1985) and the 1995 World Conference on Women in Beijing. Before the UN Decade for Women, the most prevalent gender rule was “ministers should be men.” Second, three of the 18 OECD states in our sample (Estonia, Hungary, Latvia) embarked on democratic transitions at the beginning of the 1990s; since the logic upon which our hypothesis rests assumes a democratic context, it would be inappropriate to include observations from these countries from moments preceding their respective transitions.
We focus exclusively on initial post-election cabinets. We define an initial post-election cabinet as the first cabinet formed after a general election. In calling such cabinets initial, we want to emphasize that our analysis does not account for cabinet reshuffles or cabinets that result from parliamentary acceptance of a new prime minister within a legislative session. We do not want initial to imply an identity between a particular post-election cabinet and the first post-election government formed by a particular prime minister. To clarify this point, consider Theresa May's cabinets in the United Kingdom. May's first cabinet (May I) came to power in the course of a legislative session. May's first initial post-election cabinet (May II) was formed on June 11, 2017, three days after a UK general election. May I was Theresa May's first cabinet, but May II was May's first initial post-election cabinet. We include May II (and exclude May I) in our dataset.
We code the partisan affiliations and genders of all legislators and post-election cabinet ministers since 1990 in Australia, Belgium, Canada, Denmark, Estonia, Germany, Greece, Hungary, Israel, Italy, Latvia, Luxembourg, the Netherlands, New Zealand, Norway, Spain, Sweden, and the United Kingdom. The most recent post-election cabinet included in our dataset is Ratas II in Estonia, which had an investiture date of April 29, 2019. Thus, the dataset includes all post-election cabinets with investiture dates falling between January 1, 1990 and April 29, 2019, inclusive. These parameters generate a dataset that includes 146 post-election cabinets across our eighteen countries.
For cabinet ministers, our data come from the websites of countries’ government offices, press coverage of cabinet investiture, the European Journal of Political Research's Political Data Yearbook (politicaldatayearbook.com) and/or native-language Wikipedia pages. For legislators, our data come from the websites of the respective legislative chambers, personal correspondence with the staffs at legislative chambers, and/or native-language Wikipedia pages.
Our dependent variable is the percentage of cabinet members in a post-election cabinet who are women. To determine the total number of cabinet ministers, we begin with the counts of cabinet positions reported by the Comparative Political Data Set (Armingeon et al. Reference Armingeon, Wenger, Wiedemeier, Isler, Knöpfel, Weisstanner and Engler2019). We include deputy heads of government (e.g., deputy prime minister) and exclude deputy portfolioed ministers (e.g., deputy minister of finance) and ministers of state. When we calculate the total number of cabinet posts, we follow O'Brien et al. (Reference O'Brien, Mendez, Peterson and Shin2015), who exclude the prime minister.Footnote 5 We calculate our critical independent variable, Gendered Gamson's percentage, through a three-step process. First, we determine the total number of legislators in the party or parties that participate in the cabinet. Second, we determine the number of women in that set of legislators. Third, we divide the latter number by the former number and multiply the quotient by 100.
For our statistical models, we use linear regression with ordinary least squares and control for institutional variables previously found to be associated with women's cabinet representation. We include controls, specifically, for variables related to the legislature, the cabinet, and a country's international context.
The legislature
Scholars have considered the extent to which gender quotas—which are designed to increase women's legislative seat shares and, indirectly, to encourage public attention to gender equality issues and increase the ranks of women who ascend to ministerial positions—might affect women's cabinet seat shares. Claveria (Reference Claveria2014) finds that party quotas are associated with higher proportions of ministerial portfolios held by women. Because advanced industrial democracies have relied more heavily on party quotas than statutory quotas or reserved seats (Dahlerup and Friedenvall Reference Dahlerup and Freidenvall2005; Krook Reference Krook2009), we account for the percentage of parliamentary seats held by all parties that have adopted a voluntary party quota by the date of a cabinet's investiture. Our data for Quota come from International IDEA (https://www.idea.int/data-tools/data/gender-quotas); we supplement by additional sources where the IDEA data contain ambiguities.
The cabinet
We control for whether the cabinet party that controls the most cabinet seats is a left-wing party. Our dichotomous Lead party left variable comes from the Comparative Political Data Set (Armingeon Reference Armingeon, Wenger, Wiedemeier, Isler, Knöpfel, Weisstanner and Engler2019). Left parties are generally perceived as more committed to gender equity than non-left parties. Governments led by left parties, therefore, may be more likely to include a higher share of women in their cabinets. Findings on the gendered appointment behavior of left and non-left governments vary. Claveria (Reference Claveria2014), for example, finds that left parties appoint more women to cabinets than right parties. Davis (Reference Davis1997) and Reynolds (Reference Reynolds1999), however, find little relationship between ideology and women's appointment to cabinet positions, although Davis finds that left/center-left coalitions are slightly more likely to include women in their cabinets than other types of governments. Siaroff (Reference Siaroff2000) finds that centrist parties are more likely to include women in their cabinets than left parties, and Rashkova and Zankina (Reference Rashkova and Zankina2019) find that right-leaning parties appoint more women to high-prestige ministerial posts than left-leaning parties.
In addition to considering the ideology of governing parties, we also control for the Number of cabinet posts and the Number of parties in cabinet. Both measures come from our own dataset. Numerous authors have suggested that larger cabinets may be more conducive to women's access (Escobar-Lemmon and Taylor-Robinson Reference Escobar-Lemmon and Taylor-Robinson2005; Krook and O'Brien Reference Krook and O'Brien2012). The idea, in this case, is that parties will be less likely to appoint women—who are disproportionately likely to hold lower positions in the party hierarchy—when cabinets are small. The second issue—the number of parties in the cabinet—is theoretically distinct from the first but reflects a similar arithmetic logic. If a party could appoint 25 of its members to 25 open cabinet posts, it may be more likely to include many women among those members. But if it is sharing power with four other parties and can appoint only five people to the cabinet, it may be tempted not to include any women. In both cases (e.g., the case of small cabinets and the case of many coalition partners), women's access to the cabinet may be influenced by the number of available positions. This logic recalls the relationship between district magnitude and party magnitude discussed in the literature on women's legislative representation (Matland Reference Matland1993; Schmidt and Saunders Reference Schmidt and Saunders2004).Footnote 6
In terms of empirical support for these ideas, Claveria (Reference Claveria2014) finds that the relationship between cabinet size and women's cabinet representation is in the expected direction (as the number of seats declines, women's presence also decreases) but does not reach traditional levels of statistical significance.
We also control for whether a country's current prime minister is a woman. The literature surrounding Woman PM now is multivocal. Some studies (Davis Reference Davis1997; Jacob, Scherpereel, and Adams Reference Jacob, Scherpereel and Adams2014) find that a woman head of government is associated with a higher proportion of women cabinet ministers. Reyes-Housholder (Reference Reyes-Housholder2016), who focuses on the relationship between women presidents and women cabinet ministers in Latin America, suggests mechanisms that may also operate in parliamentary contexts. She notes (Reference Reyes-Housholder2016, 2–3) that women chief executives are likely to appoint women cabinet members for two reasons: “First, presidentas are more likely than male presidents to interpret part of their own mandates as popular demands for greater female presence in the executive branch. Second, because presidentas’ political networks will probably contain more elite female politicians than male presidents’ networks, presidentas are more likely to perceive female ministerial candidates to be loyal and like-minded.” While the former may be less applicable in parliamentary contexts where prime ministers are not directly elected, the latter is likely to pertain in parliamentary systems. Other scholars (Barnes and O'Brien Reference Barnes and O'Brien2018; Krook and O'Brien Reference Krook and O'Brien2012; O'Brien et al. Reference O'Brien, Mendez, Peterson and Shin2015) find that women leaders are unlikely to appoint more women cabinet members than male leaders. In the words of O'Brien et al. (Reference O'Brien, Mendez, Peterson and Shin2015, 690–1), “the presence of either a female prime minister or a female-led coalition party is associated with fewer female-held portfolios, particularly as compared to exclusively male-led left governments.” Focusing on women defense ministers, Barnes and O'Brien (Reference Barnes and O'Brien2018) find that increases in women's cabinet presence are due to self-appointments.
International context
Finally, Neighbors controls for the possible effects of international peer pressure by measuring the average percentage of women cabinet members among neighboring states. Our intuition is that geographically proximate countries help to diffuse norms related to gender-balanced decision-making. For each country, we operationalize Neighbors by determining countries whose closest proximate point lies within 500 km of the country in question (Gleditsch and Ward Reference Gleditsch and Ward2001, Reference Gleditsch and Ward2006).Footnote 7 Jacob, Scherpereel, and Adams (Reference Jacob, Scherpereel and Adams2014) find that countries with neighbors that are above the global mean in terms of the share of women's cabinet positions are associated with higher levels of women's presence in their own cabinets, especially for low-prestige posts. They find, furthermore, that having neighbors that are below the global mean for women's cabinet representation has a negative effect on women's appointment to cabinet positions.
RESULTS
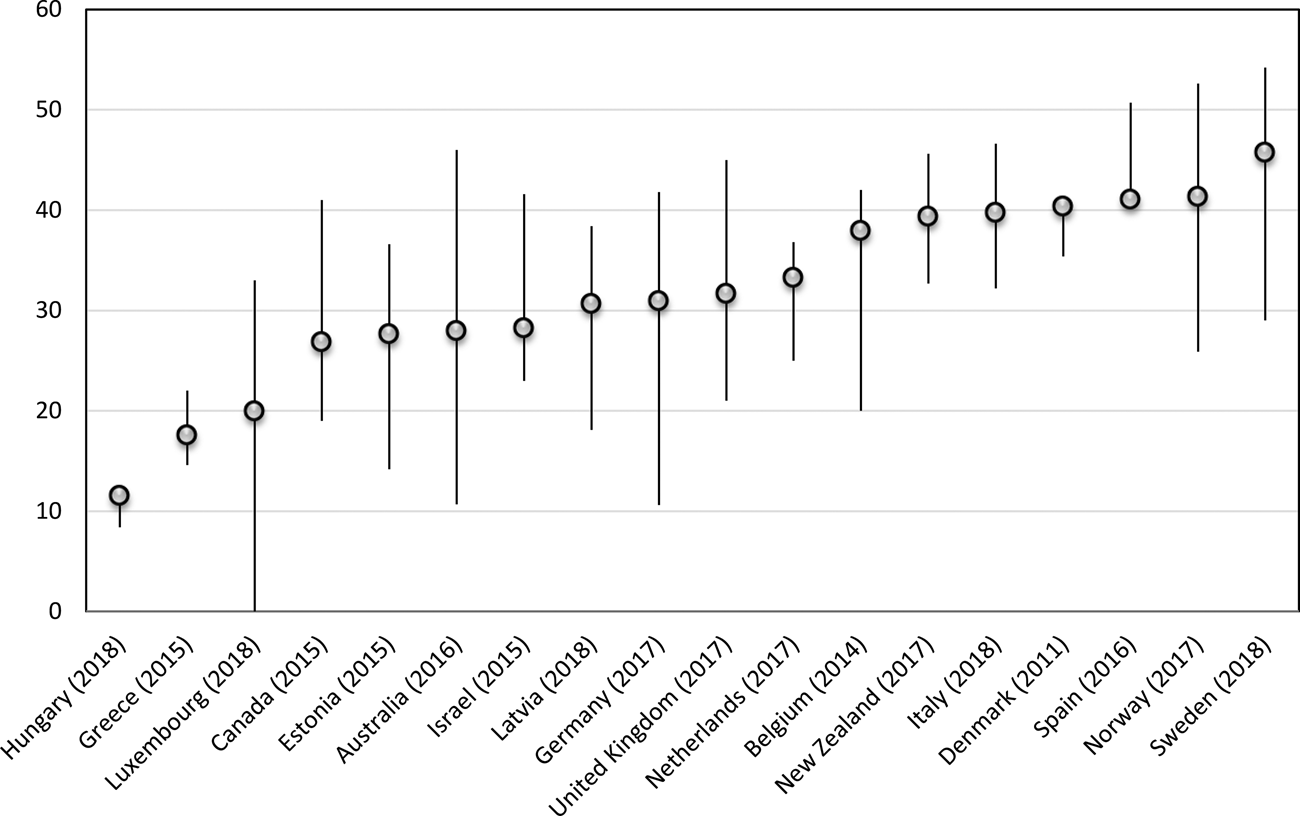
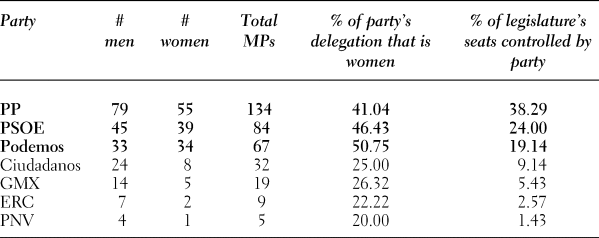
Before presenting bivariate and multivariate results, it is important to emphasize that there is a strong correlation (r = 0.89) between our key independent variable of interest (Gendered Gamson's percentage) and the full-legislature (Percent women legislators) indicator that has traditionally been used in the literature. It is important to note, though, that the percentage of women in the legislative delegation of a governing party or parties is neither identical nor always closely related to the percentage of women in the full legislature. To demonstrate this point, consider Figure 1, which shows that within any country, parliamentary party delegations can have very different gender balances. In the figure, the circles denote the percentage of women in the full parliament, and the bars denote the range of values for all parliamentary parties that control at least ten percent of the parliament's seats. Table 3, which provides a zoomed-in look at the Spanish Congress of Deputies, provides additional context to assist with interpretation of Figure 1's circles and bars. In the Congress of Deputies (2016), women were relatively well represented in the three leading parties (PP, PSOE, and Podemos) and quite poorly represented in the four smaller parliamentary parties. Consider two scenarios that, at least theoretically, might have come out of this situation. In the first scenario, PSOE and Podemos form a coalition with some combination of the four small parties. In the second scenario, either PSOE or Podemos becomes the junior coalition party to PP. We would expect the cabinet that comes out of the first coalition to have fewer women than the cabinet that comes out of the second coalition.
Gender Balances Among Parliamentary Delegations
Circles represent the percentage of women in the parliamentary chamber as a whole.
Endpoints of bars represent the percentage of women in the parliamentary delegations of the most and least gender-balanced parliamentary delegations. Parties with ≥10% of parliamentary seats are included in the figure

Gendered Composition of Spanish Congress of Deputies, 2016

Overall % women legislators: 144/350 = 41.14%.
Parties in bold claim ≥ 10% of seats in the legislature and are included in Figure 1.
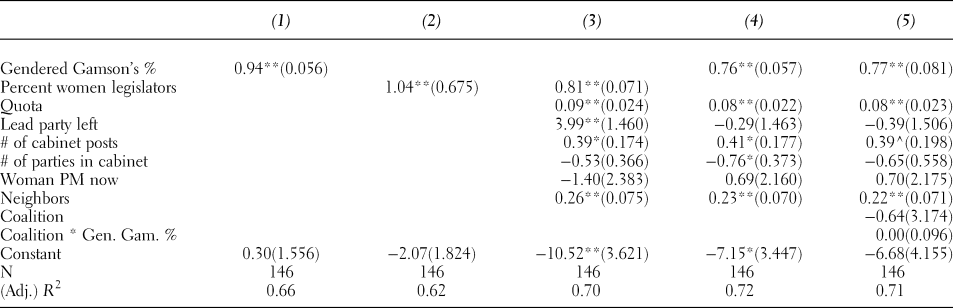
In Table 4, we report results from a series of bivariate and multivariate models. Columns (1) and (2) present results of bivariate models using Gendered Gamson's percentage and Percent women legislators, respectively, as predictors of Percent women cabinet members. Column (3) presents a full model containing Percent women legislators and all legislative, cabinet-level, and international context controls. Column (4) presents a model that is identical to column (3), except insofar as it replaces Percent women legislators with Gendered Gamson's percentage. To test the idea that Gendered Gamson's percentage may be a particularly powerful predictor of women's cabinet representation in single-party cabinets, we present an additional model (Column (5)) that codes whether a government is a Coalition (0 = single-party government; 1 = coalition government) and an interaction of the latter variable with Gendered Gamson's percentage (Coalition * Gen. Gam. %).
Predictors of Women's Cabinet Representation

For models (1) and (2), standard errors are in parentheses, and the final row reports R 2. For all other models, robust standard errors are in parentheses, and the final row reports the adjusted R 2.
^p < 0.10
*p < 0.05
**p < 0.01
As columns one and two make clear, Gendered Gamson's percentage and the percentage of women legislators are both strong bivariate predictors of the percentage of women cabinet members. Gendered Gamson's percentage and percent women cabinet members are strongly correlated (r = 0.81), and the bivariate regression coefficient of 0.94 is significant at the level of p < 0.001. In bivariate model (1), 66% of the variation in a country's percentage of women cabinet members can be explained via reference to Gendered Gamson's percentage. The results of model (2), which focuses on the bivariate relationship between percentage of women legislators and the percentage of women cabinet members, are similar. The correlation among these two variables is strong (r = 0.79), and the regression coefficient (1.04) is significant at the highest level. In a bivariate setting, 62% of the variation in the outcome variable can be explained by reference to percent women legislators.
Column (3) reports results of a multivariate model, which, following previous analyses, employs the percentage of women legislators but omits the Gendered Gamson's percentage. As in previous studies, the coefficient of Percent women legislators is positive and significant. Each percentage point rise in the percentage of women legislators is associated with an increase of 0.81 percentage points in the dependent variable. This result is significant at the p < 0.001 level. Results from most of the control variables in model (3) reinforce findings from the literature. The indicator measuring the percentage of legislative seats controlled by parties with voluntary party quotas is positive and significant, although the effect size (0.09) is relatively small. In addition, the results suggest that cabinets led by left-wing parties are likely to appoint more gender-balanced cabinets, that the number of cabinet posts is positively associated with women's cabinet representation, and that countries with neighbors having higher levels of women's cabinet representation are themselves likely to have more women in the cabinet. Model (3)'s adjusted R 2 is 0.70.
Model (4), which replaces Percent women legislators with Gendered Gamson's percentage produces a modest improvement of fit when compared with model (3); the adjusted R 2 of 0.72 compared with the adjusted R 2=0.70. Consistent with H1, the coefficient of the variable of interest is positive and highly significant; an increase of one percentage point in Gendered Gamson's percentage is associated with an increase of 0.76 percentage points in the percentage of women in the cabinet.
In many respects, the additional results from model (4) resemble those from model (3). There are two particularly notable findings, though. The first relates to the number of parties in the cabinet. The sign of that variable's coefficient is in the expected direction (e.g., additional cabinet parties are associated with lower percentages of women cabinet members), and the finding is significant at the p < 0.05 level. The second relates to the Lead party left variable, which is negative and insignificant. This result suggests that controlling for the Gendered Gamson's percentage negates the effect of party ideology on women's cabinet outcomes. It suggests, in other words, that it is possible for non-left governments to have high levels of women's cabinet representation but that such governments are unlikely to do so if participating parties’ parliamentary delegations do not contain significant numbers of women.
Column (5) of Table 4 explicitly tests the idea—first raised in the conversation between Davis (Reference Davis1997) and Studlar and Moncrief (Reference Studlar and Moncrief1997)—that the effects of Gendered Gamson's percentage and percent women legislators may depend on whether a country's government is a single-party or coalition government. Studlar and Moncrief suggest that Gendered Gamson's percentage might be a particularly strong predictor of women's cabinet representation under conditions of single-party government. Neither the sign nor the value (0.00) of the interaction term's coefficient in column (5) supports this idea.
Overall, the models provide support for H1. Gendered Gamson's percentage is a consistent predictor of women's cabinet shares in parliamentary systems. When parties that have adopted voluntary party quotas do well at the ballot box, cabinets are likely to be more gender balanced. Women's cabinet seat shares depend on the number of cabinet posts and the number of parties in government and on the extent to which women gain cabinet representation in neighboring countries. Non-left parties may lead quite gender-balanced cabinets, particularly if they increase women's representation in the parliamentary delegations of the cabinets they lead.
CONCLUSIONS AND IMPLICATIONS
When cabinet selectors in parliamentary systems assess the political scene after a general election, they have many factors to consider. Regardless of whether they lead the country towards a single-party government or a coalition government, they must eventually determine the new cabinet's personnel dimension. When considering the latter question, they look to the legislature—the body on whom their cabinet's life will depend—for cues.
Gamson's law shows that parliamentary math affects the distribution of seats in coalition cabinets. Here, we have argued that parliamentary math also affects the characteristics that principals prioritize when they go about filling cabinet seats. The parliamentary math that matters in the second step of cabinet formation is not gender-blind. In cabinet formation, it is not simply parliamentary partisan math that matters: it is gendered parliamentary partisan math that matters. Cabinets that are supported by more gender-balanced sets of MPs are themselves more likely to be gender-balanced. Cabinets whose supporting parliamentary delegations are dominated by men are more likely to be dominated by men.
Many studies of women's cabinet representation have detected an association between the total percentage of women legislators, on one hand, and the percentage of women in a country's cabinet, on the other. We have suggested that it is difficult to construct a compelling theoretical mechanism behind that association. Following Annesley (Reference Annesley2015), we have suggested that a more plausible theorization focuses on governing parties’ parliamentary delegations: when they consider which cabinet characteristics to prioritize, party principals refer to the gendered distribution of seats among their parliamentary allies. Empirically, we have shown that Gendered Gamson's percentage exercises a significant effect on cabinets’ gender composition. In general, the correlation between a chamber's percentage of women legislators and its Gendered Gamson's percentage is strong. But this is not always true: there can be more or less gender balance within the set of legislators that supports a cabinet than there is within the total set of MPs.
One recent study (Scherpereel, Jacob, and Adams Reference Scherpereel, Adams and Jacob2018) suggests that cabinets tend to be more gender-volatile than legislatures: the gains that women make under one head of government and/or at one point in time may be erased under a successive head of government or at a future point in time. While it is too early to attribute this dynamic to “Gamson's considerations,” this paper suggests one possible explanation for the gender see-sawing that can occur in cabinet contexts: an increase in the total percentage of women legislators over time does not guarantee an increase in women's representation among the set of legislators that invests its confidence in a particular government. We have suggested that when the principals who determine cabinets’ personnel composition go about making appointments, they pay particular attention to the gender composition of “their” MPs. When women's representation within the set of government-supporting MPs increases, we would also expect levels of women's cabinet representation to increase. Our analysis indicates, further, that increasing women's representation in the cabinet is not necessarily driven by left ideology. Theoretically, any cabinet that incorporates parties with more gender-balanced parliamentary delegations should be more gender-balanced. Future research could investigate, however, the extent to which MP seniority may condition this relationship.
In addition to considering such dynamics in greater depth, future research might examine particular episodes of government formation. Here, we have suggested that a global gender-balanced decision-making norm is mediated through domestic institutions and, in particular, that the individuals who form cabinets are particularly attuned to the gender composition of their MP delegations. Memoirs or interviews with party leaders could help to illuminate the extent and modalities through which gendered partisan cues factor into appointment decisions. Future research might also engage hard tests, e.g., cases where the percentage of women cabinet ministers falls far below the gendered Gamson's percentage. In Greece, for example, Alexis Tsipras's 2015 post-election cabinet contained zero women ministers, despite the fact that 30% of the parliamentarians that supported the government were women. Tsipras’ successor, Kyriakos Mitsotakis, who formed his own initial post-election cabinet in July 2019, has also appointed a cabinet that falls well below Greece's gendered Gamson's percentage. In a recent interview, Mitsotakis admitted that his government was “way behind the curve when it comes to gender balance” and suggested that the gender imbalance “[was] also something [he] intend[ed] to change in the first reshuffle” (Eder and Sheftalovich Reference Eder and Sheftalovich2020). This admission points to a potentially productive line of future research into the sustainability of appointment decisions that do not meet the gendered Gamson's expectations.
Overall, like Gamson, we have suggested that cabinet-forming principals look toward their parliamentary delegations when they assemble their cabinets. We have stressed, though, that their interinstitutional gaze (a) does not end once they have determined how to distribute seats and (b) is not gender-blind. When principals see MPs, they do not simply see parliamentary seats. They see gendered bodies. Their attention to gender affects their appointment decisions.