Accurate recognition of facial emotions is critical for successful navigation of the social environment. Atypical facial emotion recognition has been implicated in various neuropsychiatric disorders involving impaired social cognitive functioning and emotion regulation (Adolphs, Sears, & Piven, Reference Adolphs, Sears and Piven2001; Guyer et al., Reference Guyer, Mcclure, Adler, Brotman, Rich, Kimes and Leibenluft2007). There is growing evidence that early experiential factors at least partially contribute to the developmental progression of emotion face processing. Despite a number of studies focused on periods of early childhood, there have been relatively few investigations of emotional face recognition in later childhood. Here, we examine the extent to which extreme psychosocial deprivation experienced during infancy and toddlerhood affects facial emotion processing during late childhood. We also test whether placement into foster care early in life supports more normative development of facial emotion recognition. This is a follow-up investigation of a longitudinal cohort of children who participated in a randomized clinical trial of foster care for institutionally reared children.
Early facial emotion recognition emerges during infancy and becomes increasingly sophisticated over the first years of life (Herba, Landau, Russell, Ecker, & Phillips, Reference Herba, Landau, Russell, Ecker and Phillips2006). In the first months of life, infants demonstrate basic abilities to discriminate a wide variety of facial emotions, including happy, angry, fearful, and sad facial expressions (Camras, Reference Camras1980; Camras & Allison, Reference Camras and Allison1985; Caron, Caron, & Maclean, Reference Caron, Caron and Maclean1988; Harrigan, Reference Harrigan1984; Nelson, Reference Nelson1987; Odom & Lemond, Reference Odom and Lemond1972; Serrano, Iglesias, & Loeches, Reference Serrano, Iglesias and Loeches1992; Thomas, Debellis, Graham, & Labar, Reference Thomas, Debellis, Graham and Labar2007; Tremblay, Kirouac, & Dore, Reference Tremblay, Kirouac and Dore1987). As children enter the preschool years, their abilities to recognize and label emotional facial expressions improve. Development continues into middle childhood and adolescence, as indicated by gains in processing speed and overall accuracy of facial emotion expressions (De Sonneville et al., Reference De Sonneville, Verschoor, Njiokiktjien, Op Het Veld, Toorenaaar and Vranken2002; Herba et al., Reference Herba, Landau, Russell, Ecker and Phillips2006).
Evidence also suggests that children are capable of recognizing certain emotions with relatively high accuracy early in life, while other emotions are not accurately identified until much later in life. It is well established that accurate identification and recognition of happy faces emerges first (Gross & Ballif, Reference Gross and Ballif1991; Herba et al., Reference Herba, Landau, Russell, Ecker and Phillips2006). This is followed by increases in the ability to recognize sad and angry expressions, with identification of fearful and surprised facial expressions emerging last (Monk et al., Reference Monk, Mcclure, Nelson, Zarahn, Bilder, Leibenluft and Pine2003; Thomas et al., Reference Thomas, Debellis, Graham and Labar2007). Relatively less is known about the developmental profiles of facial emotion recognition in later phases of development, especially as children approach adolescence. However, data suggest that, even during adolescence, processing of fear and anger continues to lag behind adult levels of proficiency (Gao & Maurer, Reference Gao and Maurer2009; Gross & Ballif, Reference Gross and Ballif1991; Herba et al., Reference Herba, Landau, Russell, Ecker and Phillips2006; Mancini, Agnoli, Baldaro, Ricci, & Surcinelli, Reference Mancini, Agnoli, Baldaro, Ricci and Surcinelli2013; Widen & Russell, Reference Widen and Russell2004).
A key question concerns the extent to which early social environments shape the development of facial emotion recognition skills. While some have proposed that these skills are largely experience independent (Eckman & Friesen, Reference Eckman and Friesen1976; Izard, Reference Izard1994), others have theorized a stronger role for environmental influences, arguing that faces and facial emotion processing is fine-tuned by social experiences (Leppänen & Nelson, Reference Leppänen and Nelson2009; Nelson, Reference Nelson2001). Examinations of developmental progressions of children exposed to atypical early social environments have offered some insight into these questions. A special and unfortunate case of an atypical early social environment occurs when children are exposed to early extreme and adverse rearing conditions. For example, when subjected to maltreatment, children are reared in conditions that lie outside the bounds of what is considered minimally expected for normative development. In the context of maltreatment, children often lack access to a consistently responsive caregiver and may be exposed to highly threatening emotional input or extreme deprivation from necessary social emotional and cognitive input at a sensitive point in development.
Converging evidence from multiple investigations suggests that exposure to early adverse rearing conditions shapes the development of face recognition. For example, several studies indicate that, relative to nonabused children, children reared in physically abusive families allocate more attention to angry facial stimuli, respond more rapidly to angry stimuli, and show enhanced abilities to recognize angry emotional expressions with less contextual information than all other negative and positive emotions (Cicchetti & Curtis, Reference Cicchetti and Curtis2005; Curtis & Cicchetti, Reference Curtis and Cicchetti2011; Pollak, Cicchetti, Hornung, & Reed, Reference Pollak, Cicchetti, Hornung and Reed2000; Pollak & Kistler, Reference Pollak and Kistler2002; Pollak, Klorman, Thatcher, & Cicchetti, Reference Pollak, Klorman, Thatcher and Cicchetti2001; Pollak & Sinha, Reference Pollak and Sinha2002; Pollak & Tolley-Schell, Reference Pollak and Tolley-Schell2003; Pollak, Vai, Putzer Bechner, & Curtin, Reference Pollak, Vardi, Putzer Bechner and Curtin2005; Shackman, Shackman, & Pollak, Reference Shackman, Shackman and Pollak2007). In contrast, children reared in chronically neglectful family conditions have shown greater difficulty differentiating between emotions (Pollak et al., Reference Pollak, Cicchetti, Hornung and Reed2000). Together, these data point to the early social environment as one mechanism that shapes the development of emotion recognition skills.
A more severe form of early adverse rearing occurs when children are reared in institutions, a current global and public health problem (Berens & Nelson, Reference Berens and Nelson2015). In many contexts, infants are abandoned at birth and placed into institutional caregiving facilities. These facilities are often characterized by high child-to-caregiver ratios, frequent caregiver turnover, and a lack of individualized care (Maclean, Reference Maclean2003; Zeanah et al., Reference Zeanah, Nelson, Fox, Smyke, Marshall, Parker and Koga2003). As a result, institutionally reared children are typically deprived of the basic opportunity to develop a selective attachment to a primary caregiver, and they are reared in understimulating and noncontingent environments. There is some research on the extent to which this extreme form of social deprivation shapes the development of emotion recognition skills in children adopted internationally after spending the first years of life in an institution. For example, around 5 years of age, previously institutionalized children showed greater difficulties distinguishing between various positive and negative emotions, when compared with nonneglected children (Fries & Pollak, Reference Fries and Pollak2004).
More rigorous, longitudinal evidence has been provided by the Bucharest Early Intervention Project (BEIP), a randomized controlled trial of foster care as an intervention for infants reared in institutions. This study began in 2000 in Bucharest, Romania, with the recruitment of 136 children from six institutions for abandoned or orphaned children. Children's development was first assessed at a baseline, when children were around 22 months of age (ranging from 6 to 31 months). Half of the children at that time (n = 68) were then randomly assigned to be removed from institutions and placed with foster families in the surrounding community (the foster care group [FCG]). These families were established by the research team at the start of the study, as organized foster care did not yet exist in Bucharest, Romania (Nelson, Fox, & Zeanah, Reference Nelson, Fox and Zeanah2014). The development of children who remained in institutions (the care as usual group [CAUG]) was also followed over time. Because the research team adopted a policy of noninterference, many eventually left the institutions to live in family settings but nonetheless remained in the study.
The development of children in the BEIP has been followed longitudinally, with assessments taking place several times during early childhood (30, 42, 54 months) middle childhood (around 8 years), and late childhood (10–12 years), with current assessments continuing at age 16. Multiple domains of development in these children have been compared to a comparison group of children, who were reared in the local community with their biological families (the never institutionalized group [NIG]). This comparison group was initially matched to the institutionally reared group of children on age and gender.
Among the many domains assessed, variability in facial emotion processing has been examined extensively. Somewhat surprisingly in light of other work, evidence gathered over the course of the study has revealed relatively minor differences in the extent to which institutionally reared children show deficits in facial emotion processing, when compared with the NIG. This was assessed at the initial baseline assessment, when children completed an event-related potential task in which brain electrophysiological activity was recorded while children passively viewed happy, fearful, sad, and angry facial expressions. At this time point, institutionally reared children initially showed altered neural responses in early, sensory-related neural components (N170, P50) to fearful and sad faces when compared with noninstitutionally reared children (Parker & Nelson, Reference Parker and Nelson2005); however, they showed no significant differences in neural activity reflective of higher level perception and cognition (i.e., negative component or positive slow wave components). Follow-up assessments at 30 and 42 months of age revealed similar results; there were no significant group differences in children's neural responses to emotion expressions (Moulson, Westerlund, Fox, Zeanah, & Nelson, Reference Moulson, Westerlund, Fox, Zeanah and Nelson2009). At this same time point, nonverbal behavioral responses to sad, fearful, happy, and neutral facial expressions were also assessed separately using a visual comparison test. Similar to results from the event-related potential tasks, there were no significant differences in performance across groups at the baseline time point, or follow-up assessments that occurred when children were 42 months of age (Jeon, Moulson, Fox, Zeanah, & Nelson, Reference Jeon, Moulson, Fox, Zeanah and Nelson2010; Nelson, Parker, Guthrie, & BEIP Core Group, Reference Nelson, Parker and Guthrie2006).
Similar electrophysiological and behavioral assessments of emotion face processing have continued as children in the BEIP reach middle childhood, around 8 years of age. Unlike prior assessments that relied on lower level, passive, and more perceptual abilities to discriminate between emotions, assessments at these older age points have tested for potential perturbations in more cognitively complex tasks, requiring an integration of discrimination, attention, and social information processing while processing facial emotions. One go/no-go task probed for differences in children's abilities to selectively respond or inhibit responses to various emotions. As part of this task, children were required to respond to angry facial emotions while inhibiting their response to fearful and neutral emotional facial expressions. Relative to the FCG and NIG, the CAUG showed significantly worse abilities to effectively inhibit their responses to neutral and fearful faces, while responding to angry faces, the target emotion. Performance in the FCG was comparable to the non–institutionally reared children (Nelson, Westelund, McDermott, Zeanah, & Fox, Reference Nelson, Westerlund, McDermott, Zeanah and Fox2013). Nevertheless, all children, regardless of group, showed greater difficulty recognizing fearful faces versus angry faces. This is consistent with prior work that suggests that facial emotion recognition continues to mature in childhood, with fear being one of the last emotions to be accurately identified (Thomas et al., Reference Thomas, Debellis, Graham and Labar2007).
On a second task also administered at 8 years of age, children were asked to choose a facial emotional expression that matched various social situations. For example, children were expected to choose a happy face more often than an angry face when asked, “point to the person you'd rather play with,” and a sad face versus a happy face when asked, “point to the person you'd rather help.” Results were consistent with performance on the go/no-go task in that institutional rearing was associated with impairments in some aspects of facial emotion recognition, but not others. Specifically, the CAUG were less likely than the FCG or NIG to select the happy faces as the more optimal playmates. However, no group differences emerged for the other social scenario.
In a third task, children were assessed in terms of their abilities to discriminate between more subtle displays of emotion expressions. For this task, facial emotions (happy, sad, fearful, and angry) were morphed with neutral emotions at varying levels of intensity (Gao & Maurer, Reference Gao and Maurer2009). At 8 years of age, children viewed each emotion at varying intensities from 0% intensity (i.e., a completely neutral face) to 100% intensity and were instructed to identify the emotion of each face. Accuracy rates (i.e., the extent to which a facial emotion was identified correctly) generally did not vary significantly across groups. Further, there were only minor differences in children's emotion identification thresholds (the level of emotion intensity that determined whether an emotional face was differentiated from a neutral expression). No group differences in threshold values were observed for fearful, angry, or sad faces, although children in the CAUG identified happy faces at higher intensities when compared to children in the FCG and CAUG.
In summary, the findings to date involving rigorous assessments through the middle childhood period generally indicate that there are only small differences in the extent to which institutional rearing interferes with facial emotion processing. In less frequent instances where institutional rearing is associated with facial emotions processing, foster care consistently serves to mitigate deficits. Despite this collection of findings, from a broader perspective, much remains unknown in terms of the extent to which these early adverse experiences, or placement into foster care, shape emotional face processing as children grow older. To shed light on this topic, we retested children's facial emotion processing once they reached 12 years of age. We used the identical facial emotion morph task that was administered when children were around 8 years of age, so that we could compare performance across assessments. As previously observed, we expected that there would be minimal group differences in the extent to which institutionally reared children discriminated between positive and negative emotions, when compared with non-institutionally reared children. However, we hypothesized that we might see subtle differences with children in the CAUG showing strongest deficits, and that children in the FCG would show more typical developmental profiles (i.e., similar to the nonneglected children).
Method
Participants
Children in this study participated in the Bucharest Early Intervention Project (BEIP), a longitudinal, randomized controlled trial of foster care for institutionally reared children. At baseline, children ranging from 5 to 31 months of age (mean age of 20 months) and were recruited from six institutions in Bucharest, Romania. Prior to enrollment, children in the BEIP were assessed for several exclusionary criteria, which included the presence of frank genetic and neurological syndromes, fetal alcohol syndrome, and micro- or macrocephaly. Following the baseline assessment, children in institutions were randomized to receive “care as usual” in the institutional setting (CAUG), or were placed into a foster home in the local community (FCG). Children and families in a comparison group (i.e., the NIG) were recruited from pediatric clinics in Bucharest, and were matched to the sample of institutionalized children in terms of sex and age (see Nelson, Fox, & Zeanah, Reference Nelson, Fox and Zeanah2014; Zeanah et al., Reference Zeanah, Nelson, Fox, Smyke, Marshall, Parker and Koga2003, for a more detailed description of the sample and methods). After the baseline assessment, follow-up assessments occurred for all children at 30, 42, and 54 months of age, 8 years of age, and 12 years of age, with the next round of assessments taking place when children reach 16 years.
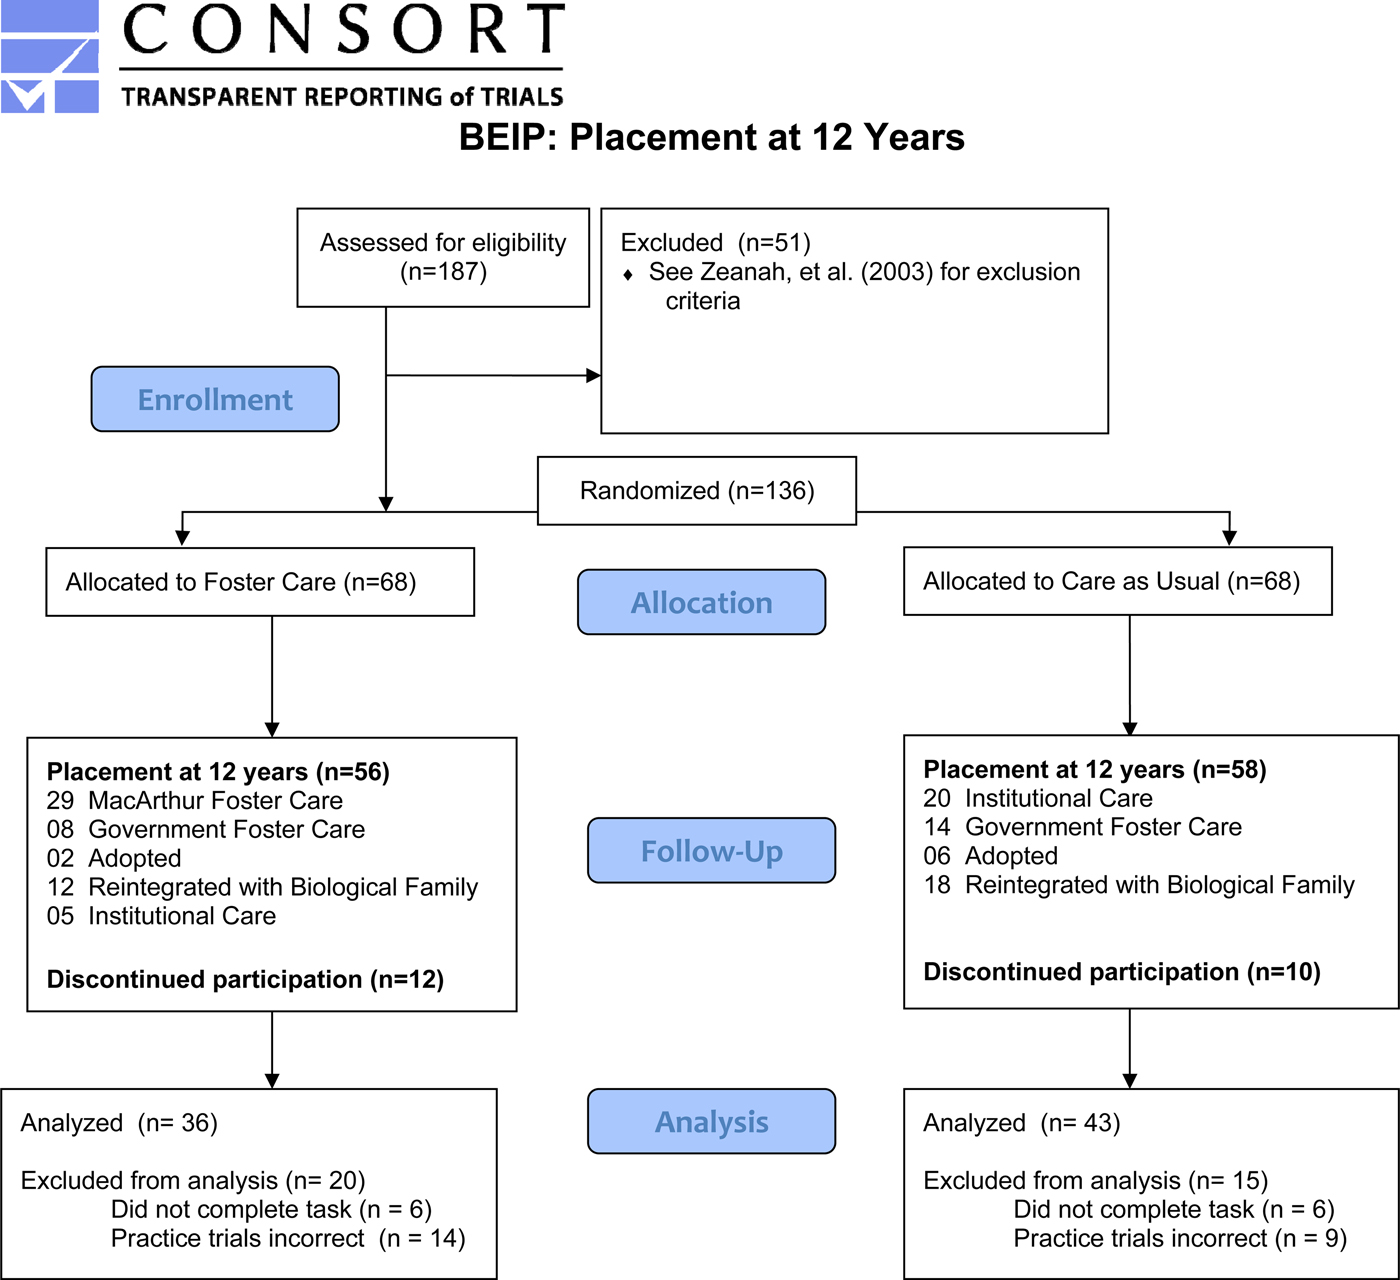
Data from this current study were drawn from an assessment that took place when children were around 12 years of age. At the 12-year assessment, there were 58 youth currently enrolled in the CAUG, 56 children enrolled in the FCG, and 51 enrolled in the NIG. Of those participants, data on the facial morph task were available for 50 children in the CAUG, 52 children in the FCG, and 50 children in the NIG. Data for children who did not successfully complete practice trials were not included in this study; this included data for 14 children in the CAUG, 9 children in the FCG, and 6 children in the NIG (see Figure 1 for the CONSORT diagram and additional details about sample retention). Therefore, for the current study, data were analyzed for 36 children in the CAUG, 43 children in the FCG, and 44 children in the NIG. Of those, 48.7% were boys (n = 74), and ages ranged from 11.14 to 14.61 years (M = 12.75, SD = 0.56).
(Color online) CONSORT diagram for the Bucharest Early Intervention Project at the 12-year assessment.

Materials
Stimuli in this experiment come from the paradigm developed by Gao and Maurer (Reference Gao and Maurer2009). Photographs were drawn from the MacBrain Face Stimuli Set (Tottenham et al., Reference Tottenham, Tanaka, Leon, McCarry, Nurse, Hare and Nelson2009). These portrayed two female faces with happy, sad, fearful, angry, and neutral facial expressions. The photographs used for this task were the same as those used at the prior assessment, when children were 8 years of age, as reported by Moulson, Westerlund, et al., Reference Moulson, Shutts, Fox, Zeanah, Spelke and Nelson2015.
Each set of morphed faces contained a female facial expression consisting of 10 levels of intensity of one of the four emotions. Each emotional face was morphed with a neutral face of the same model to create a full set of 10 stimuli per face. Faces were morphed in 10% increments of intensity, and ranged from 10% to 100% intensity (see Gao & Maurer, Reference Gao and Maurer2009, for additional details of the morphing procedure). Each of the female models' faces was morphed for all four emotional expressions, happy, sad, angry, and fearful, for a total of 40 emotional faces, and 4 neutral faces. Photographs were printed in color on 5- by 7-in. cardstock cards. Faces used for the practice trials differed from those used for the test. Model faces used for the test versus practice were counterbalanced across participants and groups.
Design and procedure
Children were tested in the laboratory setting. Task instructions were given in the child's native language. At the start of the task, children were seated at a table, and five brown bags were placed in front of them. Bags were marked with happy, sad, fearful, angry, and neutral schematic faces and written labels. Participants were told that they would see many faces with varying emotional expressions. They were instructed to place each emotional face in the bag with the matching emotional expression. Participants received one face at a time. Once they placed a face in a bag, the next face was presented. Administrators responded with neutral feedback about their performance during the task. To ensure that they understood instructions and could identify extreme versions of emotional faces, children completed five practice trials prior to starting to task, in which they were given neutral facial expression and 100% morphed facial expressions in random order. Responses were considered correct if the participant placed a face in the bag with the matching emotion, and incorrect if they placed it in any other bag.
Results
Accuracy at 100% intensity
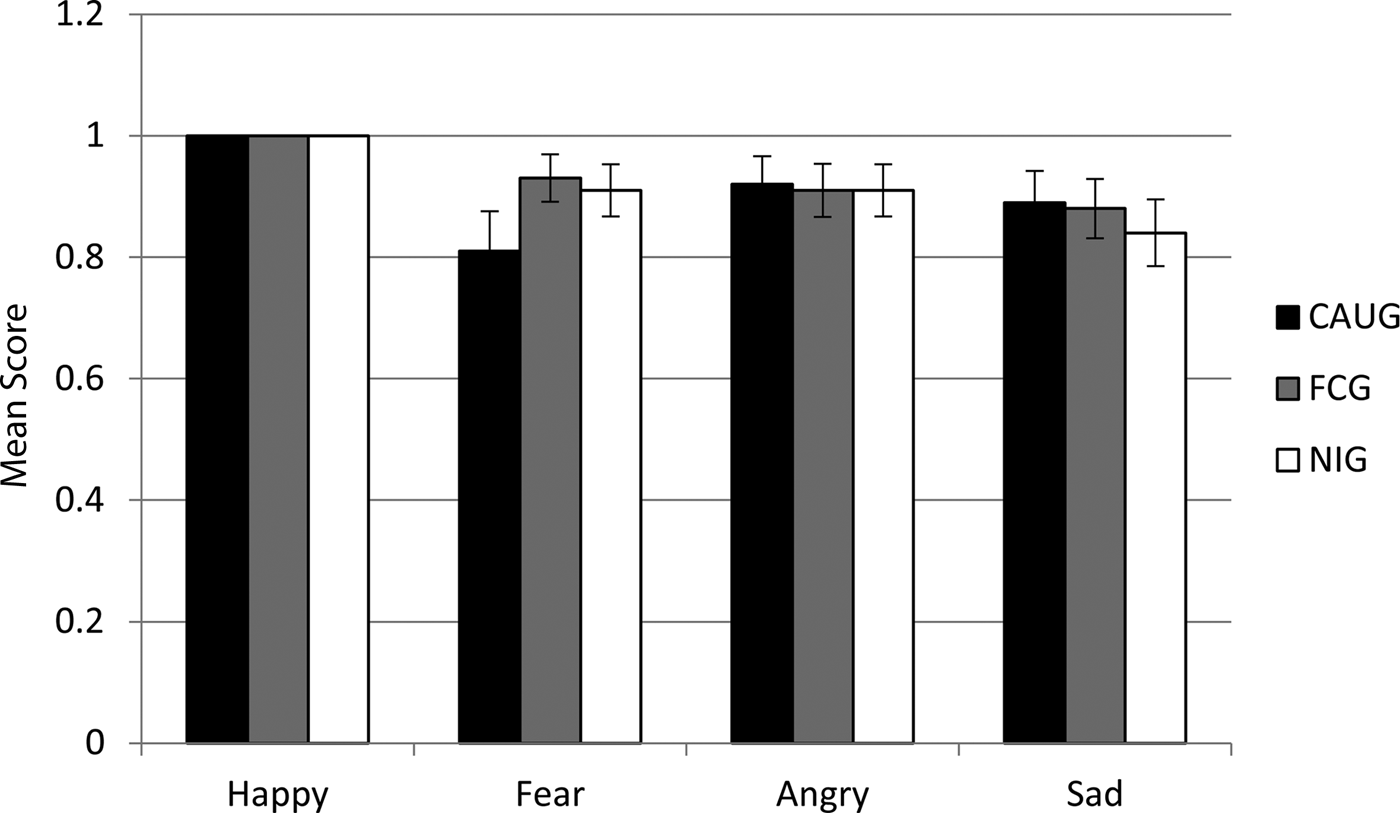
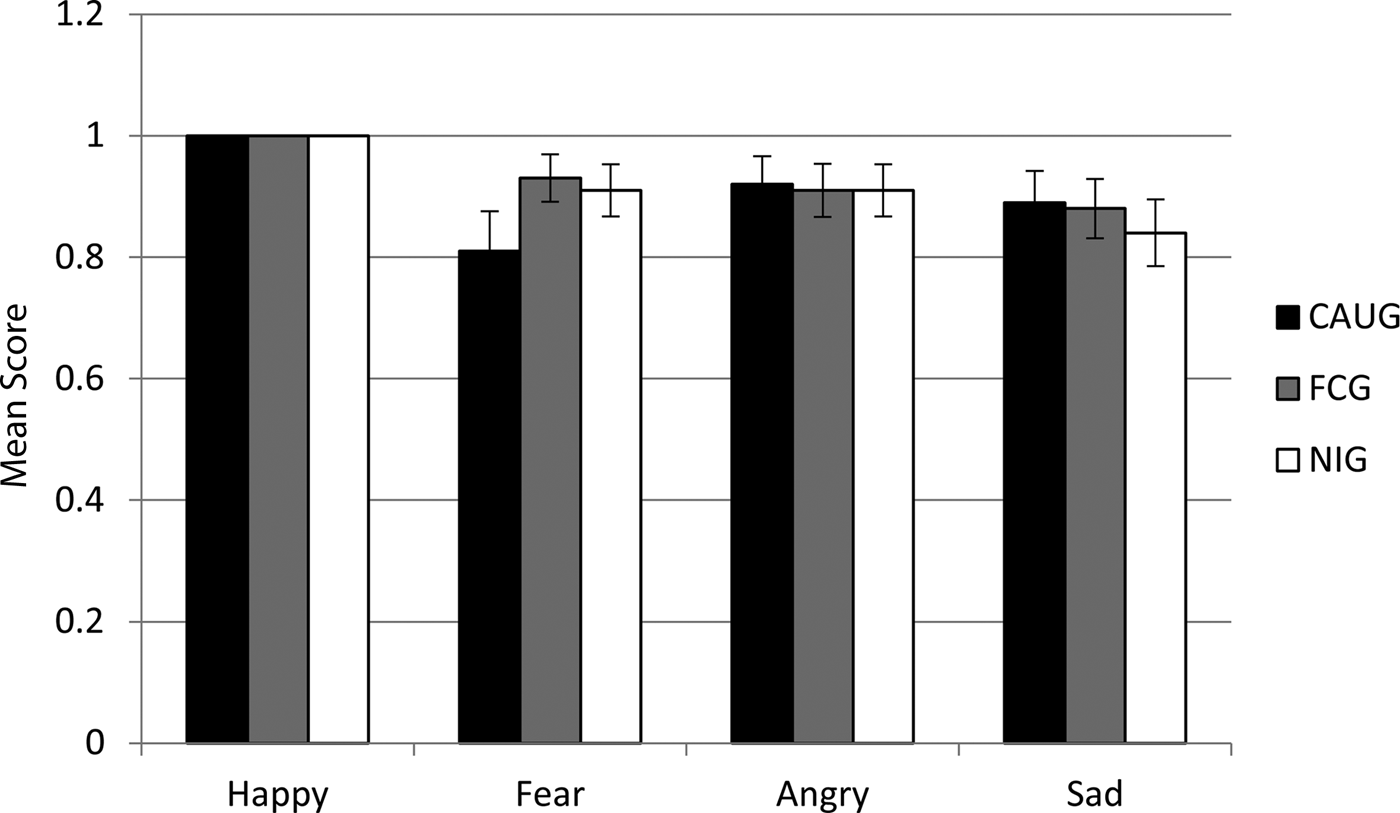
We examined whether the mean accuracy for the 100% versions of each emotional face differed across groups. A generalized estimating equation (GEE) with group as a between-subjects factor and emotion (happy, fear, angry, and sad) as a within-subjects variable revealed that accuracy of 100% intensity faces was highest for happy faces; there were no cases in which children misidentified the extreme version of happy faces, M = 1.0, 95% confidence interval (CI) [1.0, 1.0]. Accuracy rates for sad, M = 0.87, 95% CI [0.80, 0.92], fear, M = 0.89, 95% CI [0.82, 0.92], and angry, M = 0.91, 95% CI [0.85, 0.95], faces were lower than accuracy rates for happy faces, but they did not significantly differ from each other. The main effect for group (p = .89) and interaction for group and emotion condition (p = .54) were not significant; see Figure 2.
Accuracy rates for the 100% intensity version of each emotion and group.
Accuracy and misidentification patterns
Accuracy
Next we examined whether groups differed in their accuracy rates (i.e., their overall likelihood of correctly classifying a face), and also whether groups varied in the extent to which their identification rates (or likelihood of correct classification) increased as a function of increased emotion intensity.
A GEE model was used for these analyses. For all models, the normality of residuals distributions for each model was confirmed by visual inspection. The first model examined the effect of emotion, when collapsing across groups. In this model, intensity and emotion condition were entered as within-subjects factors. For all models, accuracy increased with intensity (ps < .001). Further, accuracy rates significantly varied as a function of emotion (p < .001). The likelihood for correct responses was significantly higher for the fearful faces when compared to all other emotions (ps < .001). The likelihood for correct responses for sad faces was significantly lower when compared to all other emotions (ps < .01). Likelihood for correct identification of angry and happy faces fell between those of fear and sadness.
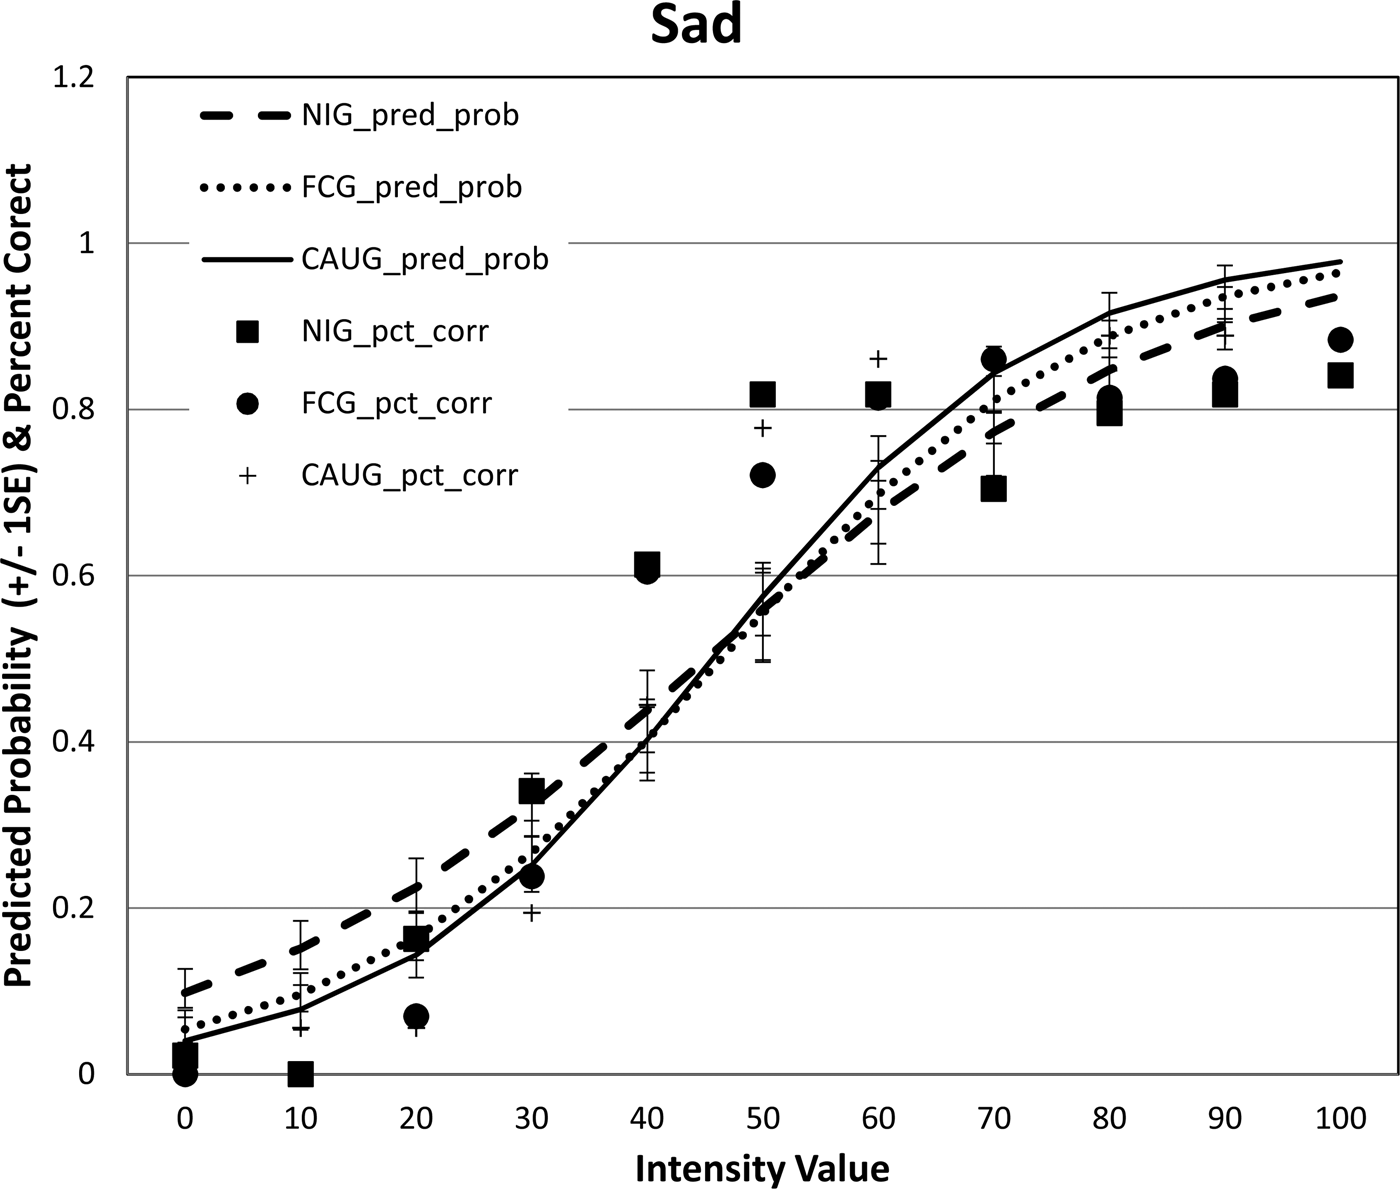
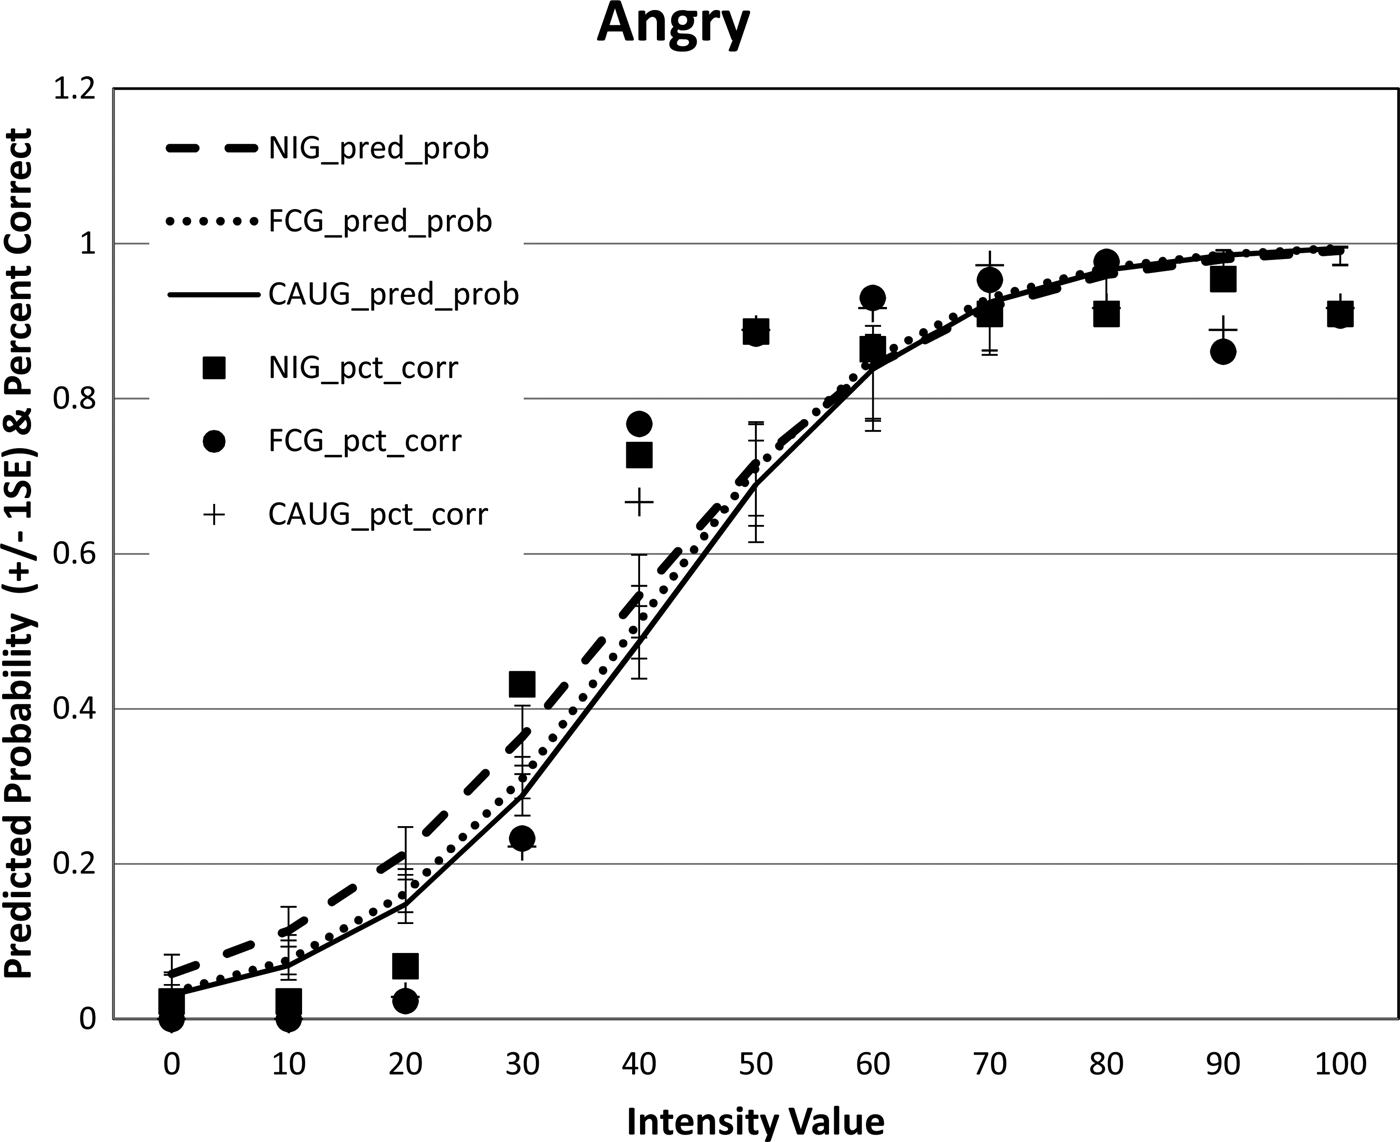
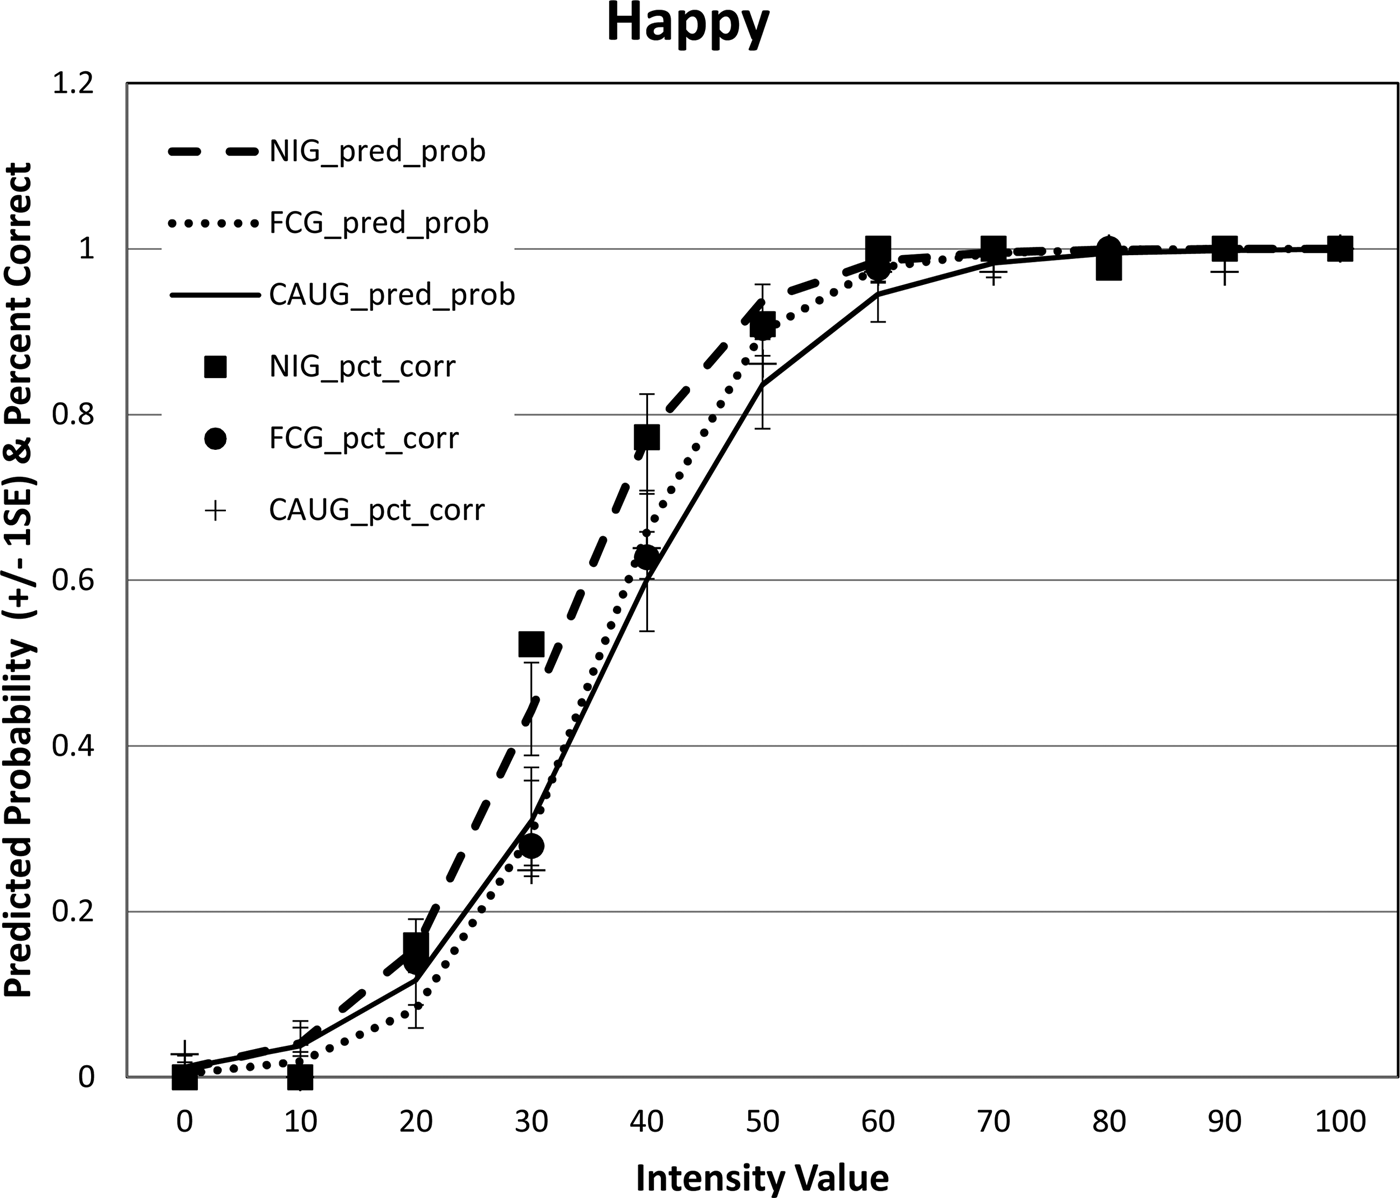
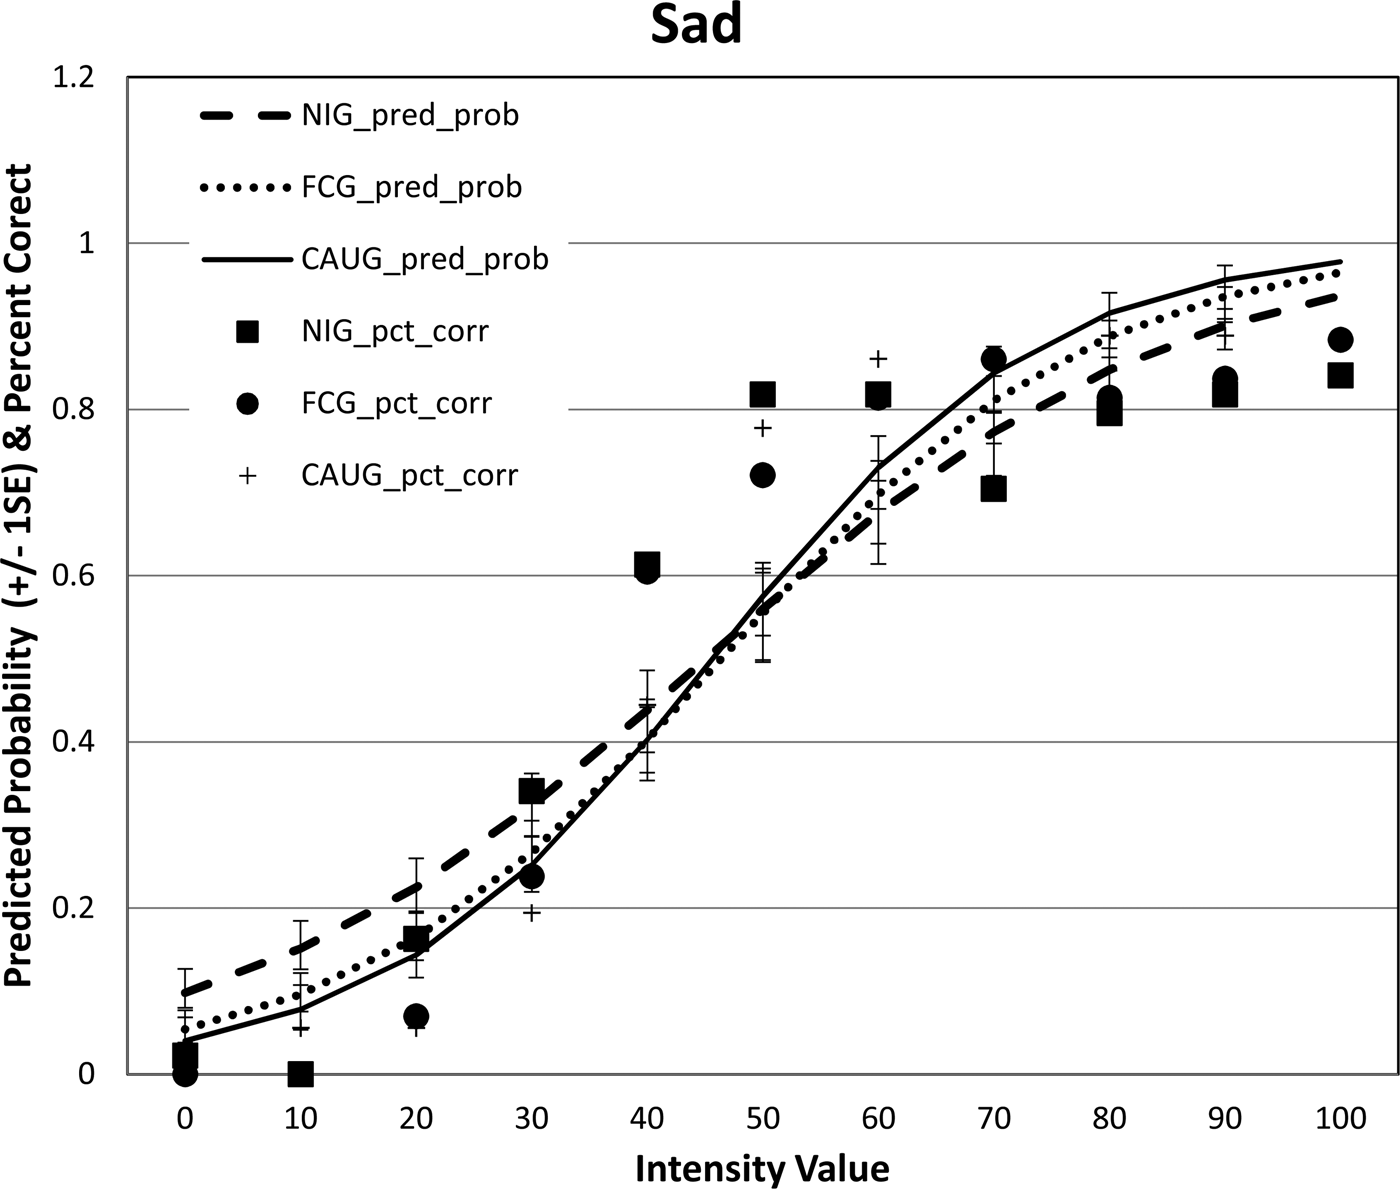
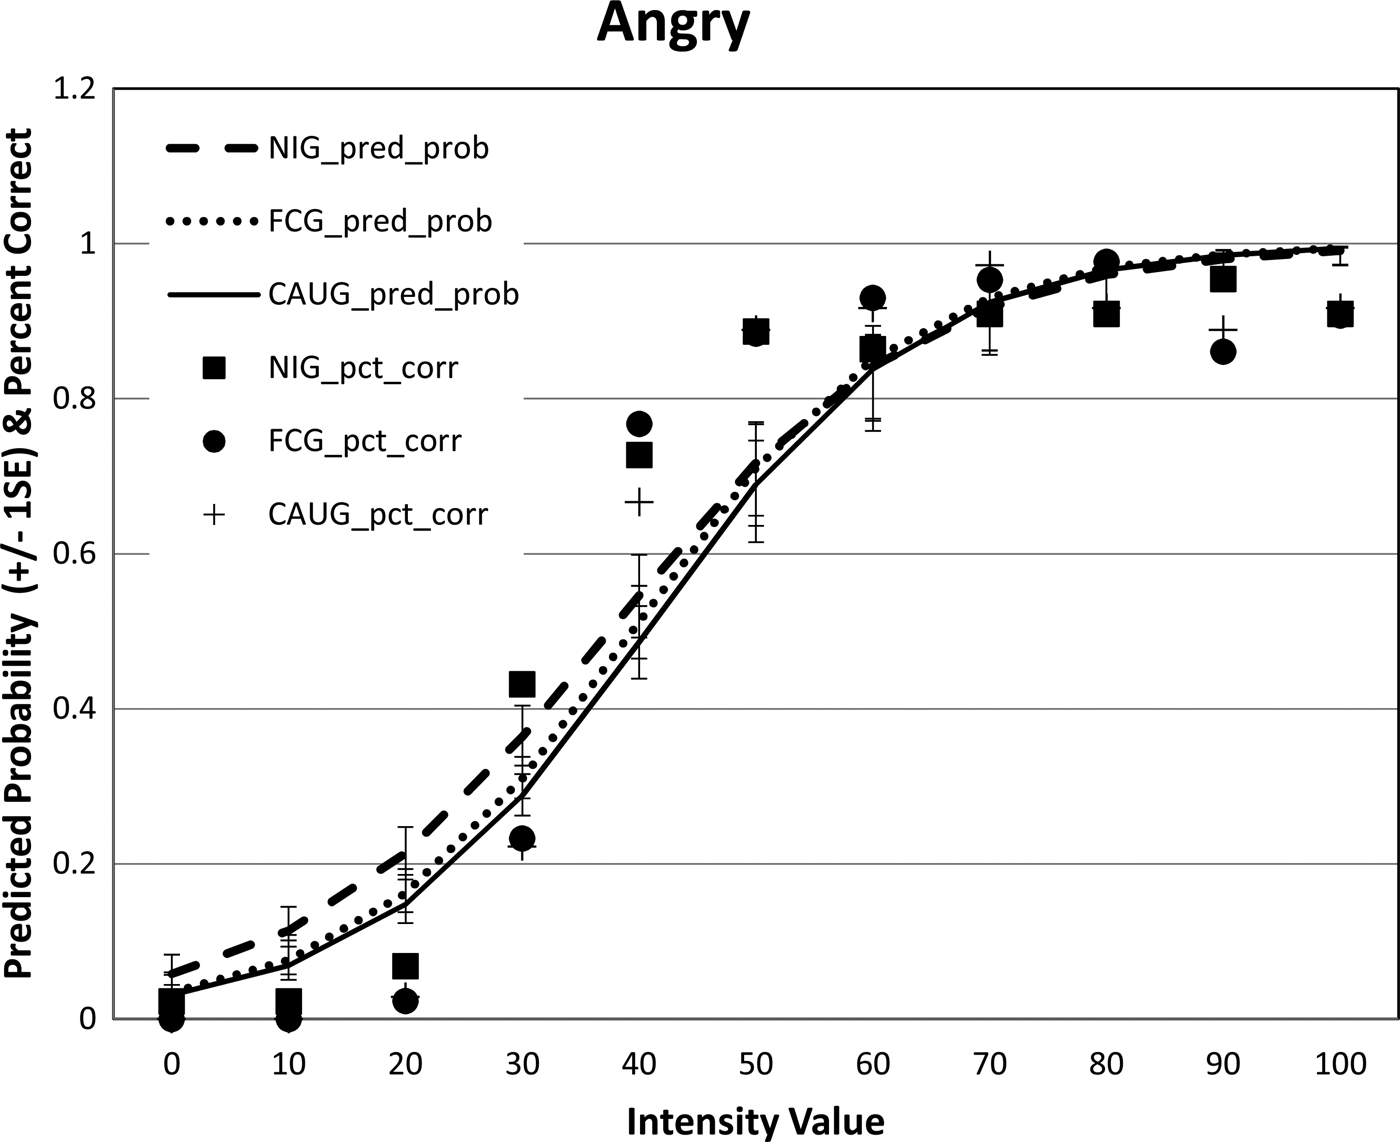
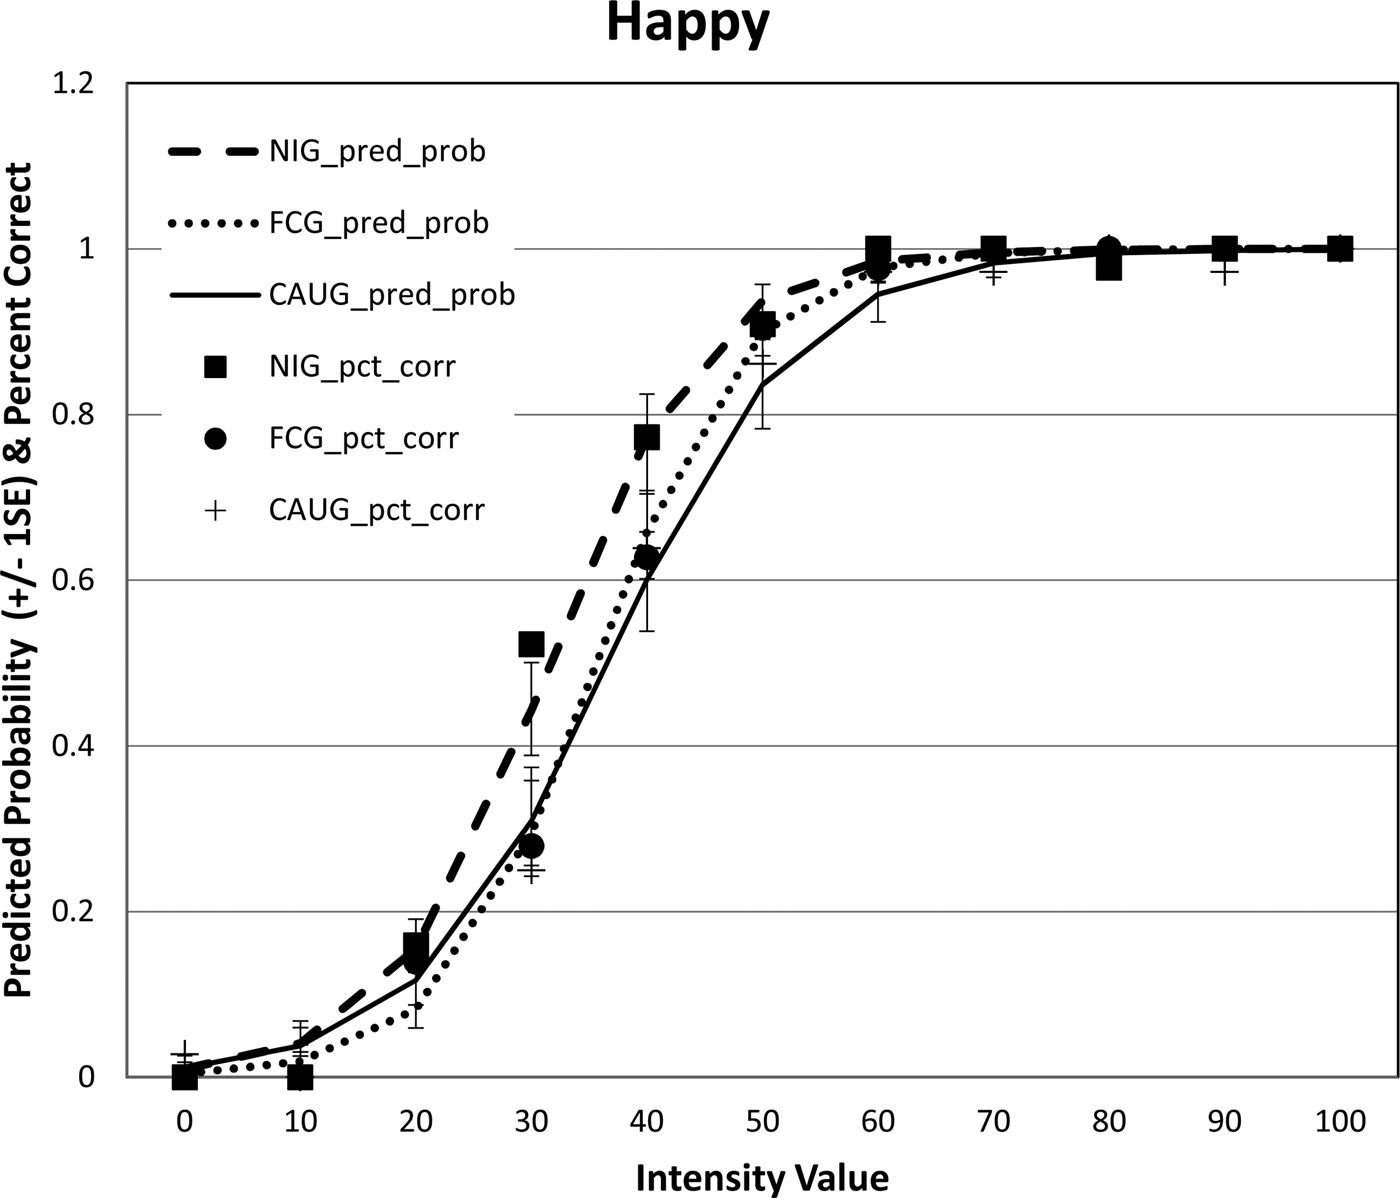
In our next model, we examined the effect of group, when collapsing across emotion conditions. Intensity was entered as a within-subjects factor, and group was entered as a between-subjects factor. The main effect of group on overall accuracy rates was not significant (p = .236). Therefore, groups did not significantly vary in their accuracy rates overall, when emotion categories are not considered. We then stratified our analyses by emotion and examined whether groups differed in accuracy rates across the emotions. There was no main effect of group, or interaction between group and intensity, in terms of accuracy rates for happy faces, sad faces, or angry faces (main effects: happy: p = .562, sad: p = .071, angry: p = .494; interaction: happy: p = .363, sad: p = .174, angry: p = .810; see Figures 3 through 5).
Associations between emotion intensity and response accuracy across the care as usual group (CAUG), the foster care group (FCG), and the never institutionalized group (NIG) for sad faces. Estimated predicted probabilities from generalized estimating equation models are presented along with raw estimates of percentage correct across each group.
Associations between emotion intensity and response accuracy across the care as usual group (CAUG), the foster care group (FCG), and the never institutionalized group (NIG) for angry faces. Estimated predicted probabilities from generalized estimating equation models are presented along with raw estimates of percentage correct across each group.
Associations between emotion intensity and response accuracy across the care as usual group (CAUG), the foster care group (FCG), and the never institutionalized group (NIG) for happy faces. Estimated predicted probabilities from generalized estimating equation models are presented along with raw estimates of percentage correct across each group.
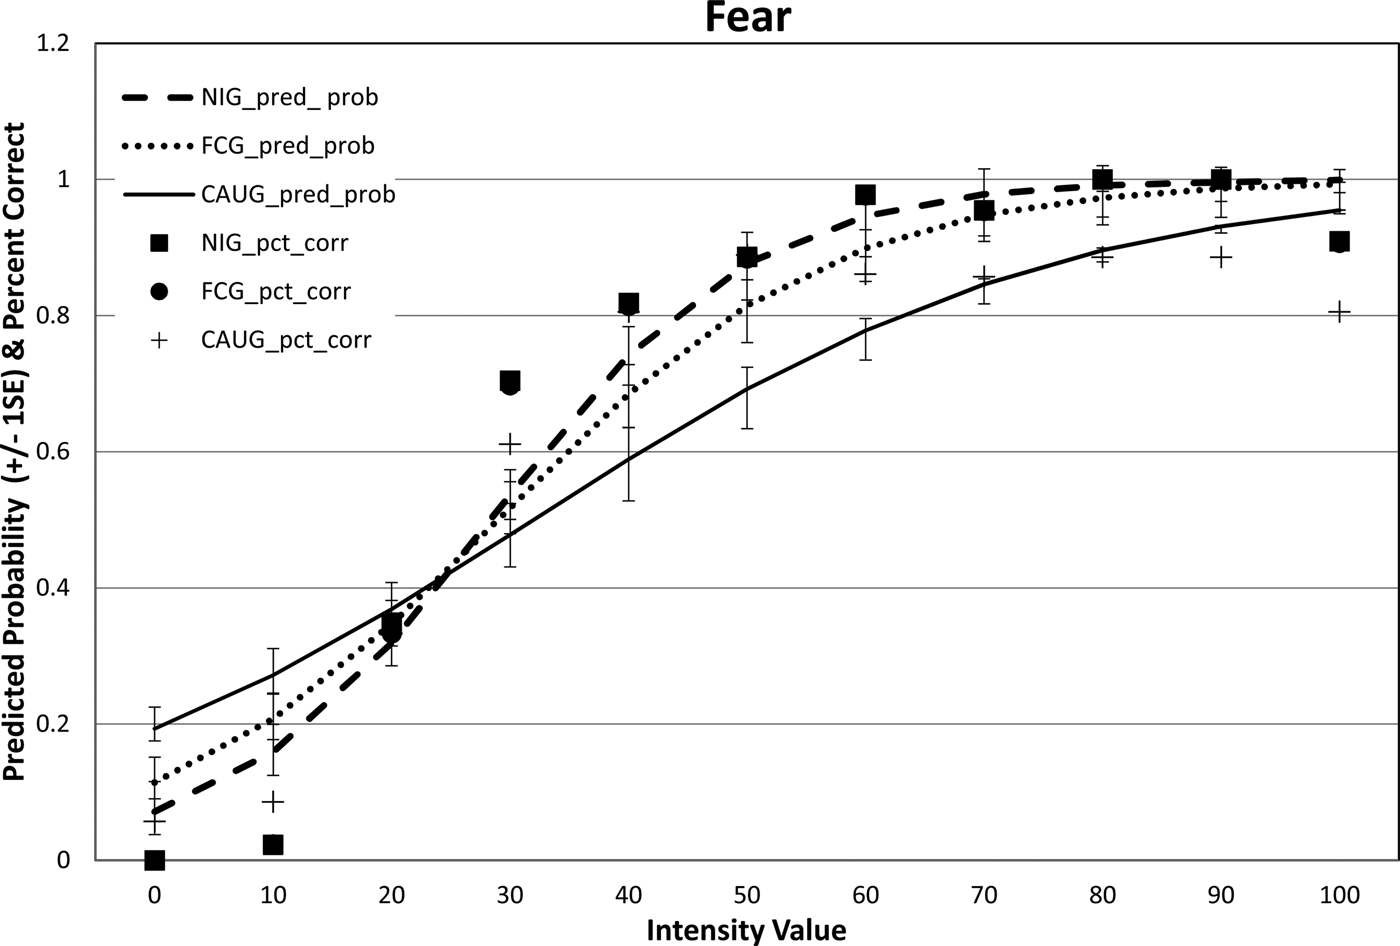
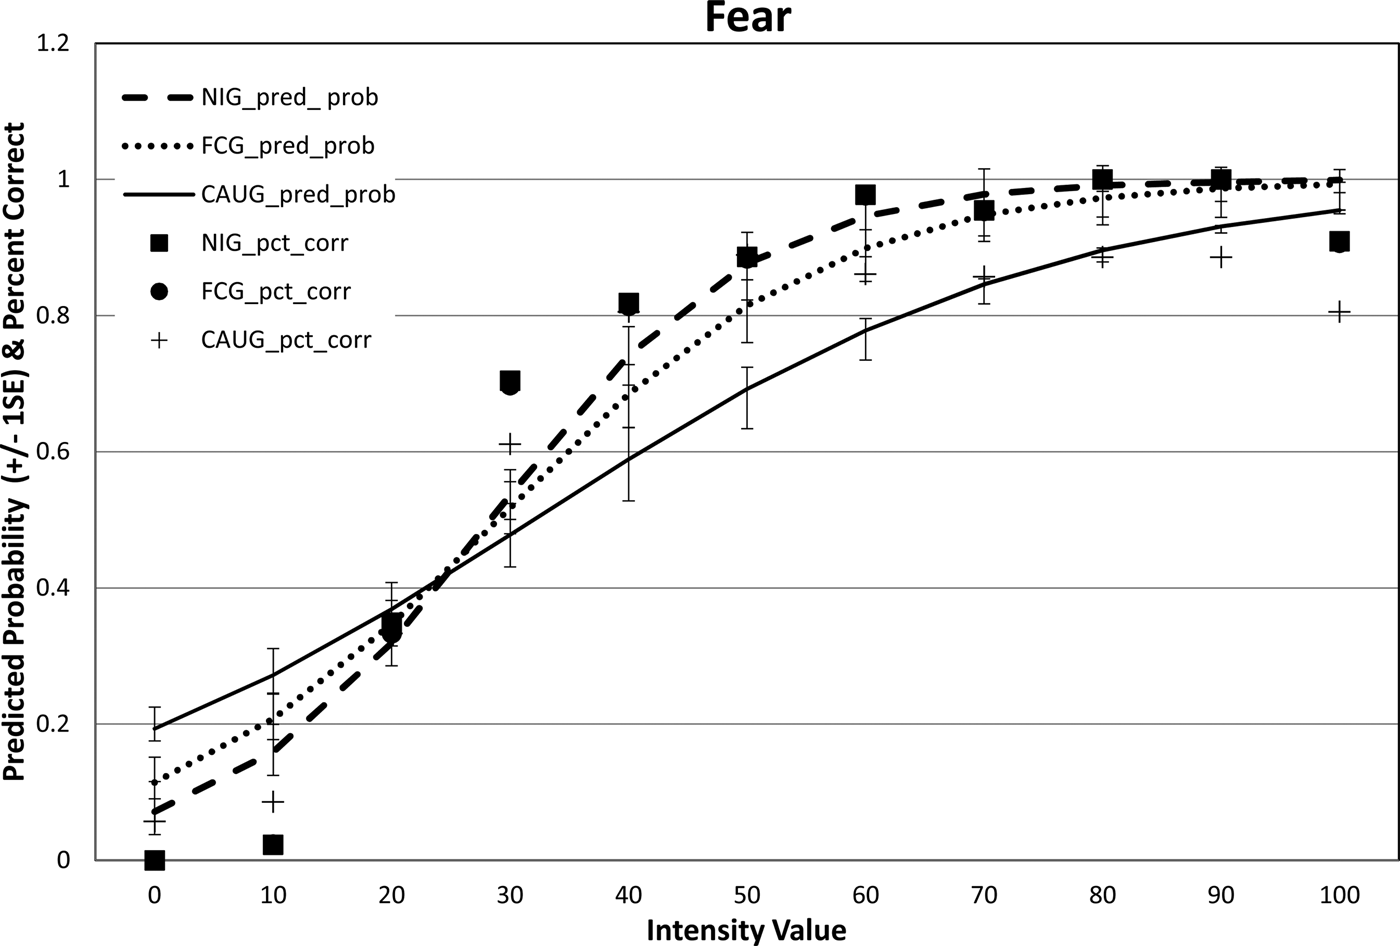
However, for fearful faces, there was a significant main effect of group (p = .026), which was qualified by a Group × Intensity interaction (p = .008). The main effect of group was driven by the CAUG having overall lower accuracy rates for identification of fearful faces, when compared with the NIG (p = .009). Overall accuracy rates did not significantly differ between the CAUG and FCG (p = .109). There were no significant differences in overall accuracy rates between the FCG and NIG (p = .258).
In terms of the significant Group × Emotion interaction, post hoc comparisons revealed that, in terms of the magnitude of the association between emotion intensity and accuracy, the CAUG's performance significantly differed from the FCG (p = .049) and the NIG (p = .004). As shown in Figure 6, the CAUG showed lower likelihood of correctly classifying fearful faces, especially at faces intensity values of 50% and higher, when compared with the FCG and NIG. There were no significant differences in accuracy rates at any intensity value in the NIG versus FCG (p = .24). This set of findings points to an intervention effect for the identification of fearful faces.
Associations between emotion intensity and response accuracy across the care as usual group (CAUG), the foster care group (FCG), and the never institutionalized group (NIG) for fearful faces. Estimated predicted probabilities from generalized estimating equation models are presented along with raw estimates of percentage correct across each group.
Misidentifications
The above models examined overall accuracy rates, defined in terms of whether an emotional face was accurately identified. However, inaccuracy could be due to either identification of the emotional face as neutral or identification of the emotional face with an incorrect emotion. In an effort to separate these two error types, in the next steps in our analyses, we did not count neutral responses as incorrect, given that all faces, with the exception of the extreme versions, contained some neutral emotion. Therefore, incorrect responses were now only calculated for cases in which one emotion was misidentified as another. A GEE was used to examine misidentification rates with group (CAUG, FCG, NIG) as a between-subjects factor and emotion (happy, fear, angry, sad) as a within-subjects factor.
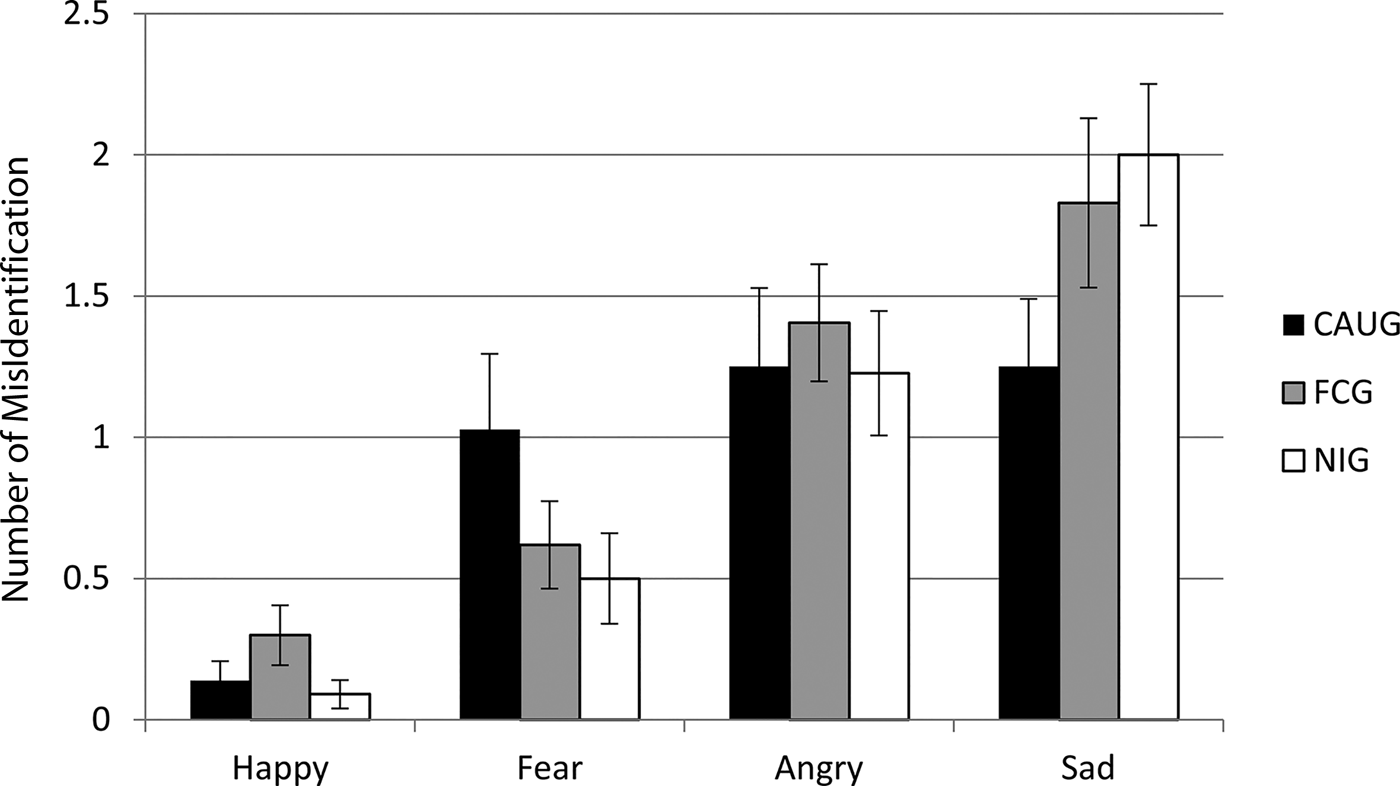
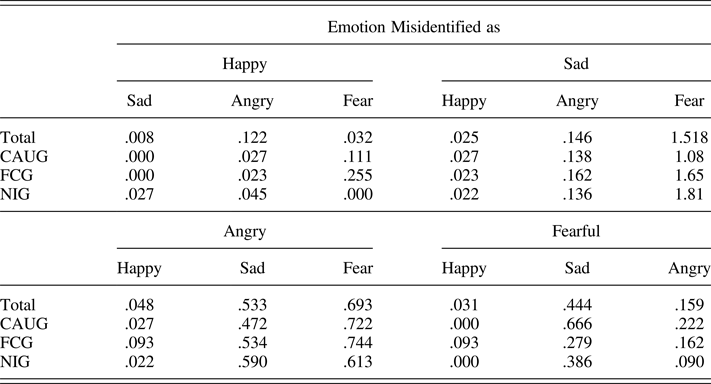
There was no main effect of group on likelihood of misclassifying one emotional face as another. However, there was a significant Group × Emotion Condition interaction. Inspection of results revealed that the likelihood of misclassifying a happy face as another emotional face was relatively small, across all groups. However, misclassification patterns for the negative emotions varied based on group membership. The CAUG showed approximately equal likelihood in misclassifying all negative emotions; that is, they appeared to struggle with classifying all of the negative emotions. In contrast, the FCG and NIG showed a more linear pattern in that they showed greater accuracy with fear identification, then angry identification, and the lowest accuracy for sad identification (see Figure 7). We also examined whether there was a specific pattern in misclassifications. Regardless of group status, children tended to misclassify angry faces as either fearful or sad, with no clear bias toward either misclassification. However, for all groups, sad faces were most commonly identified as fearful faces (see Table 1).
Misidentification rates for each emotion category across each group.
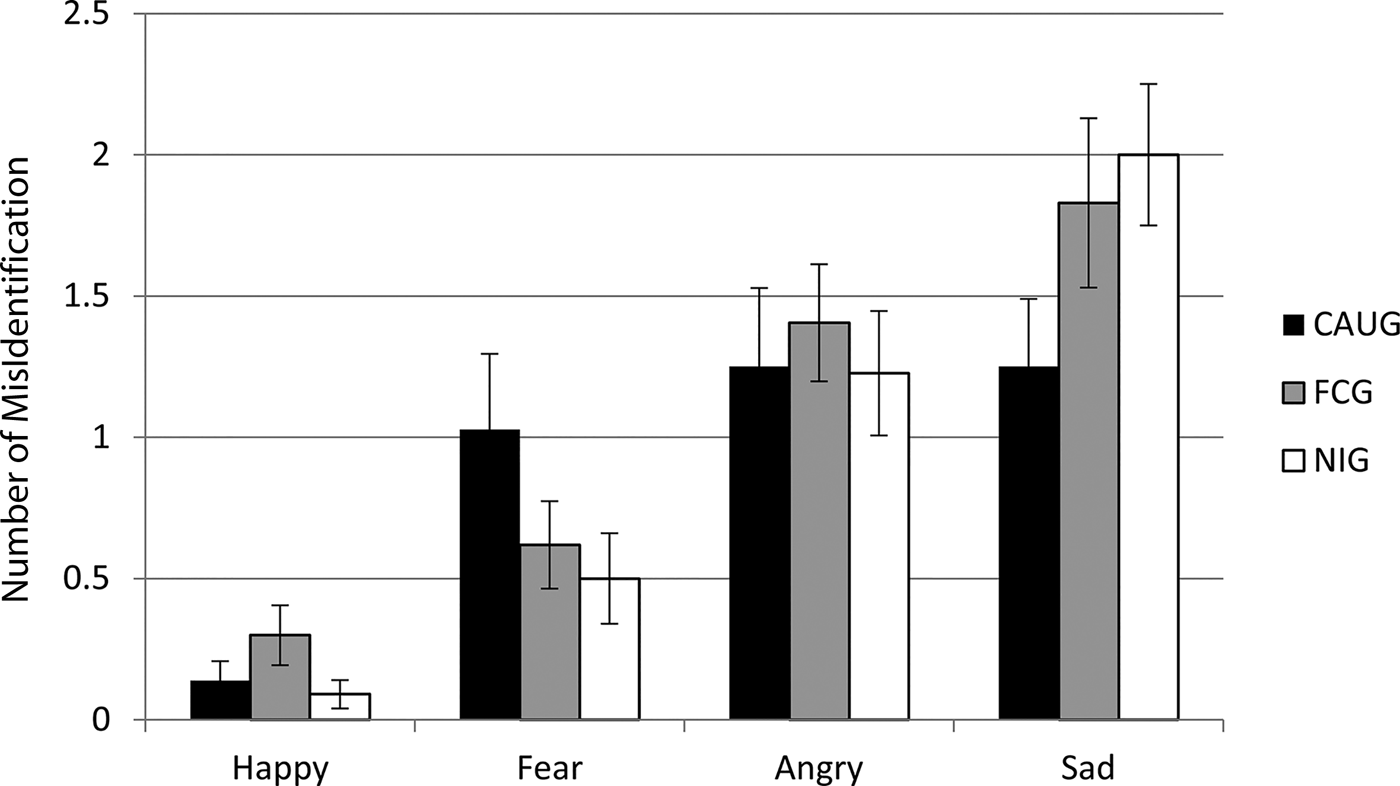
Number of misidentifications for the three groups for each emotion
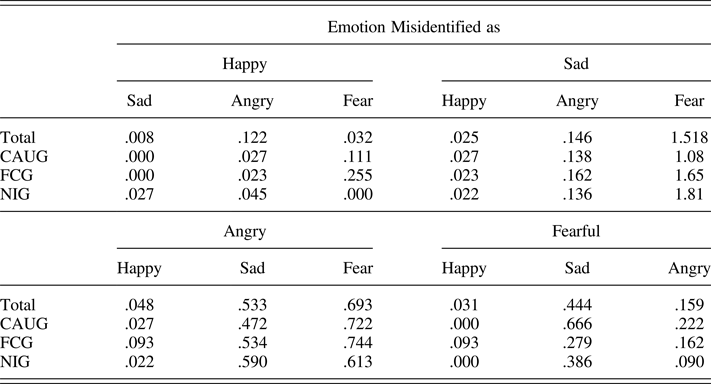
Note: CAUG, care as usual group; FCG, foster care group; NIG, never institutionalized group.
Emotion threshold
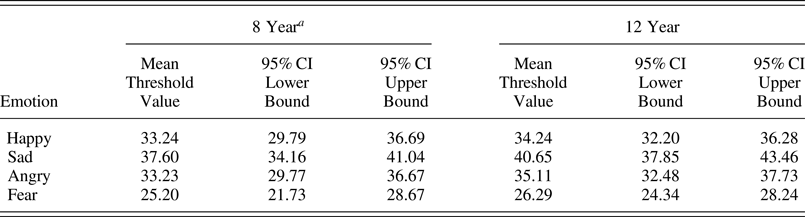
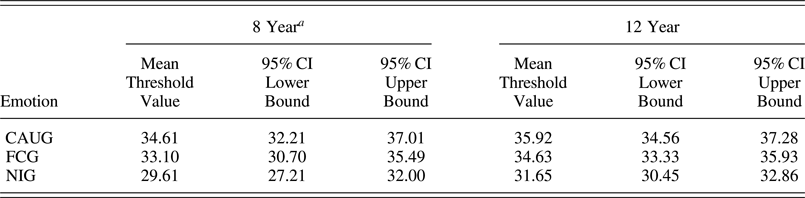
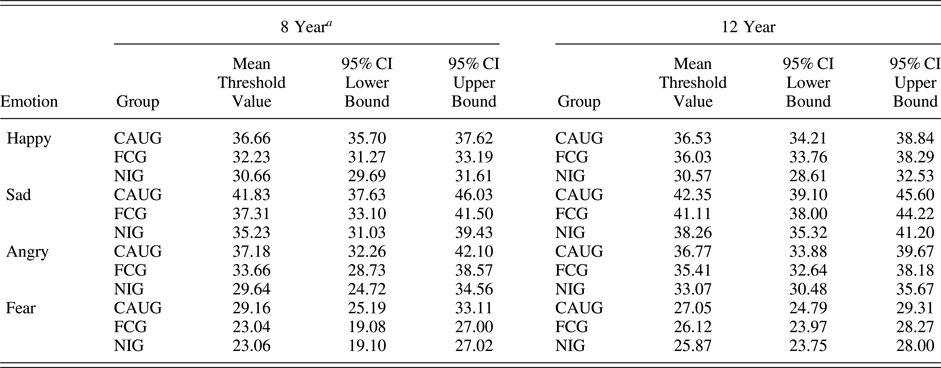
Finally, we calculated threshold values for each condition, defined as the point at which participants are equally likely to classify a face as emotional or not (the 50% point), consistent with prior work (Gao & Maurer, Reference Gao and Maurer2009). Using the NLS package in R version 3.30, we calculated threshold values for each group and emotion condition, using the same approach as in our prior report (Moulson, Westerlund, et al., Reference Moulson, Shutts, Fox, Zeanah, Spelke and Nelson2015). For each threshold value, we calculated Wald-type 95% CIs for each group and emotion. Nonoverlapping 95% CIs indicate significant group differences. Variability in threshold values indicated variability in the perceptual boundary, or intensity value at which faces are starting to be correctly identified. In other words, this gives an additional metric of task accuracy, in that later thresholds indicate that children began to consistently identify correctly emotional faces only when faces were more intensely displayed.
As in our prior report, we first fit marginal models for emotion and group. In our first model, we examined the effect of emotion, while collapsing across all groups. Table 2 displays threshold estimates and 95% CIs for happy, fear, sad, and angry emotion condition. Consistent with our prior report, threshold values for fear were significantly lower than all other emotions. This indicates that children required less perceptual information to correctly discriminate and identify a fearful face versus a neutral face. Threshold values for happy and angry did not significantly differ from each other. However, threshold values for sad faces were significantly higher than all other emotions. This indicated that children required more perceptual information to accurately discriminate and identify sad faces from neutral faces, relative to all other faces.
Thresholds for each emotion at two age points, collapsed across group
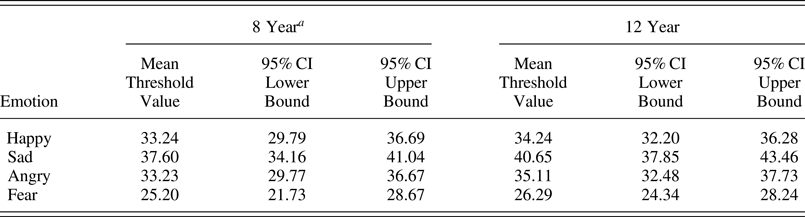
a According to Moulson et al. (Reference Moulson, Shutts, Fox, Zeanah, Spelke and Nelson2015).
In the second model, we examined the effect of group collapsing across all emotions. Table 3 displays the threshold estimates and 95% CIs for each group. Similar to our previous report, the NIG required significantly less perceptual information to differentiate between neutral and emotional faces, regardless of facial emotion condition, when compared with the CAUG and FCG. The threshold values for the CAUG and FCG did not significantly differ, when collapsing across emotions. Therefore, institutional rearing had a global effect on perceptual boundaries for distinguishing an emotional face from a neutral face, with no intervention effect evident.
Thresholds for each group at two age points, collapsed across emotion conditions
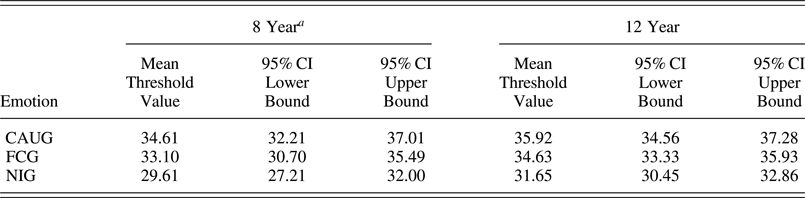
Note: CAUG, care as usual group; FCG, foster care group; NIG, never institutionalized group.
a According to Moulson et al. (Reference Moulson, Shutts, Fox, Zeanah, Spelke and Nelson2015).
Finally, we stratified analyses to examine whether groups differed in their identification thresholds across each emotion condition. Table 4 displays threshold estimates and 95% CIs for happy, fear, sad, and angry emotion conditions for each group. Similar to our previous reports, for the most part, 95% CIs overlap across all groups for the sad, angry, and fear conditions. However, threshold values for the NIG were significantly lower for happy faces when compared to the FCG and CAUG. Threshold values for the FCG and CAUG did not significantly differ from each other. This suggests that institutional rearing affected perceptual boundaries associated with discriminating a happy face from a neutral face, but did not affect boundaries for other emotional faces.
Thresholds for each group and emotion at two age points
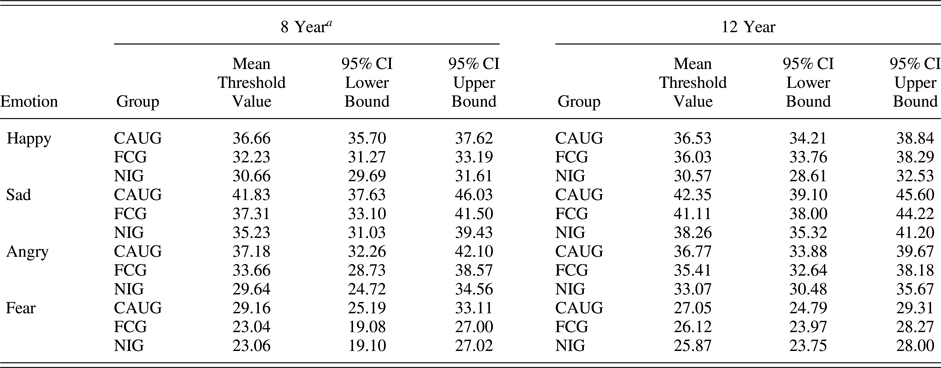
Note: CAUG, care as usual group; FCG, foster care group; NIG, never institutionalized group.
a According to Moulson et al. (Reference Moulson, Shutts, Fox, Zeanah, Spelke and Nelson2015).
Additional models considered
In follow-up models, we examined whether duration of institution rearing or timing of foster placement contributed to variability in performance on this task. The percentage of lifetime spent in institutional rearing up to this 12-year assessment was calculated for each child. For FCG children, the age at which they entered into foster care was also examined. Neither of these variables was significantly associated with accuracy rates, threshold values, or misidentification rates for any emotion condition as analyzed above.
We also tested whether variation in general cognitive functioning explained performance differences across groups. All group effects remained as reported above, even when full-scale IQ scores were entered as a covariate in each model.
Discussion
This study examined the developmental course of emotion recognition in late childhood among children with and without exposure to early neglect. Findings from this study contribute to the growing understanding of the development of facial emotion recognition in several ways. First, we extend knowledge on emotion processing and identification during late childhood/preadolescence, a phase of development during which relatively less is known, when compared to infancy or early childhood. Second, we expand on the understanding of the extent to which variability in the early social environment has a lasting impact on the development of facial emotion recognition. As in our previous reports, we show that some areas of emotion processing are affected by early deprivation, while others appear to be unaffected. Third, for certain areas associated with fearful face processing, we show that early intervention can have a lasting positive impact, with these effects extending into the late childhood/preadolescent period.
In this study, we used a facial morphing task, which was also used 4 years prior when children in this study were 8 years old. For this task, neutral facial expressions were morphed with happy, sad, angry, and fearful emotional facial expressions. Children were required to identify the emotion of each face at varying levels of intensity (0% to 100% extreme emotion). A relative advantage of this task is that it required children to identify emotions similarly to that which is encountered in a naturalistic setting (being potentially ambiguous and of lower intensity). It also allowed for an examination of more subtle deficits in emotion processing, which may not be apparent in tasks that exclusively rely on highly intense emotional faces. A second relative advantage is that we had an opportunity to compare performance across two developmental time points: one that took place in middle childhood, and another that took place once children reached late childhood and early adolescence.
The results from this current study overlap with our previously reported results in many ways (Moulson, Fox, Zeanah, & Nelson, Reference Moulson, Fox, Zeanah and Nelson2009). As reported previously, across the entire sample, we again observed that accuracy rates for highly intense versions of happy faces were higher than other emotion conditions. Therefore, at least at the extreme end of the emotion intensity spectrum, accuracy for fearful, sad, and angry faces remained significantly lower than for happy faces, but they (i.e., fearful, sad, and angry faces) did not significantly differ from each other. This suggests that even in late childhood, youth are highly capable of successfully distinguishing happy faces from neutral faces, but they have not reached the same level of proficiency for other negative emotions. An important caveat here is that the correct identification of happy faces may have been relatively easier than for negative emotions in this task, as happy was the only positive emotion included in this task. In addition, consistent with our prior report, we again observed that children in the CAUG, FCG, and NIG did not differ in their error rates at these extreme versions of emotional facial expressions. Therefore, as we previously reported, variation in the early social environment did not affect facial emotion recognition of the most extremely nonambiguous and intense emotional facial expressions.
While the above analyses only captured performance on the most unambiguous and extreme emotional faces, the next set of results took into account performance on the whole task, in which emotions ranged in intensities. Similar to our prior report, we again showed that all groups, regardless of their early rearing histories, showed lower thresholds for identifying fearful faces as compared with other emotions. In addition, as we previously reported, the highest thresholds were shown for sad faces. It has been shown that young children exhibit preferential attention to fearful faces, even when compared to other negative emotional faces, perhaps because fearful facial expressions convey critical threat-related information about the surrounding environment (Leppanen & Nelson, Reference Leppänen and Nelson2012). Due to a potential increase in salience of fearful faces, children may require less perceptual information (and therefore hold lower threshold values) for accurate recognition of fearful faces, when compared with happy, angry, or sad faces. In contrast, the accurate recognition of sad faces may require higher level cognitive and neural circuitry that continues to mature into late childhood and adolescence (Herba et al., Reference Herba, Landau, Russell, Ecker and Phillips2006).
When we compared the average thresholds or perceptual boundaries from the group of children at the 8-year assessment with those who remained at the current 12-year assessment, we saw very little change in the magnitude of values. This was the case for all emotion conditions. To our surprise, there were no emotion conditions for which threshold values decreased across groups from 8 to 12 years. This suggests that there is substantial stability between 8 and 12 years of age in terms of perceptual boundaries that are associated with face recognition. In other words, the 12-year-old children did not recognize facial emotions with less perceptual information than they did 4 years prior. We also saw stability in the hierarchy of emotion identification. Across the 8- and 12-year assessment, fearful faces continued to require the least amount of perceptual information, and sad faces required the most perceptual information before consistently accurate identification was achieved.
In terms of the effects of institutional rearing on perceptual boundaries of emotion categories, we found that the presence of group differences depended on emotion category. Although not observed for other emotions, institutionally reared children showed significantly higher threshold values when distinguishing happy faces from neutral, when compared with nonneglected children. This suggests that institutionally reared children required more perceptual information to accurately identify happy facial emotions, when compared to nonneglected children. Despite their higher threshold values (i.e., perceptual boundaries for deciding that a face is happy), as we mentioned above, the overall accuracy scores, or overall percentage in correctly identifying happy faces, were not affected. Therefore, the higher threshold appears to be a subtle effect that has little impact on ultimate abilities to accurately recognize happy emotional facial expressions.
There are some areas of performance that did differ from what we reported when children were 8 years of age. In the current assessment, we found an effect of institutional rearing on overall accuracy in identifying fearful faces. This finding was somewhat unexpected for two reasons. First, as we report in the sections above, we found no group differences in threshold values or perceptual boundaries for fearful face categorization. Second, this group difference was driven by accuracy rates in the CAUG actually decreasing as the fearful faces got more intense/less ambiguous. From our post hoc inspection, we observed a relative plateauing in the CAUG's performance. This seems to suggest that the CAUG lags behind in the extent to which they develop age-appropriate overall proficiency with the identification of more overt and unambiguous fearful faces. Yet this pattern was not observed on this same morphed faces task when children were 8 years of age. However, we did see group difference in the CAUG's processing of fearful faces on a separate task involving inhibitory control of emotional facial expression (Nelson et al., Reference Nelson, Westerlund, McDermott, Zeanah and Fox2013). This suggests that deficits in processing fearful faces may be a small (in magnitude) but somewhat consistent effect of institutional rearing. As we see these deficits more strongly at the 12-year assessment, it is possible that they become more prominent as children approach adolescence. Children in the FCG showed no deficits in response patterns to fearful stimuli. Their response patterns appeared identical to those of the NIG. This is the second time we have observed an intervention effect on face processing of fearful faces for the FCG, suggesting that entry into a responsive family home protects children against even more subtle but long-term impacts on facial emotion recognition.
In summary, data from this study demonstrated that emotion face recognition continues to mature into late childhood. For all children, regardless of institutional rearing histories, the processing of happy and fearful faces appeared to be relatively quick and accurate, while the processing of sad emotional expressions appeared to lag behind, at least in terms of accuracy and threshold levels. This same pattern was also observed in this sample 4 years prior, suggesting that few changes in emotion processing of happy faces take place between middle and late childhood. Further, we continue to show that early life experiences affect some areas of emotion processing, but not others. Areas that are affected involve the processing of fearful and happy faces. These two emotions are considered to develop early and reach proficiency before other emotions; therefore, the compromises we saw in these domains may represent a general lag in the extent to which institutionally reared children have met basic milestones in emotion processing skills. We showed that removal from neglectful conditions and entry into foster care protected institutionally reared children from developmental lags in fearful face identification. Future work should examine the extent to which these patterns of emotion processing persist as children enter early and later adolescence and early adulthood. A critical question will also concern the extent to which these more basic emotion processing skills are implicated in ongoing social, emotional, or interpersonal adjustment.