There is increasing interest in asset-based policies and interventions as a social investment strategy, and a number of countries have implemented or are exploring this new policy approach. In recent years, the asset-building discussion has expanded to include children, with the implementation of national asset-based policies targeting children in Canada, Singapore, South Korea and the United Kingdom. Underlying these policies and interventions is the premise that the possession and accumulation of assets lead to a range of positive effects in children. With regard to children's cognitive and educational outcomes such as math and reading achievements, it is postulated that higher levels of assets possessed and greater asset accumulation will be associated with improvement in children's cognitive and educational development over time, which, in turn, leads to better attainment in these areas. Little existing research, however, examines this premise from a dynamic perspective.
Proposed by Sherraden (Reference Sherraden1991), asset-based policies are, broadly speaking, public policies that encourage individuals to accumulate or hold assets. In the assets perspective, income refers to the flow of resources in the household that could be consumed to provide the household with daily necessities such as food, shelter, and clothing. Assets, on the other hand, refer to the storehouse of resources built over time. Income and assets both refer to resources, and differ only in the frame of reference of time. If resources received as income are not immediately consumed, then they become assets (Schreiner, Reference Schreiner2004). While assets typically refer to financial resources in asset-based policies, the policies are generally part of a strategy to encourage people to develop other assets, such as human capital, or real assets, such as a home or a business (Emmerson and Wakefield, Reference Emmerson and Wakefield2001; Loke and Sherraden, Reference Loke and Sherraden2006).
The assets perspective views household financial welfare as a long-term, dynamic process rather than as a cross-sectional financial position at a given time. Assets capture this long-term, dynamic quality better than income, because assets reflect lifetime financial accumulation or wealth (Sherraden, Reference Sherraden1991). Assets, as a storehouse of resources built over time, are used not to purchase life's necessities, but to create opportunities, secure a desired stature or standard of living, or to transfer class status to the next generation. Assets also facilitate investments in future aspirations, and enable people to seize opportunities that might otherwise be closed to them. Consequently, the opportunities available to the household members are enhanced (Sherraden, Reference Sherraden1991; Allen Consulting Group, n.d.).
Assets and children's educational outcomes
A growing body of empirical work supports the positive association of assets with children's cognitive and educational outcomes, beyond the effects of income (e.g., Boehm and Schlottmann, Reference Boehm and Schlottmann1999; Conley, Reference Conley2001; Sherraden, Reference Sherraden1991). Mayer (Reference Mayer1997b) finds that income from assets such as investments and inheritance explains more variance in children's educational test scores and achievement than does total family income. She concludes that the effects of income may be weaker and more modest than previously thought (Mayer, Reference Mayer, Duncan and Brooks-Gunn1997a). Hill and Duncan (Reference Hill and Duncan1987) find that the first dollar increase in asset income has a significant effect on the years of education completed by both sons and daughters. However, no significant effects were observed for the first dollar increase from parents’ labour, welfare and all other sources of income. Controlling for a host of parental, household and respondent characteristics, including income and maternal education, Zhan and Sherraden (Reference Zhan and Sherraden2003) find children's academic performance to be significantly associated with assets in the form of homeownership, while high school graduation is significantly associated with both homeownership and having savings of $3,000 or above. They also find that household total income has no significant effects on a child's academic performance or on children's high school graduation once assets are included in their regression models.
Studies also find assets to be associated with children's math and reading achievements. The relationship between assets and math achievement is generally positive. Controlling for income and other parental socio-demographic factors, parental wealth is found to be associated with math scores (Orr, Reference Orr2003; Williams Shanks, Reference Williams Shanks2007; Yeung and Conley, Reference Yeung and Conley2008; Zhan, Reference Zhan2006). The relationship between assets and reading achievement, however, is more tenuous. While some studies have found positive associations between assets and reading (Zhan, Reference Zhan2006), others failed to find significant associations (Williams Shanks, Reference Williams Shanks2007; Yeung and Conley, Reference Yeung and Conley2008).
The theory of welfare based on assets postulates that assets lead to various positive outcomes. Assets, however, can be experienced in the dimensions of possession, accumulation and consumption (Paxton, Reference Paxton, Bynner and Paxton2001). To have a better specification and understanding of the asset effect, the various dimensions of the asset experience need to be disentangled (Paxton, Reference Paxton, Bynner and Paxton2001).
Little research exists that examines the effects of asset accumulation (changes in asset holdings). Also, while research supports the association between assets and children's educational outcomes, much of this research is based on cross-sectional studies rather than longitudinal designs. Most longitudinal studies that do exist examine the association of assets held at a single time point on children's outcomes at a later time. For example, Zhan (Reference Zhan2006) measured assets at a particular year and children's outcomes two years later. Others pooled the asset data measured over several years or simply averaged the asset data over the period of observation (e.g. Orr, Reference Orr2003; Williams Shanks, Reference Williams Shanks2007; Yeung and Conley, Reference Yeung and Conley2008). In addition, studies on the effects of assets on children's educational outcomes generally measure children's outcomes at one time point, rather than changes in outcome measures over time. Thus, there is a gap in research on the effects of assets on children's outcomes from a dynamic perspective. Specifically, it will be helpful to learn whether increases in assets over time lead to improvements in child outcomes over the same period. This is, after all, the basis for asset-based interventions – to generate positive effects on assets by increasing asset holdings.
This paper addresses this gap in knowledge by testing the relationship between changes in parental assets and changes in children's math and reading scores over the course of six years. Parallel process models are used to test the proposition that a change in asset holding is associated with changes in math and reading performances in children. Parallel process latent growth models can test theory-based mechanisms of change by estimating how change in one construct, such as financial assets, influences change in another construct, such as academic achievement (Cheong et al., Reference Cheong, MacKinnon and Khoo2003). This approach goes beyond traditional methods by assessing both intra-individual (within person growth) change and inter-individual variation (between person differences) in change over time (Preacher et al., Reference Preacher, Wichman, MacCallum and Briggs2008).
Methods
Sample
Data for the analysis are drawn from the National Longitudinal Survey of Youth 1979 (NLSY79) and from the National Longitudinal Survey of Youth – Children and Young Adult (NLSY79CYA) datasets. The NLSY79 is a nationally representative panel study of 12,686 youths in the United States who were originally surveyed in 1979 and then re-contacted annually from 1979 to 1994 and biennially from 1994 to 2003. The NLSY79CYA consists of all children of women in the NLSY79 sample. The children have been assessed biennially from 1986 onwards on a variety of measures, including cognitive ability, temperament, motor and social development and others. As of 2004, a total of 11,428 children have been identified as having been born to the original 6,283 NLSY79 female respondents (Center for Human Resource Research, 2006).
The NLSY79 and NLSY79-CYA datasets are well suited for the purposes of this study for several reasons. First, the NLSY79 dataset contains detailed longitudinal information on assets that have been collected at relatively short regular intervals, and over a long period of time. Very few national representative datasets could compare in its richness of information on assets (Ratcliffe et al., Reference Ratcliffe, Chen, Williams, Nam, Schreiner, Zhan, Sherraden, McKernan and Sherraden2007). Second, the NLSY79-CYA provides data-rich information on the children of women of the NLSY79 sample biennially from 1986 onwards. Third, the quality of the data on wealth in the NLSY79 has also been evaluated to be comparable to other major surveys assessing wealth, such as the Survey of Consumer Finances, the Panel Study of Income Dynamics, and the Survey of Income and Program Participation (Engelhardt, Reference Engelhardt1998; Zagorsky, Reference Zagorsky1997). In addition, the NLSY79 maintains extremely high participation rates, with response rates of between 83.2 per cent and 92.5 per cent from 1988 and 2000 (Center for Human Resource Research, 2008). In addition, after 17 rounds of interviewing, 72.1 per cent of respondents answered the survey every single round (Zagorsky, Reference Zagorsky1999).
The sample for this study consists of children born in 1988 and 1989 who were ages five and six at wave 1 in 1994, and ages 11 and 12 at wave 4 in 2000. Biennial data on the children and their mothers from 1994 to 2000 have been drawn from the NLSY79CYA and NLSY79 datasets respectively and merged. In addition, only children with valid observations in 1994, and who resided with their mothers at least part of the time for the entire observation period from 1994 to 2000, are included in the sample. Standard errors for children from the same mothers are adjusted by clustering the data by mothers' identification codes. Custom weights provided by the Bureau of Labor Statistics for the children included in the sample are also used. The custom weights are available at http://www.nlsinfo.org/web-investigator/custom_weights.php.
Measures
PIAT Math and Reading. The Peabody Individual Achievement Test (PIAT) Math and Reading sub-tests were given to all children between the ages of 5 and 14 in the NLSY79CYA sample (Center for Human Resource Research, 2006). Standardised scores for the PIAT Math and Reading Recognition sub-tests, measured biennially for each child beginning at age five or six in 1994 through to 2000, were used for this study. The standardised scores are derived on an age-specific basis from the child's raw scores, have a mean of 100 and a standard deviation of 15, and range from 65 to 135 (Dunn and Markwardt, Reference Dunn and Markwardt1970).
The PIAT Reading tests are comprised of the Reading Recognition and the Reading Comprehension sub-tests. The PIAT Reading Comprehension sub-test is not used in this study as standardised scores are not available for a large percentage of children age seven and younger. This is because many of these younger children have raw scores that fall out of the range of the national PIAT sample used in the norming procedure (Center for Human Resource Research, 2006).
Both the PIAT Math and Reading Recognition sub-tests consist of 84 multiple choice items of increasing difficulty. A child looks at each problem then chooses an answer from one of four possible options. Testing stops when a child responds incorrectly to five out of seven items. The PIAT assessments are generally considered to be highly reliable and valid (Murphy et al., Reference Murphy, Conoley and Impara1994). Moreover, we consider math and reading scores to be accepted indicators of general academic achievement, and they have been used in evaluation of scholastic achievement and later adult outcomes (Heckman, Reference Heckman2006).
Net worth. Fifteen asset and debt measures are found in each round of data collection of NLSY79. The asset items are values of home, cash saving, stocks/bonds, trusts, business assets, car, other possessions, IRAs, 401(k)s and CDs. The debt items are mortgages, other property debt, business debt, car debt and other debt. The recent release of NLSY79 dataset includes a computed net worth variable, used in this study, which sums the asset measures less any liabilities. The net worth measure used in this study is adjusted for inflation to 2000 dollar values using the Consumer Price Index (CPI). As the net worth variable is highly skewed, we transformed it by taking the square root of the absolute value, then reinserting the sign (positive or negative) of the original variable to the transformed value. This method is used by the Partek software, a statistical analysis tool (Partek Software, n.d.).
Family permanent income. Total family income at each time point is derived by summing all sources of income from household members and adjusting for inflation to year 2000 values, using the inflation calculator provided by the Bureau of Labor Statistics at http://data.bls.gov/cgi-bin/cpicalc.pl. Family permanent income is computed by averaging the total family income from 1994 to 2000 to adjust for any short-term fluctuations in income (Blau, Reference Blau1999; Mayer, Reference Mayer1997b). This variable is rescaled to $10,000. As the skewness and kurtosis are within acceptable ranges, the variable is not transformed.
Control variables. Demographic, social and economic variables of parents and children are included in the analysis because of their potential influence on math and reading achievements, and on net worth. Child-level variables include the race and gender of the child, and whether the child has any conditions that may restrict school attendance or homework. Race is dummy-coded (black, Hispanic) with non-black and non-Hispanic as the reference group. Gender is also dummy-coded with female as the reference group. In addition, variables on whether there are restrictions on school attendance or on doing one's homework are also dummy-coded, with those having restrictions as the reference group.
Parent-level covariates include the mother's age at the birth of the child, and the mother's educational attainment and marital status as measured in 1994. Mother's educational attainment is dummy-coded (high school, more than high school), with mothers having less than high school as their highest grade completed as the reference. Marital status is dummy coded (married) with unmarried mothers being the reference group.
Analysis
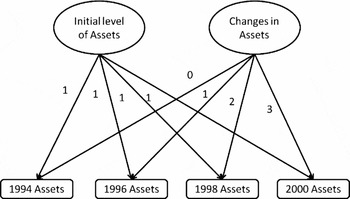
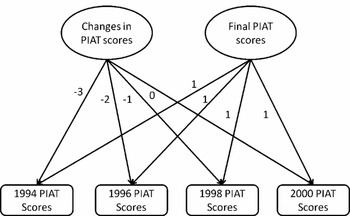
Latent growth curve modelling (LGCM) is used to estimate two separate parallel process models. Parallel Process Model 1 analyses the parallel processes of change in PIAT math scores and net worth. Parallel Process Model 2 constructs the same analysis using PIAT reading recognition and net worth. Using a structural equation modeling approach, we estimate an intercept factor and the change (slope) factor (Wickrama et al., Reference Wickrama, Lorenz, Conger and Elder1997). For each growth model, intercept values are estimated by fixing the factor loading of each time point to one. For the purposes of analysing the effect of assets at wave 1 on math and reading scores at wave 4, the slope factor loadings at these time points are constrained to be zero. Slope or latent change values are then estimated by assigning fixed loadings or time scores based on linear growth. Using LGCM, the mean values of initial status for assets and final status for PIAT math and reading scores, and changes in the levels of these constructs, are estimated. Inter-individual variation in the intercept and slope around the mean are estimated as well.
First, unconditional (or univariate) models (without covariates) are constructed for math, reading and net worth using the four time points (1994, 1996, 1998 and 2000) (see Figures 1 and 2). In these models, covariances between the latent intercept and change variables are also estimated. The Robust Maximum Likelihood (MLR) estimator in Mplus (Muthén and Muthén, Reference Muthén and Muthén1998–2008) was used to estimate these models. Missing data was handled using the full information maximum likelihood (FIML) approach, whereby the model is fitted to non-missing values for each observation, adjusting for the presence of missing values. FIML estimation has the strengths of single or multiple imputations, and has been found to yield similar estimates as multiple imputations in simulation studies (McCartney et al., Reference McCartney, Burchinal and Bub2006).
Latent Growth Curve Model for Assets.

Latent Growth Curve Model for PIAT Scores.

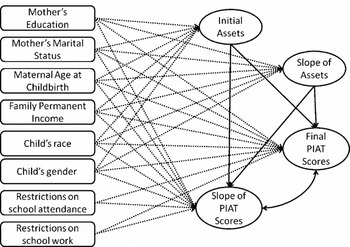
After unconditional model estimation, two parallel process models with covariates (mother's age at the birth of the child, mother's educational attainment, mother's marital status, the race of the child, the gender of the child, school and homework restrictions, and family permanent income) are estimated (see Figure 3). To test the theoretical model that changes in net worth predict changes in math and reading scores, the intercept and slope factors for math (Parallel Process Model 1) and reading (Parallel Process Model 2) are regressed on the intercept and slope factors for net worth.
Parallel Process Latent Growth Curve Model of Assets and PIAT Scores.

The goodness of fit between the hypothesised models and the observed data is evaluated using the Chi-square test, the relative chi-square (χ2/df) that takes into consideration sample size, the Tucker–Lewis Index (TLI), Comparative Fit Index (CFI) and the root mean squared error of approximation (RMSEA). Ratios of χ2 to degrees of freedom of less than 3:1 are indicative of an acceptable fit between the hypothetical model and the sample data (Carmines and McIver, Reference Carmines, McIver, Bohrnstedt and Borgatta1981). In addition, cut-off values of above 0.95 for TLI and CFI, and below 0.06 for RMSEA, are indicative of a relatively good fit between the hypothesised model and the observed data (Hu and Bentler, Reference Hu and Bentler1999).
Results
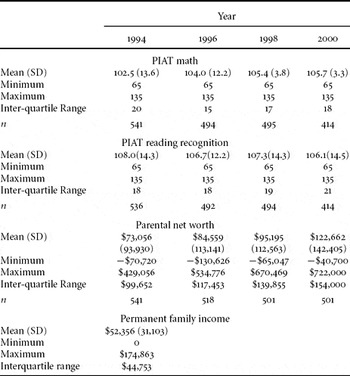
The final sample for the analysis consists of 541 children and their mothers. In the sample, there were a total of 523 mothers since 18 mothers have two children. Of these children, 23.5 per cent are identified as Hispanic, 31.8 per cent as black and 44.7 per cent as non-black and non-Hispanic. The sample is almost evenly split on the year of birth (55.3 per cent in 1988) and gender (51.8 per cent are males). As of 1994, 18.9 per cent of the mothers had less than a high school diploma, while 40.3 per cent had a high school diploma or a GED, and 40.9 per cent had at least a high school diploma. In addition, 44.7 per cent of the mothers were married. The mean and median age of the mother at the birth of the child was 27 years (SD = 2.3). The mean family permanent income is $45,510 per annum (SD = $29,825). Table 1 describes the sample means for the standardised PIAT Math and Reading Recognition scores, and the mean net worth of households from 1994 to 2000.
Descriptive statistics for standardised PIAT math and reading scores, parental net worth, and for permanent family income

Univariate growth curves
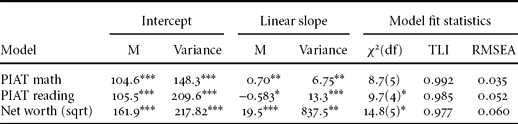
Before testing the theoretical models, we estimated the univariate growth curves for all four waves of scores for PIAT Math, PIAT Reading, and for net worth (1994, 1996, 1998 and 2000). Both linear and quadratic growth trajectories were evaluated using chi-square values, and comparative fit indices. Linear growth models displayed superior model fit, and were used for all subsequent analyses. Table 2 summarises the results of the fitted growth curves. All three univariate growth curve models display good to moderate model fit, with relative chi-square values of less than 3, TLI values above 0.97, and RMSEA values of 0.6 or less. In addition, all three models display significant means and variances for the intercept and slope factors, indicating significant intra-personal changes as well as inter-personal differences for both the intercept values and change over time. For math achievement and the square root of net worth, there is significant intra-personal growth over the four waves. In addition, there are significant inter-personal differences in the initial levels of assets, the final math scores, and in changes in math achievement and assets over time. For reading achievement, the data indicate significant intra-individual declines in standardised reading achievement over time, and significant inter-individual differences in both the final standardised reading scores and rates of decline.
Estimates for growth parameters of univariate growth curves
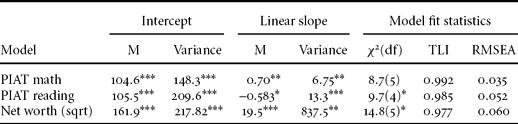
Notes: *p < 0.05. **p < 0.01. ***p < 0.001.
Parallel process model 1: net worth and math
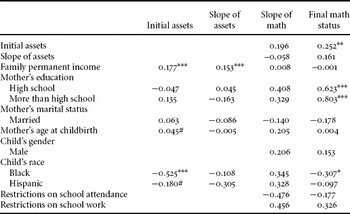
To test the theoretical model that the changes in assets are associated with changes in math outcomes, a conditional parallel process latent growth curve model with various covariates included as controls is estimated. In this model, the intercept (final math score) and slope factors for math are regressed on the initial level and slope for assets, restrictions on school attendance, restrictions on school work, child's race and gender, mother's educational attainment, marital status, age at childbirth and family's permanent income. Essentially, the model tests the proposition that initial asset holding (intercept) and accumulation (slope) will predict growth in math scores (slope), and later math achievement. The intercept and slope factors of net worth are regressed on child's race, mother's educational attainment, marital status, age at childbirth and family's permanent income.
The model displays acceptable model fit. The intercept factor for math is significantly associated with the intercept factor for net worth, indicating the initial level of assets held at wave 1 significantly predicts the final math scores at wave 4. The data also indicate that being black is associated with poorer math outcomes compared to non-black/non-Hispanic children. Children with mothers who hold high school diplomas or have more than high school education have better math outcomes compared to children with mothers who did not complete high school. The intercept factor for the math, however, is not statistically associated with the slope factor for assets.
With respect to the slope factor for math, the results suggest a positive association with the initial level of assets, though not quite at statistical significance. This may possibly suggest that higher initial levels of assets may be associated with faster increases in math scores over time. No other covariates are found to be significantly associated with the slope for math.
As for net worth, the data indicate significant associations between initial assets and being black, and between initial assets and family permanent income. The slope for assets is also significantly associated with family permanent income. Table 3 presents a summary of the findings for this model.
Parallel process latent growth curve model of math and assets (standardised coefficients)

Notes: χ2(69) = 102.04, p = 0.006; CFI = 0.982; TLI = 0.971; RMSEA = 0.030.
#p < 0.1; *p < 0.05; **p < 0.01; ***p < 0.001.
Parallel process model 2: net worth and reading
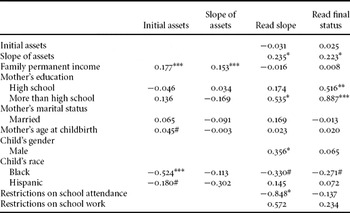
To test the theoretical model that changes in assets are associated with changes in reading outcomes, a second conditional parallel process latent growth curve model with various covariates included as controls is estimated. This model is identical to the earlier assets–math model in every respect, but with reading achievement in place of math achievement.
This model also displays acceptable model fit. The intercept factor for reading is significantly associated with the slope for assets, indicating that higher growth in assets is associated with better reading outcomes. In addition, the slope factor for reading is also positively associated with the slope factor for assets, indicating that the decline is slower for those with higher growth in assets.
The findings also indicate that children of mothers with high school diplomas or with higher than high school education have better final reading scores. In addition, the slope for reading is significantly associated with being male and having mothers with more than high school education. Table 4 presents a summary of the findings for this model.
Parallel process latent growth curve model of reading and assets (standardised coefficients)

Notes: χ2(68) = 100.03, p = 0.007; CFI = 0.983; TLI = 0.973; RMSEA = 0.030.
#p < 0.1; *p < 0.05; **p < 0.01; ***p < 0.001.
Discussion
This study disentangles the various dimensions of the asset effect (Paxton, Reference Paxton, Bynner and Paxton2001) by examining the dynamic association between assets (both possession and accumulation) and children's math and reading outcomes over time. Specifically, it tests the theoretical proposition of the assets effect theory that assets lead to better math and reading outcomes for children. At the outset, it was expected that higher levels of initial assets would be associated with greater improvement in math and reading achievements, and with better final math and reading scores. In addition, higher asset accumulation was expected to be associated with better final math and reading scores, and with higher growth (or slower decline) in math and reading achievements.
Congruent with expectations, our results suggest that assets are positively associated with math outcomes. However, the relationship between assets and math scores may be more complex than previously indicated. We find final math scores to be positively associated with the initial level of assets held at the beginning of the observation period six years earlier, controlling for race, mother's educational attainment, mother's marital status, permanent family income, maternal age at time of birth, school and homework restrictions and gender of the child. The results also indicate that family permanent income is not significantly associated with subsequent math achievement. This is consistent with prior research that also finds positive associations between assets held at one particular point in time and math achievement at a later time, and the non-significant effect of income (see Williams Shanks, Reference Williams Shanks2007; Zhan, Reference Zhan2006). Also consistent with earlier studies, our results suggest a racial gap in math achievement (Orr, Reference Orr2003; Yeung and Conley, Reference Yeung and Conley2008), with African Americans having significantly lower final math scores compared to their non-black /non-Hispanic counterparts.
Contrary to expectations, we find that asset accumulation is not statistically associated with final math scores. It is plausible that the speed at which levels increase is not associated with math achievement. Coupled with previous research that found increases in assets to be associated with better math scores (Loke and Kim, Reference Loke and Kim2008; Williams Shanks, Reference Williams Shanks2007), it is possible that experiencing growth in assets in more important than the speed of that growth in influencing math outcomes. It is also plausible that this finding is due to methodological limitations. Latent growth curve modeling makes the assumption that there is a single growth trajectory for the whole population. However, this assumption may not be valid. Families may have different asset trajectories, with different effects on math scores. Future research should explore using methods that allow for multiple trajectories to further clarify the relationship between asset growth and math scores.
When examining the growth in math achievement, we find no significant associations with either the initial level of assets held or change in assets. In fact, none of the covariates, including family permanent income, has significant associations with growth in math achievement. It is possible that the lack of significant associations is due to math scores being relatively stable over the six-year period of observation. While the unconditional latent growth curve model of math achievement indicates significant intra- and inter-personal increase in math scores, the model-estimated mean math score increased only slightly from 102.5 at wave 1 to 105.7 at wave 4.
With respect to reading recognition test scores, the data indicate that the standardised reading scores declined over the six years, falling from a model-estimated mean of 108 at the first wave to a mean of 106.1 at wave 4. Although a decrease in PIAT reading scores appears problematic, a closer examination of the data indicates that the children continued to have above-average reading achievement, with mean standardised scores of more than 100 at each wave. Rather than an actual drop in reading achievement, the data indicate that the extent to which these children outperformed the norm sample declined the older they got.
Previous studies on the effects of assets on reading achievement have been mixed. Results from this study indicate that the initial level of assets is not significantly associated with children's subsequent reading achievement, and is consistent with some earlier studies (e.g. Campbell, Reference Campbell2007; Williams Shanks, Reference Williams Shanks2007). However, results suggest that higher growth in assets are associated with better reading scores at the final wave, controlling for various parental and child covariates. Moreover, the slope factor for assets is positively associated with the slope factor for reading achievement, indicating that increases in assets mitigate the decline in standardised reading scores over time. These results lend support to the idea that accumulation of assets is associated with better reading outcomes. It is possible that the effect of assets on children's reading outcomes is played out mainly through the experience of asset accumulation rather than asset possession, thereby explaining the non-significant findings in this and other studies with regard to asset holding. Additional research is needed to explore the association between various asset experiences and their effects.
Consistent with earlier studies (e.g. Yeung and Conley, Reference Yeung and Conley2008; Zhan, Reference Zhan2006), we do not find any statistically significant associations between family permanent income and any of the children's outcome measures in the parallel process models for reading and math. Overall, the findings of this study lend support to the postulations of asset theorists that assets lead to positive child outcomes, above and independent of the effects of income. In addition, consistent with extant literature, the data indicate that racial inequalities persist in children's final math scores, controlling for various parental- and child-level covariates, including parental education, family permanent income, and family assets (e.g. Orr, Reference Orr2003). Results also indicate that, controlling for mother's educational attainment, marital status and age at birth of child, the growth in family net worth over time is not associated with race. This suggests that the difference in net worth seen across races could be due to the starting levels of asset possession and the inelasticity of class structures, rather than to the difference in asset growth among racial groups. Future studies seeking to understand the racial gap in assets held and accumulated over time should consider the role of intergenerational transfers of wealth, as well as what Shapiro and Johnson (Reference Shapiro, Johnson and Sherraden2005) term ‘transformative assets’.
Overall, results of this study indicate that the relationship between assets and children's educational outcomes is somewhat complex. We find that different dimensions of the asset experience may lead to different outcomes. For example, the initial level of assets is associated with math scores, but not reading scores, and changes in assets are associated with changes in reading scores, but not changes in math scores. We also find that the same dimension may have different effects depending on outcomes. Future research is needed to unpack the effects of the different dimensions of the asset experience (Bynner, Reference Bynner, Bynner and Paxton2001; Paxton, Reference Paxton, Bynner and Paxton2001).
Implications for asset-based policies for children
In recent years, the asset-building discussion has shifted to include children. A number of countries have now implemented asset-based policies to encourage families to accumulate assets for their children starting from birth or near birth so as to improve the life chances of the next generation. Among these countries are Singapore, the United Kingdom, South Korea and Canada. Discussions and proposals are also underway in several other countries, including the United States (Loke and Sherraden, Reference Loke and Sherraden2009).
Asset-based policies for children vary in their design, focus and features. In the United Kingdom, for example, the government establishes a tax-advantaged Child Trust Fund (CTF) account for every newborn with an initial contribution of £250 (or £500 for children from less-advantaged households) at birth and an additional top–up at age seven. In Singapore, every child from birth to age six has a Child Development Account (CDA). Savings made into these accounts before age six attract a one-to-one government match up to a cap of between S$6,000 to S$18,000, depending on the birth order of the child. In Canada, the Canada Education Savings Grant (CESG) provides for a government match of between 20 per cent and 40 per cent, depending on family income, on the first C$500 saved each year in a Registered Education Savings Plan account. In addition, children from less-advantaged families receive an initial contribution of C$500 to start the savings process, and an annual grant of C$100, under the Canada Learning Bond (CLB).
The dimension of the asset experience emphasised in each policy also differs. In the case of the CTF, the focus is primarily on possession as evidenced by the unconditional asset transfers by the government into the CTF accounts and minimal incentives for accumulation. CDAs in Singapore, on the other hand, focus on asset accumulation, with government asset transfers through a system of substantial savings match contingent on private contributions into the CDA accounts. The Canadian policy, in contrast, incorporates both asset possession and accumulation through its system of awarding grants through the CLB and a savings match through the CESG.
While not directly explored in this paper, the various policies also differ on the final dimension of Paxton's (Reference Paxton, Bynner and Paxton2001) asset experience – that of consumption. The CTF locks away the savings until the child reaches age 18, and monies in the Canadian policy are meant for post-secondary education. As such, the accumulation of assets in the children's accounts may have different effects on children's outcomes compared to parental accumulation, as the assets in the accounts could not be consumed, or withdrawn to smooth consumption, as the child is growing up. In the case of the CDAs in Singapore, savings (including government matches) in the accounts can be used without penalty for qualified developmental purposes for the child between birth and age six. Here, the distinction between parental and children's assets may be less clear, as both parental and child assets could be used during the childhood years to purchase products and services that may directly or indirectly impact on child outcomes.
It is not yet known if one policy design is better than the others, or if all of them are equally effective in achieving the desired asset effects. Our study suggests that the relationship between the different dimensions of the asset experience and various child outcomes may be rather complex. Different dimensions of the asset experience may lead to different outcomes, and the same dimension may also have different effects. Given the different purposes and desired outcomes of the different policies, additional research is needed to clarify which aspect(s) of the asset experience should be emphasised to achieve the best results.
This study makes several contributions. The first contribution is methodological in that this is one of the first studies to examine the dynamic associations of within and between individual changes in assets with children's educational outcomes over time. Previous studies have been based on static measures of assets and various child outcomes. Second, this study unpacks the asset experience into asset possession and asset accumulation over time, and examines the association of these two experiences on children's outcomes simultaneously. Earlier studies have mainly focused on one dimension of the asset experience. Third, the study extends earlier work on the assets perspective and adds to empirical support indicating positive associations between assets and children's outcomes, beyond the effects of income. Perhaps more importantly, the study indicates that the process of asset accumulation is indeed associated with better educational outcomes as envisioned by asset-based policies for children.
Limitations
However, this preliminary study is one of the first steps in demonstrating an association between asset trajectories and children's educational trajectories. Possible predictors and mediating pathways – such as the effects of parental expectations for their children's education, the quality of the home environment and neighbourhood and school factors that could have influenced children's educational achievement – have not been considered in the present analyses. Future studies should attempt to include and control for these factors. In addition, this study makes the assumption that there is a single growth trajectory for the whole sample. This may not be the case, and future research should explore models that allow for multiple growth trajectories. In this analysis, we were also unable to differentiate child assets from overall family asset holdings. Child assets may have different effects on children's educational outcomes than overall family wealth. Because we were unable to disentangle child assets from overall family assets, the assumption that child and parental assets have the same impact on academic achievement was untested. In a similar vein, this study does not distinguish between the effects of different sources of asset accumulation. Parental assets accumulated as a result of intra-familial transfers may have quite different effects compared to assets accumulated from economic market participation or from government-sponsored programmes. It is also possible that there is some unmeasured variable that explains economic class differences, asset accumulation and the effect of assets on children's educational outcomes. As such, our findings should be viewed with caution. Finally, this study uses net worth as the measure for assets, without considering other asset measures such as liquid assets, housing assets, etc. Previous studies suggest that the different asset measures may lead to different outcomes (Bynner, Reference Bynner, Bynner and Paxton2001; Nam and Huang, Reference Nam and Huang2009). Future research should examine the possible effects of different asset measures.
Nevertheless, the results suggest that assets may be positively associated with better math and reading achievement. However, asset possession and asset accumulation have different effects on different outcomes. Asset-based policies may be more effective when both initial contributions as well as incentives to encourage asset accumulation are provided, rather than having only one or the other. Asset-based policies should consider both dimensions of the asset experience in design and implementation.